. 2024 Nov 26;43(11):114986.
doi: 10.1016/j.celrep.2024.114986. Epub 2024 Nov 14.

Low-affinity ligands of the epidermal growth factor receptor are long-range signal transmitters in collective cell migration of epithelial cells

Affiliations

Low-affinity ligands of the epidermal growth factor receptor are long-range signal transmitters in collective cell migration of epithelial cells

Eriko Deguchi et al. Cell Rep. .

Abstract

Canonical epidermal growth factor (EGF) receptor (EGFR) activation involves the binding of seven EGFR ligands (EGFRLs); however, their extracellular dynamics remain elusive. Here, employing fluorescent probes and a tool for triggering ectodomain shedding, we show that epiregulin (EREG), a low-affinity EGFRL, rapidly and efficiently activates EGFR in Madin-Darby canine kidney (MDCK) epithelial cells and mouse epidermis. During collective cell migration, EGFR and extracellular signal-regulated kinase (ERK) activation waves propagate in an a disintegrin and metalloprotease 17 (ADAM17) sheddase- and EGFRL-dependent manner. Upon induced EGFRL shedding, low-affinity ligands EREG and amphiregulin (AREG) mediate faster and broader ERK waves than high-affinity ligands. Tight/adherens junction integrity is essential for ERK activation propagation, suggesting that tight intercellular spaces prefer the low-affinity EGFRLs for efficient signal transmission. In EREG-deficient mice, ERK wave propagation and cell migration were impaired during skin wound repair. We additionally show that heparin-binding EGF-like growth factor (HBEGF) primarily promotes surrounding cell motility. Our findings underscore the pivotal role of low-affinity EGFRLs in rapid intercellular signal transmission.

Keywords: ADAM17; CP: Cell biology; EGFR ligand; EREG; ERK activation wave; FRET; chemogenetics; collective cell migration; transgenic mice.


Conflict of interest statement

Declaration of interests The authors declare no competing interest.

Figures

Figure 1.
Figure 1.. EGFRL-ScNeos visualize the shedding of EGFRLs and stimulate EGFR
(A) Schematic of EGFRL-ScNeo expressed at the cell membrane. (B) Structure of EGFRL-ScNeos. SP, signal peptide; Pro, propeptide; Sc, mScarlet; EGF, EGF domain; TM, transmembrane domain; Neo, mNeonGreen; VV, two valine residues; Ig, immunoglobulin-like domain. (C) xy confocal images of EGFRL-ScNeos. Scale bar, 10 μm. (D) mScarlet/mNeonGreen fluorescence ratio of the cell membrane. The bar graphs show the mean values. Each dot represents the average value for one experiment (n > 100 cells/experiment). (E) Western blot analysis of total cell lysates of EGFRL-ScNeo-expressing cells. *Full-length EGFRL-ScNeo; **cytoplasmic domain with mNeonGreen. (F) The proportion of cleaved EGFRL-ScNeo in (E). The bar graphs show the mean values. Each dot indicates an independent experiment. (G) Western blot analysis of supernatants of EGFRL-ScNeo-expressing cells. (H) The production rates of EGFRL from a single EGFRL-ScNeo-expressing cell. The bar graphs show the mean values. Each dot indicates an independent experiment. (I) mScarlet/mNeonGreen ratio images of EREG-ScNeo-expressing MDCK cells upon treatment with 10 nM TPA or 10 μM marimastat (Video S1). Scale bar, 20 μm. (J) ERK activity of MDCK-4KO cells expressing EKARrEV-NLS stimulated with the supernatant of MDCK-4KO cells expressing HBEGF-ScNeo. Scale bar, 50 μm. (K) Time course of ERK activity in MDCK-4KO-EKARrEV-NLS cells stimulated with supernatant from MDCK-4KO cells expressing EGFRL-ScNeo. Solid lines represent the means from two independent experiments (n > 1,000 cells/experiment). (L) Maximum ERK activity from the time course shown in (K). The bar graphs show the mean values from three independent experiments. Each dot represents the average value for one experiment (n > 1,000 cells/experiment). See also Figure S1 and Video S1.
Figure 2.
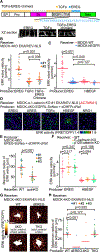
Figure 2.. EGFRL-ScNeo highlights short- and long-range EGFRLs
(A) Schematic of the co-culture experiment. Producer, EGFRL-ScNeo-expressing MDCK cells; receiver, parental MDCK cells. Producer and receiver cells were co-cultured at a 1:400 ratio. (B) Representative mScarlet confocal images of a single plane and z projection (20 slices) for each EGFRL, with producer cells identified by central signals above a threshold. Scale bar, 100 μm. (C) mScarlet signal gradient from producer cells in (B). Solid lines represent the means from three independent experiments, five images each. The gray bar indicates the threshold of detectable mScarlet signals. (D) Distance from producer cells to reach the threshold indicated in (C) is represented as dots. The red bars represent the means from three independent experiments, depicted by the three colors (n = 5 images/experiment). p values were calculated by a two-sample unpaired t test. (E) Identical to (B) except that the receiver cells were MDCK-Erbock cells, lacking all four ErbB-family receptors. Scale bar, 100 μm. (F) Three-dimensional images of HBEGF-ScNeo cells co-cultured with WT or MDCK-Erbock cells. Scale bar, 10 μm. (G) mScarlet confocal images of receiver and producer cells co-cultured with 0.1% DMSO or 5 μM surfen. Scale bar, 100 μm. (H) (Left) Schematic of flow cytometry analysis of co-culture experiments. (Right) The proportion of mScarlet-positive receiver-cells at different producer versus receiver ratios. The bar graphs show the mean values (n = 1 for 1:1 and 1:10, n = 2 for 1:100, n = 3 for 1:400). Each dot represents an independent experiment. p value was calculated by a two-sample unpaired t test. See also Figure S2.
Figure 3.
Figure 3.. Low-affinity EGFRLs propagate ERK activation more efficiently than high-affinity EGFRLs
(A) Schematic of the SLIPT system. (B) Time course of normalized FRET/CFP ratio for TSen stimulated with various mDcTMP concentrations. Values were normalized to the average pre-stimulation baseline (20 min). Solid lines and shaded areas represent means and SDs from three independent experiments (n > 100 cells/experiment). (C) miRFP703 and mScarlet/mNeonGreen ratio images of cells expressing AREG-ScNeo and eDHFR-cRaf. Images are snapshots of Video S2. Scale bar, 20 μm. (D) Schematic of SLIPT-induced EGFRL shedding and ERK activity observation. (E) Representative time-lapse ERK activity images. The white area at the center of the 0 min image indicates the EREG-producer cells. Scale bar, 100 μm. (F) Representative time-lapse ERK activity images. Each ligand producer is located at the center of the image. Images are snapshots of Video S3. Scale bar, 100 μm. (G) The time of maximum ERK activity in receiver cells in (F) after mDcTMP addition is plotted against the distance from the center. Each dot indicates a single cell. (H) Velocities of ERK waves propagated from each EGFRL producer. Each dot indicates a single producer-cell population. The red bars represent the means from three independent experiments, depicted by the three colors (n = 28 [EREG], 36 [AREG], 50 [TGF-α], 30 [HBEGF], and 23 [NRG1] producer-cell populations). p values were calculated by a two-sample unpaired t test. (I) Maximum radius of ERK waves propagated from each EGFRL producer. Data in (H) were used for the analysis. The red bars represent the means. p values were calculated by a two-sample unpaired t test. (J) Western blot analysis of the supernatant of each producer cell incubated with or without 10 μM mDcTMP. (K) The production rates of EGFRL from each producer cell in (J). The mScarlet intensities of HBEGF supernatant with mDcTMP were set as 1. See also Figures S3 and S4 and Videos S2 and S3.
Figure 4.
Figure 4.. Diffusion of EGFRL in the intercellular space is regulated by the affinity to and the density of EGFR on the basolateral plasma membrane
(A) (Top) Schematic of TGF-α-EREG chimera. (Bottom) mNeonGreen xz images of EREG, TGF-α, and a TGF-α-EREG chimera. Scale bars, 10 μm. (B) The velocity of the ERK wave propagated from each producer. Each dot indicates a single producer-cell population. The red bars represent the means from two independent experiments, depicted by the two colors (n = 30 [EREG], 26 [TGF-α], and 24 [TGF-α-EREG chimera] producer-cell populations). p values were calculated by a two-sample unpaired t test. (C) The velocity of the ERK wave propagated from each producer cell to WT or EGFR-overexpressing (O/E) receiver cells. Each dot indicates a single producer-cell population. The red bars represent the means from two independent experiments (n = 35 [EREG, WT], 41 [EREG, EGFR O/E], 32 [HBEGF, WT], and 12 [HBEGF, EGFR O/E] producer-cell populations). p values were calculated by a two-sample unpaired t test. (D) Representative ERK activity images in MDCK-α−1-catenin KO receiver cells. Each EGFRL producer cell is located at the center. Images were acquired 30 min after mDcTMP addition (Video S4). Scale bar, 100 μm. (E) Maximum radius of the ERK wave propagated from each EREG-producer cell to each receiver cell. Each dot indicates a single producer-cell population. The red bars represent the means from three independent experiments, depicted by the three colors (n = 38 [WT] and 42 [quinKO] producer-cell populations). p values were calculated by a two-sample unpaired t test. (F) The velocity of the ERK wave propagated from each producer cell to each receiver cell. Each dot indicates a single producer-cell population. The red bars represent the means from two independent experiments (n = 21 [EREG, WT], 21 [EREG, E-cadherin KO], 24 [EREG, p120-catenin KO], 18 [HBEGF, WT], 11 [HBEGF, E-cadherin KO], and 21 [HBEGF, p120-catenin KO] producer-cell populations). p values were calculated by two-sample unpaired t test. (G) Representative ERK activity images in MDCK-4KO-EKARrEV-NLS receiver cells. Each producer cell expressing eDHFR-cRaf is located in the white area. Images were acquired 20 min after mDcTMP addition. Scale bar, 50 μm. (H) Maximum radius of the ERK wave propagation in (G). Each dot indicates a single producer-cell population. The red bars represent the means. n = 23 (WT) or 25 (TKO) producer-cell populations from three independent experiments. n = 6 (4KO) producer-cell populations from two independent experiments. n = 11 (dEREG) producer-cell populations from a single experiment. p values were calculated by a two-sample unpaired t test. See also Figure S5 and Video S4.
Figure 5.
Figure 5.. HBEGF but not EREG promotes collective cell migration
(A) Schematic of the boundary assay. (B) Representative ERK activity images in receiver cells adjacent to each producer cell (Video S5). mDcTMP was added at 0 min. Scale bar, 100 μm. (C) Receiver-cell displacement adjacent to each producer cell. The red lines show the mean values. Each dot represents the average of a single field of view. n > 1,000 cells from three independent experiments, depicted by the three colors. p values were calculated by a two-sample unpaired t test. (D) Representative FRET/CFP images of receiver cells expressing ERK, tyrosine kinases, or ROCK biosensors. White arrowheads indicate the location of EGFRL-producer cells. Images were acquired 32 min after mDcTMP addition (Video S6). Scale bar, 100 μm. (E) ERK activity in 10 representative cells around EREG or HBEGF producers was plotted over time after mDcTMP addition. (F) FWHM of ERK activation in receiver cells. Each dot indicates a single receiver cell. n = 50 cells from a single experiment. See also Videos S5 and S6.
Figure 6.
Figure 6.. HBEGF but not EREG is sorted to late endosomes
(A) Schematic of the experiment. (B) MDCK-4KO receiver cells surrounding EREG-ScNeo or HBEGF-ScNeo producer-cells. Cells were fixed and stained with anti-EEA1 and anti-Rab7 antibodies. White circles and arrowheads indicate mScarlet-positive vesicles co-localized with EEA1 and Rab7, respectively. The gray area indicates the producer cells. Scale bar, 5 μm. (C) Fraction of mScarlet-positive vesicles co-localized with EEA1 or Rab7 from images in (B). The bar graphs show the mean values. Each dot represents the average of a single field of view. n = 2 fields of view from a single experiment. (D) MDCK-Erbock-ErbB1 receiver cells surrounding EREG-ScNeo or HBEGF-ScNeo producer cells. Cells were fixed and stained with anti-EEA1, anti-Rab7, and anti-RFP antibody. Scale bar, 5 μm. (E) The proportion of mScarlet-positive vesicles co-localized with Rab7 or EEA1 from experiments in (D). The bar graphs show the mean values. Each dot represents the average of a single field of view. n = 11 (EREG) or 9 (HBEGF) fields of view from three independent experiments.
Figure 7.
Figure 7.. EREG is required for collective cell migration of wounded mouse epidermis
(A) ERK activity images in migrating MDCK WT, dEREG, or dHBEGF cells. Scale bar, 200 μm. (B) Kymographs of ERK activity generated from time-lapse FRET/CFP ratio images. White arrowheads indicate the first ERK wave propagating from the leader cells. White arrows indicate ERK waves propagating from the leader cells 10 h after removing the confinement. (C) Length of ERK waves propagating from the leader cells 10 h after removing the confinement. Each dot indicates a single ERK wave. Each color represents data from a single experiment. The red bars represent the means. p value was calculated by a two-sample unpaired t test. (D) Representative images of single-cell trajectories 10 to 22 h after removing the confinement. Scale bar, 200 μm. (E) Displacement of MDCK cells at 10 to 22 h after removing the confinement. Each dot represents a single cell. n > 1,000 cells for each experiment. (F) Schematic of an in vivo imaging of ERK activity during wound healing of mouse ear skin expressing hyBRET-ERK-NLS. (G) Representative ERK activity images in WT or Ereg−/− mouse ear skin (Video S7). White arrows indicate ERK waves propagating from the wound edge (right black arrow). Scale bar, 100 μm. (H) Kymographs of ERK activity generated from time-lapse FRET/CFP ratio images. White and black arrows indicate ERK waves propagating from the wound edge (0 μm). (I) Displacement of mouse skin basal layer cells in 3 h toward the wound edge. Each dot represents a single cell. n > 1,000 cells for each mouse. See also Figure S6 and Video S7.

Update of

References

    1. Nishida E, and Gotoh Y (1993). The MAP kinase cascade is essential for diverse signal transduction pathways. Trends Biochem. Sci 18, 128–131. 10.1016/0968-0004(93)90019-j. - DOI - PubMed
    1. Yarden Y, and Sliwkowski MX (2001). Untangling the ErbB signalling network. Nat. Rev. Mol. Cell Biol 2, 127–137. 10.1038/35052073. - DOI - PubMed
    1. Linggi B, and Carpenter G (2006). ErbB receptors: new insights on mechanisms and biology. Trends Cell Biol 16, 649–656. 10.1016/j.tcb.2006.10.008. - DOI - PubMed
    1. Harris RC, Chung E, and Coffey RJ (2003). EGF receptor ligands. Exp. Cell Res 284, 2–13. 10.1016/s0014-4827(02)00105-2. - DOI - PubMed
    1. Jones JT, Akita RW, and Sliwkowski MX (1999). Binding specificities and affinities of egf domains for ErbB receptors. FEBS Lett 447, 227–231. 10.1016/s0014-5793(99)00283-5. - DOI - PubMed

Publication types