. 2024 Nov 15;20(11):e1011453.
doi: 10.1371/journal.pgen.1011453. eCollection 2024 Nov.

A non-canonical role of somatic Cyclin D/CYD-1 in oogenesis and in maintenance of reproductive fidelity, dependent on the FOXO/DAF-16 activation state

Affiliations

A non-canonical role of somatic Cyclin D/CYD-1 in oogenesis and in maintenance of reproductive fidelity, dependent on the FOXO/DAF-16 activation state

Umanshi Rautela et al. PLoS Genet. .

Abstract

For the optimal survival of a species, an organism coordinates its reproductive decisions with the nutrient availability of its niche. Thus, nutrient-sensing pathways like insulin-IGF-1 signaling (IIS) play an important role in modulating cell division, oogenesis, and reproductive aging. Lowering of the IIS leads to the activation of the downstream FOXO transcription factor (TF) DAF-16 in Caenorhabditis elegans which promotes oocyte quality and delays reproductive aging. However, less is known about how the IIS axis responds to changes in cell cycle proteins, particularly in the somatic tissues. Here, we show a new aspect of the regulation of the germline by this nutrient-sensing axis. First, we show that the canonical G1-S cyclin, Cyclin D/CYD-1, regulates reproductive fidelity from the uterine tissue of wild-type worms. Then, we show that knocking down cyd-1 in the uterine tissue of an IIS receptor mutant arrests oogenesis at the pachytene stage of meiosis-1 in a DAF-16-dependent manner. We observe activated DAF-16-dependent deterioration of the somatic gonadal tissues like the sheath cells, and transcriptional de-regulation of the sperm-to-oocyte switch genes which may be the underlying reason for the absence of oogenesis. Deleting DAF-16 releases the arrest and leads to restoration of the somatic gonad but poor-quality oocytes are produced. Together, our study reveals the unrecognized cell non-autonomous interaction of Cyclin D/CYD-1 and FOXO/DAF-16 in the regulation of oogenesis and reproductive fidelity.


Conflict of interest statement

The authors have declared that no competing interests exist.

Figures
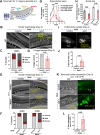
Fig 1
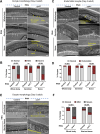
Fig 1. CYD-1 ensures optimal oocyte quality in wild-type.
(A) A diagrammatic representation of the right arm of C. elegans gonad. Schematics in Fig 1A were created using BioRender.com. (B,C) DIC images showing oocyte morphology of WT (day-3 adult) grown on control or cyd-1 RNAi. White arrows mark normal oocytes while yellow arrows mark poor-quality oocytes that have cavities or are misshapen (B). Oocyte quality scores (based on morphology) (C). The quality was categorized as normal, or mild or severe based on its morphology (cavities, shape, organization) as shown in S1G Fig. Combined data from three biological replicates (n ≥ 85) is plotted. Chi-square analysis was used to compare between groups. (D) Percentage of WT eggs (day-3 adult) that hatched on control or cyd-1 RNAi. Average of four biological replicates (n ≥ 50 for each replicate). Unpaired t-test with Welch’s correction. (E,F) Oocyte morphology in unmated or mated day-3 adult rrf-3(pk1426) worms grown on control or cyd-1 RNAi (E). Oocyte quality scores (based on morphology as shown in S1G Fig) (F). Combined data from three biological repeats (n ≥ 48) is plotted. Chi-square analysis was used to compare between groups. (G) The reproductive span of WT (selfed and mated worms) on control or cyd-1 RNAi. Data from three biological replicates is shown. P-value for mated worms on control versus cyd-1 RNAi at day-2 and day-3 is shown. Unpaired t-test with Welch’s correction. (H) The total number of hatched progenies in WT (selfed and mated worms) grown on control or cyd-1 RNAi. Average of four biological repeats. Unpaired t-test with Welch’s correction. (I,J) Representative DAPI-stained gonads of WT (day-3 adult) worms grown on control or cyd-1 RNAi. White arrows mark normal eggs while yellow arrows mark endomitotic oocytes (emos) (I). Quantification of percent endomitotic oocytes (J). Average of three biological replicates (n ≥ 25 for each experiment). Unpaired t-test with Welch’s correction. (K,L) Representative fluorescent images of unc-119::gfp worms (day-3 adult) grown on control or cyd-1 RNAi. White arrows mark normal eggs that do not show GFP expression, while yellow arrows mark endomitotic oocytes that express GFP (K). Quantification of unc-119::GFP expression positive endomitotic oocytes (L). Average of four biological replicates (n ≥ 25 for each experiment). Unpaired t-test with Welch’s correction. Scale bars: 20 μm. Error bars are s.d. Experiments were performed at 20°C. Source data are provided in S1 Table.
Fig 2
Fig 2. CYD-1 regulates oocyte quality cell non-autonomously from the somatic gonad (uterus).
(A,B) DIC images showing oocyte morphology of WT, rde-1(mkc36);sun-1p::rde-1 (germline-specific RNAi) and ppw-1(pk1425) (soma-specific RNAi) (day-3 adult) grown on control or cyd-1 RNAi. White arrows- normal oocytes, yellow arrows- oocytes with abnormalities (A). Quantification of oocyte quality score (B). The quality of oocytes was categorized as normal, mild or severe based on their morphology (cavities, shape, organization) as shown in S1G Fig. Combined data from three biological replicates (n ≥ 29) is plotted. Chi-square analysis was used to compare between groups. (C,D) DIC images showing the presence of eggs or endomitotic oocytes (emos) in the uterus of WT, rde-1(mkc36);sun-1p::rde-1 (germline-specific RNAi) and ppw-1(pk1425) (soma-specific RNAi) (day-3 adult) grown on control or cyd-1 RNAi. White arrows mark normal eggs while yellow arrows mark endomitotic oocytes (emos) (C). Quantification for endomitotic oocytes (D). Combined data from three biological replicates (n ≥ 25) is plotted. Chi-square analysis was used to compare between groups. (E,F) DIC images showing oocyte morphology of rrf-3(pk1426) (whole body RNAi) or rrf-3(pk1426);rde-1(ne219);fos-1ap::rde-1(genomic) (uterine tissue-specific RNAi) worms (day-3 adult) grown on control or cyd-1 RNAi. White arrows mark normal oocytes while yellow arrows mark oocytes with severe abnormalities (E). Oocyte quality scores (based on morphology as shown in S1G Fig) (F). Combined data from three (whole body KD) and four (uterine specific KD) biological replicates (n ≥ 58) are plotted. Chi-square analysis was used to compare between groups. Scale bars: 20 μm. Experiments were performed at 20°C. Source data are provided in S1 Table.
Fig 3
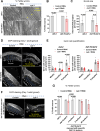
Fig 3. Depletion of cyd-1 leads to FOXO/DAF-16-dependent germline arrest under low insulin signaling.
(A,B) Representative images showing that cyd-1 RNAi results in sterility in daf-2(e1370) worms that are rescued in daf-16(mgdf50);daf-2(e1370). White arrowheads show eggs while yellow arrowheads show gonads with no eggs (sterile worms) (A). The percentage of fertile worms (B). Average of three biological replicates (n ≥ 30 for each experiment). Two-way ANOVA-Tukey’s multiple comparisons test. (C) The total number of hatched progenies in daf-2(e1370) and daf-16(mgdf50);daf-2(e1370) worms grown on control or cyd-1 RNAi. Average of three biological repeats. Two-way ANOVA-Tukey’s multiple comparisons test. (D,E) Representative fluorescent images of DAPI-stained gonads of daf-2(e1370) and daf-16(mgdf50);daf-2(e1370) (day-1 adult) worms grown on control or cyd-1 RNAi. Oocytes are boxed for clarity. White arrows point towards oocytes while yellow shows the absence of oocytes. Sp denotes sperms (D). Quantification of DAPI-stained germ cell nuclei. n = 17 (daf-2); n = 16 (daf-16;daf-2). (E) Each point represents the number of mitotic (MT), transition (TS) or pachytene zone (PZ) cells. Unpaired t-test with Welch’s correction. (F,G) Isoform requirement of DAF-16 to mediate germline arrest in daf-2(e1370). Representative fluorescent images of DAPI-stained germ line of daf-16(mgdf50);daf-2(e1370);daf-16a(+) worms grown on control or cyd-1 RNAi. Oocytes are boxed for clarity. White arrows point towards oocytes while yellow shows the absence of oocytes. Sp denotes sperms (F). Percentage of the fertile worms (G). The cyd-1 was knocked down in daf-2(e1370), daf-16(mgdf50);daf-2(e1370) as well as in strains where different DAF-16 isoforms were rescued in daf-16(mgdf50);daf-2(e1370). Average of three biological replicates (n ≥ 30 for each replicate). Two-way ANOVA-Tukey’s multiple comparisons test. Scale bars: 20 μm. Error bars are s.d. Experiments were performed at 20°C. Source data are provided in S1 Table.
Fig 4
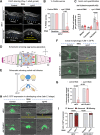
Fig 4. Depletion of cyd-1 in the somatic gonad (uterus) alone is sufficient to cause germline arrest under low insulin signaling.
(A,B) Representative images of DAPI-stained gonads showing no pachytene arrest in day-1 adult daf-2(e1370);rde-1(mkc36);sun-1p::rde-1 (germline-specific RNAi) worms upon cyd-1 KD. However, pachytene arrest ensues upon cyd-1 KD in daf-2(e1370);rrf-3(pk1426);rde-1(ne219);fos-1ap::rde-1 (uterine tissue-specific RNAi). Oocytes are boxed for clarity. White arrows point towards oocytes while yellow shows the absence of oocytes. Sp denotes sperms. Scale bar 20 μm (A). The percentage of fertile worms upon germline-specific and uterine-specific cyd-1 KD in daf-2(e1370) (B). Average of three biological replicates (n ≥ 25 per condition for each experiment). Unpaired t-test with Welch’s correction. (C) Quantification of DAPI-stained daf-2(e1370);rrf-3(pk1426);rde-1(ne219);fos-1ap::rde-1 (uterine tissue-specific RNAi) (day-1 adult) germ cell nuclei of different stages (mitotic (MT), transition (TS) or pachytene zones (PZ)); n = 11. Each point represents the number of mitotic (MT), transition (TS) or pachytene zone (PZ) cells. Unpaired t-test with Welch’s correction. (D) Schematic showing the egg laying apparatus of an adult C. elegans hermaphrodite. The egg-laying apparatus consists of the uterus, the uterine muscles, the vulva, the vulval muscles, and the egg-laying neurons. A stack of seven nonequivalent epithelial toroids (rings) forms the vulva. The anterior and posterior lobes of uterus each comprises of four uterine toroid epithelial cells (ut1–ut4). Adherens junctions connect the neighboring uterine toroids or vulval toroids, respectively. The uterine seam cell (utse) is an H shaped cell that connects the uterus to seam cells and thus holds the uterus in place. uv1-3 are interfacial cells between uterus and vulva (uv1 is a neuroendocrine cell). The process of egg-laying is made possible through the contraction of sex muscles, namely the vulval muscles (VM1,2) connected to the vulva lips and the uterine muscles (UM1,2) encircling the uterus. The activity of these muscles is under the regulation of motor neurons, specifically VCn (VC1-6) and HSNL/R, which form synapses with each other and with the vulval muscle arms. A = anterior, P = posterior, D = dorsal, V = ventral. Adapted from Wormbook (doi:10.3908/wormatlas.1.24). (E) Schematic showing the vulval cell divisions. The vulval precursor cells (VPCs) P5.p, P6.p and P7.p are induced to divide in the early L3 stage. Three rounds of cell division yield a total of 22 vulval cells by the end of L3 stage. The adult vulva is then formed through subsequent patterning and morphogenesis processes. Schematics in Fig 4D and 4E were created using BioRender.com. (F,G) Representative fluorescent and DIC merged images of gonads showing AJM-1::GFP (marks cell junctions) expression in daf-2(e1370) and daf-16(mgdf50);daf-2(e1370) worms (day-1 adult) grown on control and cyd-1 RNAi. Yellow arrows point towards abnormal expression. Scale bar 10 μm (F). Quantification of the normal or abnormal expression of AJM-1::GFP (G). Average of three biological replicates (n ≥ 24 for each experiment). Two-way ANOVA-Tukey’s multiple comparisons test. (H,I) Representative fluorescent and DIC merged images of gonads showing cdh-3::GFP expression in daf-2(e1370) and daf-16(mgdf50);daf-2(e1370) worms (late-L3 stage) on control, cyd-1 or egl-43 RNAi. Yellow arrows point towards abnormal expression. Scale bar 5 μm (H). Quantification for normal, reduced or missing cdh-3::GFP expression (I). Combined data from three biological replicates (n ≥ 36) is plotted. Chi-square analysis was used to compare between groups. Error bars are s.d. Experiments were performed at 20°C. Source data are provided in S1 Table.
Fig 5
Fig 5. Depletion of cyd-1 under low insulin signaling leads to DAF-16-dependent defects in sheath cells.
(A) Volcano plot showing the magnitude [log2(FC)] and significance [−log10(P value)] of the genes that are differentially expressed in L4-staged daf-2(e1370);rrf-3(pk1426);rde-1(ne219);unc-62p::rde-1(genomic) worms, grown on control or cyd-1 RNAi. Y axis [−log10(P value)] is restricted to a value of 10. (B) Schematic showing one of the two gonad arms of an adult C. elegans hermaphrodite. Sheath cells are colored green. Schematic in Fig 5B were created using BioRender.com. (C) Representative fluorescent and DIC merged images of gonads showing lim-7p::GFP (that marks the sheath cells) expression in daf-2(e1370) and daf-16(mgdf50);daf-2(e1370) worms (day-1 adult) grown on control and cyd-1 RNAi. The gonadal arm is outlined for clarity. Scale bar 20 μm. Quantification of the normal or missing expression of lim-7p::GFP is given below the figure. Combined data from three biological replicates (n ≥ 65) is plotted. Chi-square analysis was performed to compare between groups. (D) Representative fluorescent images of Phalloidin-stained (that marks the F-actin) gonads of daf-2(e1370) and daf-16(mgdf50);daf-2(e1370) worms (day-1 adult) grown on control and cyd-1 RNAi. Arrows point towards defects in the sheath cells. Scale bar 10 μm. Quantification of the normal or defective sheath cell structure (as per scoring scheme in S6D Fig) is shown on the right. Combined data from three biological replicates (n ≥ 12) is plotted. Chi-square analysis was performed to compare between groups. (E) Representative fluorescent images of DAPI-stained gonads of daf-2(e1370) and daf-16(mgdf50);daf-2(e1370) (day-1 adult) worms grown on control or sys-1 RNAi. Oocytes are boxed for clarity. White arrows point towards oocytes while yellow shows endomitotic oocytes or lack of oocytes. Scale bar 20 μm. The percentage of fertile worms is shown on the right. Average of three biological replicates (n ≥ 25 per condition for each experiment). Two-way ANOVA-Tukey’s multiple comparisons test. (F) Representative fluorescent images of gonads showing lim-7p::GFP (that marks the sheath cells) expression in WT worms (day-1 and day-3 adult) grown on control and cyd-1 RNAi. Arrows point towards defective/missing lim-7p::GFP expression in the sheath cells. The gonadal arm is outlined for clarity. Scale bar 20 μm. Quantification of the normal/defective or missing lim-7::GFP expression is given below the figure. Combined data from three biological replicates (n ≥ 39) is plotted. Chi-square analysis was performed to compare between groups. Error bars are s.d. Experiments were performed at 20°C. Source data are provided in S1 Table.
Fig 6
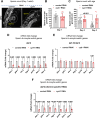
Fig 6. A defective sperm-to-oocyte switch may underlie germline arrest upon cyd-1 KD under low insulin signaling.
(A,B) Representative fluorescent images of DAPI stained daf-2(e1370) worms (early day-1 adult) grown on control and cyd-1 RNAi. Sperms are encircled for clarity. Scale bar 10 μm (A). Quantification of the sperm count (n = 21) (B). Each point represents the number of sperms per gonadal arm per worm. Unpaired t-test with Welch’s correction. (C) Quantification of the sperm count in daf-2(e1370) worms (day-2 and day-3 adults) grown on control and cyd-1 RNAi. Each point represents the number of sperms per gonadal arm per worm (n = 16). Two-way ANOVA-Tukey’s multiple comparisons test. (D) Quantitative RT-PCR analysis of sperm-to-oocyte switch genes in daf-2(e1370) worms (late-L4 stage) grown on control or cyd-1 RNAi. Expression levels were normalized to actin. Average of three biological replicates are shown. Unpaired t-test with Welch’s correction. (E) Quantitative RT-PCR analysis of sperm-to-oocyte switch genes in daf-16(mgdf50);daf-2(e1370) worms (late-L4 stage) grown on control or cyd-1 RNAi. Expression levels were normalized to actin. Average of three biological replicates are shown. Unpaired t-test with Welch’s correction. (F) Quantitative RT-PCR analysis of sperm-to-oocyte switch genes in daf-2(e1370);rrf-3(pk1426);rde-1(ne219);fos-1ap::rde-1 (uterine tissue-specific RNAi) worms (late-L4 stage) grown on control or cyd-1 RNAi. Expression levels were normalized to actin. Average of three biological replicates are shown. Unpaired t-test with Welch’s correction. Error bars are s.d. Experiments were performed at 20°C. Source data are provided in S1 Table.
Fig 7
Fig 7. Summary model.
Model showing combined effect of CYD-1 levels and DAF-16 activation state on the oogenesis and oocyte quality. Under wild-type conditions (normal insulin signaling) CYD-1 is required to maintain the oocyte health. Depletion of cyd-1 leads to a compromise in oocyte quality and an increase in endomitotic oocytes in the uterus. Interestingly, when DAF-16 is activated (in daf-2 worms), lowering CYD-1 levels results in DAF-16-dependent sheath cell defect which may possibly cause a failure in the sperm-to-oocyte fate switch, thereby halting oogenesis (pachytene arrest). Schematics in Fig 7 were created using BioRender.com.

Similar articles

References

    1. Jones KT, Lane SI. Chromosomal, metabolic, environmental, and hormonal origins of aneuploidy in mammalian oocytes. Exp Cell Res. 2012;318(12):1394–9. Epub 20120224. doi: 10.1016/j.yexcr.2012.02.012 . - DOI - PubMed
    1. May-Panloup P, Boucret L, Chao de la Barca JM, Desquiret-Dumas V, Ferre-L’Hotellier V, Moriniere C, et al.. Ovarian ageing: the role of mitochondria in oocytes and follicles. Hum Reprod Update. 2016;22(6):725–43. Epub 20160825. doi: 10.1093/humupd/dmw028 . - DOI - PubMed
    1. Meldrum DR, Casper RF, Diez-Juan A, Simon C, Domar AD, Frydman R. Aging and the environment affect gamete and embryo potential: can we intervene? Fertil Steril. 2016;105(3):548–59. Epub 20160123. doi: 10.1016/j.fertnstert.2016.01.013 . - DOI - PubMed
    1. Sanchez-Garrido MA, Tena-Sempere M. Metabolic dysfunction in polycystic ovary syndrome: Pathogenic role of androgen excess and potential therapeutic strategies. Mol Metab. 2020;35:100937. Epub 20200205. doi: 10.1016/j.molmet.2020.01.001 ; PubMed Central PMCID: PMC7115104. - DOI - PMC - PubMed
    1. Sasaki H, Hamatani T, Kamijo S, Iwai M, Kobanawa M, Ogawa S, et al.. Impact of Oxidative Stress on Age-Associated Decline in Oocyte Developmental Competence. Front Endocrinol (Lausanne). 2019;10:811. Epub 20191122. doi: 10.3389/fendo.2019.00811 ; PubMed Central PMCID: PMC6882737. - DOI - PMC - PubMed

MeSH terms

LinkOut - more resources