. 2024 Nov 15;20(11):e1012704.
doi: 10.1371/journal.ppat.1012704. eCollection 2024 Nov.

Distinct pathways for evolution of enhanced receptor binding and cell entry in SARS-like bat coronaviruses

Affiliations

Distinct pathways for evolution of enhanced receptor binding and cell entry in SARS-like bat coronaviruses

Alexandra L Tse et al. PLoS Pathog. .

Abstract

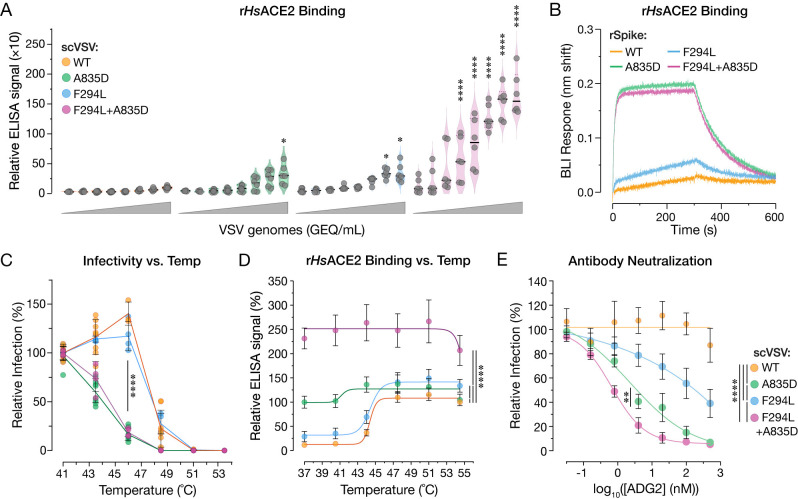
Understanding the zoonotic risks posed by bat coronaviruses (CoVs) is critical for pandemic preparedness. Herein, we generated recombinant vesicular stomatitis viruses (rVSVs) bearing spikes from divergent bat CoVs to investigate their cell entry mechanisms. Unexpectedly, the successful recovery of rVSVs bearing the spike from SHC014-CoV, a SARS-like bat CoV, was associated with the acquisition of a novel substitution in the S2 fusion peptide-proximal region (FPPR). This substitution enhanced viral entry in both VSV and coronavirus contexts by increasing the availability of the spike receptor-binding domain to recognize its cellular receptor, ACE2. A second substitution in the S1 N-terminal domain, uncovered through the rescue and serial passage of a virus bearing the FPPR substitution, further enhanced spike:ACE2 interaction and viral entry. Our findings identify genetic pathways for adaptation by bat CoVs during spillover and host-to-host transmission, fitness trade-offs inherent to these pathways, and potential Achilles' heels that could be targeted with countermeasures.


Conflict of interest statement

K.C. is a member of the scientific advisory board and holds shares in Integrum Scientific, LLC. K.C. is a cofounder of and holds shares in Eitr Biologics Inc.

Figures

Fig 1
Fig 1. SHC014-CoV S A835D allows for rVSV rescue and is conserved amongst sarbecoviruses.
(a) Summary of recovery attempts of rVSVs bearing SHC014-CoV spike proteins. Asterisk refers to rescue that yielded the A835D substitution. (b) Supernatants from 293FT cells co-transfected with plasmids encoding for VSV genomes expressing eGFP and WT or A835D variants of SHC014-CoV spike as well as helper plasmids, were used to infect Vero cells. Representative images show eGFP expression in Vero cells at indicated time points (days post-infection [dpi]). Scale bar, 100 μm. (c) Alignment of amino acid sequences in the FPPR region (rounded rectangle) for selected coronavirus spike proteins. Subgenera of the genus Betacoronavirus are indicated in italics (Sarbecovirus, Hibecovirus, Nobecovirus, Merbecovirus, and Embecovirus). Sarbecoviruses are color-coded by clade (1a: SARS-CoV–like, red; 1b: SARS-CoV-2–like, green; 2: Southeast Asian bat-origin CoV, blue; 3: non-Asian bat-origin CoV, purple). Spikes investigated in the current study are in bold.
Fig 2
Fig 2. A835D increases infectivity of cells in an ACE2-dependent manner.
(a) Parental DBT-9 cells or DBT-9 cells overexpressing HsACE2 or RaACE2 were infected with pre-titrated amounts of scVSV-SHC014-CoV WT or scVSV-SHC014-CoV A835D. Infection was scored by eGFP expression at 16–18 hours post-infection (average±SD, n = 5–8 from 3 independent experiments). A range of 7.2×10² to 4.5×10⁶ viral genome-equivalents (GEQ) was used. (b) Parental DBT-9 cells or DBT-9 cells overexpressing HsACE2 or RaACE2 were infected with CoV RDPs bearing WT or A835D SHC014-CoV spikes. Infection was scored by mNeonGreen expression at 16–18 hours post-infection (average±SD, n = 10–12 from 4–5 independent experiments). Ranges of 8.2×10³ to 1.8×10⁷ GEQ for WT and 6.1×10³ to 4.0×10⁷ for A835D were used. Infectivity (%) shown is the proportion of infected cells to the total number of cells for each viral dilution. Groups (WT vs. mutant for each cell line) were compared with Welch’s t-test with Holm-Šídák correction for multiple comparisons. ns p>0.05; ** p<0.01; *** p<0.001; **** p<0.0001. Only the statistically significant comparisons are shown.
Fig 3
Fig 3. A835D increases SHC014-CoV S binding to HsACE2.
(a) Genome-normalized amounts of scVSV particles bearing WT or A835D SHC014-CoV spike were diluted with serial 3-fold dilutions and loaded on an ELISA plate precoated with soluble HsACE2 and detected with a spike-specific mAb followed by an anti-human HRP-conjugated secondary antibody (average±SD, n = 6–8 from 3–4 independent experiments). A range of 1.6×10⁶ to 1.3×10⁸ viral GEQ was used. ELISA signal values were normalized to the highest absorbance for scVSV-SHC014-CoV WT for each replicate. Groups (WT vs. mutant) were compared with Welch’s t-test with Holm-Šídák correction for multiple comparisons. ns p>0.05; ** p<0.01; *** p<0.001; **** p<0.0001. (b) Sensorgrams of SHC014-CoV variant spikes and a pre-fusion SARS-CoV-2 spike stabilized with 6 proline substitutions (HexaPro) binding to HsACE2 by BLI. Similar response levels of spike were captured using an anti-T4 fibritin (foldon) antibody bound to BLI biosensors and subsequently dipped into wells containing 0.5 μM HsACE2. Traces of only one replicate of three are shown for clarity. (c) Graph of BLI binding response collected in triplicate for the indicated SHC014-CoV spike variants (average±SD). WT and A835D were compared by one-way ANOVA, with Dunnett’s correction for multiple comparisons. ns p>0.05; ** p<0.01; *** p<0.001; **** p<0.0001. Only the statistically significant comparisons are shown.
Fig 4
Fig 4. Structural determination of SHC014-CoV spike.
(a) Cryo-EM map and model of the WT SHC014-CoV spike. The cryo-EM map is shown for two protomers and the third protomer is shown as a ribbon representation. (b) Ala835 is proximal to Asp555 of the neighboring protomer, which is colored by electrostatic surface potential, red (negative) to blue (positive). Scale bar, -10 to +10 kT/e. (c) Ala835 makes van der Waals interactions with Val556 of a neighboring protomer (blue) and Val946 of the same protomer (orange). Lys837 (orange) makes a salt bridge with Asp601 of a neighboring protomer (blue). (d) S2 of one protomer (orange) and subdomain 1 (SD1) and RBD of an adjacent protomer (both in blue) are shown as ribbons to depict the distance between the Ala835-containing hydrophobic pocket to the RBD of the adjacent protomer. Labelled residues are shown as spheres.
Fig 5
Fig 5. A835D reduces thermostability of the SHC014-CoV spike.
(a) scVSV-SHC014-CoV S particles were incubated at various temperatures for 1 h and used to infect DBT-9 cells overexpressing RaACE2. (average±SD, n = 4–6 from 2–3 independent experiments). Infectivity levels were normalized to the infectivity percentage at 41°C for each virus. Area under the curve (AUC) values were calculated for each curve, and groups were compared by one-way ANOVA with Dunnett’s correction for multiple comparisons. (b) Pre-titrated amounts of scVSV-SHC014-CoV S particles were incubated at various temperatures for 1h and loaded onto HsACE2-coated ELISA plates. A spike-specific mAb and anti-human HRP-conjugated secondary antibody were used to detect the spike protein. 9.2×10⁶ viral GEQs per well were used. (average±SD, n = 12 from 6 independent experiments). ELISA signals were normalized to the absorbance observed for scVSV-SHC014-CoV WT at 53.5°C. Groups were compared by two-way ANOVA with Tukey’s correction for multiple comparisons, ns p>0.05; ** p<0.01; *** p<0.001; **** p<0.0001.
Fig 6
Fig 6. A835D and F294L substitutions enhance infectivity.
(a) Parental DBT-9 cells or DBT-9 cells overexpressing HsACE2 or RaACE2 were infected with pre-titrated amounts of scVSV-SHC014-CoV particles bearing WT, A835D, F294L, or F294L+A835D spike. Infection was scored by eGFP expression at 16–18 hours post-infection (average±SD, n = 5–8 from 3 independent experiments). A range of 1.5×10³ to 9.6×10⁶ viral GEQ was used. Infectivity (%) shown is the proportion of infected cells to the total number of cells for each viral dilution. Groups (WT vs. mutant for each cell line) were compared with Welch’s t-test with Holm-Šídák correction for multiple comparisons. ns p>0.05; ** p<0.01; *** p<0.001; **** p<0.0001. Only the statistically significant comparisons are shown. (b) Supernatants from 293FT cells co-transfected with plasmids encoding for VSV genomes expressing eGFP and WT, A835D, F294L, or F294L+A835D variants of SHC014-CoV spike as well as helper plasmids, were used to infect Vero cells. Representative images show eGFP expression in Vero cells at 24, 60, 108, 204, 252, 276, and 273 h post-infection [hpi]. Representative images are shown. Scale bar, 100 μm.
Fig 7
Fig 7. A835D and F294L enhance ACE2 binding but act through distinct mechanisms.
(a) Genome normalized amounts of scVSV particles bearing WT, A835D, F294L, or F294L+A835D SHC014-CoV spike were diluted with serial 3-fold dilutions and loaded on an ELISA plate precoated with soluble HsACE2 and detected with a spike-specific mAb followed by an anti-human HRP-conjugated secondary antibody (average±SD, n = 6–8 from 3–4 independent experiments). A range of 5.5×10³ to 1.2×10⁷ viral GEQ was used. ELISA signals were normalized to the absorbance observed for scVSV-SHC014-CoV WT at the highest number of viral genomes. Groups (WT vs. mutant) were compared with Welch’s t-test with Holm-Šídák correction for multiple comparisons. ns p>0.05; ** p<0.01; *** p<0.001; **** p<0.0001. (b) Sensorgrams of SHC014-CoV spike variants binding to HsACE2 by BLI. Spike variants were captured to similar response levels using an anti-T4 fibritin antibody bound to BLI biosensors and subsequently dipped into wells containing 0.5 μM HsACE2. One of three replicates is shown for clarity. (c) scVSV-SHC014-CoV S particles were incubated at various temperatures for 1h and used to infect DBT-9 cells overexpressing RaACE2. Infection levels were normalized to values observed at 41°C for each virus (average±95%CI, n = 4–8 from 2–4 independent experiments). AUC values were calculated for each curve, and groups were compared by one-way ANOVA with Dunnett’s correction for multiple comparisons. Statistical significance is shown for WT vs. A835D, WT vs. F294L+A835D, F294L vs. A835D, and F294L vs. F294L+A835D. Differences among all other two-way comparisons were not statistically significant (d) Pre-titrated amounts of scVSV-SHC014-CoV S particles were incubated at various temperatures for 1 h and loaded onto HsACE2-coated ELISA plates. A spike-specific mAb and anti-human HRP-conjugated secondary antibody were used to detect the spike protein. Absorbance values were normalized to that observed for scVSV-SHC014-CoV WT particles at 54.5°C. (average±95%CI, n = 12 from 3 independent experiments). 5.1×10⁶ viral GEQs were used per well. AUC values were calculated for each curve, and groups were compared by one-way ANOVA with Dunnett’s correction for multiple comparisons. (e) Pre-titrated amounts of scVSV-SHC014-CoV S bearing WT, A835D, F294L, or F294L+A835D spikes were incubated with serial 3-fold dilutions of mAb ADG-2 starting at 500 nM, at 37°C for 1 h. Virus:mAb mixtures were applied to monolayers of DBT-9 cells overexpressing RaACE2 cells. At 18 h post-infection, cells were fixed, nuclei were counterstained, and infected cells were scored by eGFP expression (average±SD, n = 9 from 3 independent experiments). Infectivity levels were normalized to the infectivity percentage with no mAb present for each virus. AUC values were calculated for each curve, and groups were compared by one-way ANOVA with Dunnett’s post hoc test, ns p>0.05; ** p<0.01; *** p<0.001; **** p<0.0001. Only the statistically significant comparisons are shown.

Update of

References

    1. Zhou H, Ji J, Chen X, Bi Y, Li J, Wang Q, et al.. Identification of novel bat coronaviruses sheds light on the evolutionary origins of SARS-CoV-2 and related viruses. Cell. 2021;184: 4380–4391.e14. doi: 10.1016/j.cell.2021.06.008 - DOI - PMC - PubMed
    1. Cohen LE, Fagre AC, Chen B, Carlson CJ, Becker DJ. Coronavirus sampling and surveillance in bats from 1996–2019: a systematic review and meta-analysis. Nat Microbiol. 2023;8: 1176–1186. doi: 10.1038/s41564-023-01375-1 - DOI - PMC - PubMed
    1. Temmam S, Vongphayloth K, Baquero E, Munier S, Bonomi M, Regnault B, et al.. Bat coronaviruses related to SARS-CoV-2 and infectious for human cells. Nature. 2022;604: 330–336. doi: 10.1038/s41586-022-04532-4 - DOI - PubMed
    1. Ge X-Y, Li J-L, Yang X-L, Chmura AA, Zhu G, Epstein JH, et al.. Isolation and characterization of a bat SARS-like coronavirus that uses the ACE2 receptor. Nature. 2013;503: 535–538. doi: 10.1038/nature12711 - DOI - PMC - PubMed
    1. Letko M, Marzi A, Munster V. Functional assessment of cell entry and receptor usage for SARS-CoV-2 and other lineage B betacoronaviruses. Nat Microbiol. 2020;5: 562–569. doi: 10.1038/s41564-020-0688-y - DOI - PMC - PubMed

MeSH terms

Substances