. 2024 Nov 15;22(11):e3002897.
doi: 10.1371/journal.pbio.3002897. eCollection 2024 Nov.

MosAIC: An annotated collection of mosquito-associated bacteria with high-quality genome assemblies

Affiliations

MosAIC: An annotated collection of mosquito-associated bacteria with high-quality genome assemblies

Aidan Foo et al. PLoS Biol. .

Abstract

Mosquitoes transmit medically important human pathogens, including viruses like dengue virus and parasites such as Plasmodium spp., the causative agent of malaria. Mosquito microbiomes are critically important for the ability of mosquitoes to transmit disease-causing agents. However, while large collections of bacterial isolates and genomic data exist for vertebrate microbiomes, the vast majority of work in mosquitoes to date is based on 16S rRNA gene amplicon data that provides limited taxonomic resolution and no functional information. To address this gap and facilitate future studies using experimental microbiome manipulations, we generated a bacterial Mosquito-Associated Isolate Collection (MosAIC) consisting of 392 bacterial isolates with extensive metadata and high-quality draft genome assemblies that are publicly available, both isolates and sequence data, for use by the scientific community. MosAIC encompasses 142 species spanning 29 bacterial families, with members of the Enterobacteriaceae comprising 40% of the collection. Phylogenomic analysis of 3 genera, Enterobacter, Serratia, and Elizabethkingia, reveal lineages of mosquito-associated bacteria isolated from different mosquito species in multiple laboratories. Investigation into species' pangenomes further reveals clusters of genes specific to these lineages, which are of interest for future work to test for functions connected to mosquito host association. Altogether, we describe the generation of a physical collection of mosquito-associated bacterial isolates, their genomic data, and analyses of selected groups in context of genome data from closely related isolates, providing a unique, highly valuable resource for research on bacterial colonisation and adaptation within mosquito hosts. Future efforts will expand the collection to include broader geographic and host species representation, especially from individuals collected from field populations, as well as other mosquito-associated microbes, including fungi, archaea, and protozoa.


Conflict of interest statement

The authors have declared that no competing interests exist.

Figures
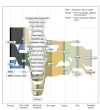
Fig 1
Fig 1. Origin of bacterial isolates in MosAIC.
Metadata category names and definitions follow those presented in S1 Table. “Unknown” denotes isolates for which a given metadata category is valid but missing. For example, a subset of mosquito samples could not be assigned a species but are derived from adult-stage mosquitoes. Where a given metadata category is invalid, the connection between bars is dropped. For example, feeding status is not a valid category for egg samples. All code and data to recreate this figure can be found at https://github.com/MosAIC-Collection/MosAIC_V1 in the folder “04_Sankey_Diagram.” MosAIC, Mosquito-Associated Isolate Collection.
Fig 2
Fig 2. Phylogeny of single species representatives from MosAIC, along with quality-assurance metrics for related genome assemblies.
(A) Maximum likelihood tree built using IQ-TREE2 and 16S rRNA gene sequences predicted with Baarnap. Each node is a species representative coloured according to class. Bars at each tip represent the number of isolates present in the species cluster, defined using a secondary clustering threshold of 95% ANI with dRep. Bars are colour coded according to family information obtained using the Genome Taxonomy Database and classifier GTDB-Tk. Numbers at the tip of bars delineate highly representative species clusters. Evolutionary scale is displayed on the bottom left of the figure panel. (B) Genome completeness and contamination metrics obtained using CheckM. Each point represents a draft genome assembly. Red lines indicate cutoffs for 98% completeness and 5% contamination. (C) Histogram showing average read coverage reported using QUAST. The vertical red line represents a 10× filter cutoff. (D, E) Histograms showing N50 values (the length of the shortest sequence within a group of sequences that represent 50% of the overall assembly) and genome size across the collection. Bars represent high-quality genomes within the collection (CheckM completeness >98%, contamination <5%, and >10X coverage). Bp = Base-pairs, Mbp = Mega base-pairs. (F) Number of isolates comprising the highly represented species (>5 isolates) within the collection. Each bar is coloured according to family and numbered according to their placement in the main phylogeny in panel (A). All code and data to recreate this figure can be found at https://github.com/MosAIC-Collection/MosAIC_V1. For Fig 2A, the code and data are in the folder “03_MosAIC_Phylogeny;” for Fig 2B–2E, they are in the folder “01_GenomeQC,” and for Fig 2F, they are in the folder “02_GTDB_Drep_Summary”.
Fig 3
Fig 3. Heatmap of the distribution of virulence factors across all MosAIC genomes.
Genes fall within one of 13 different categories (top). The guidance tree on the left is a maximum likelihood tree built using IQ-TREE2 and Baarnap-predicted 16S rRNA gene sequences from species clusters defined with dRep. Tiles denote the mean number of virulence factor genes identified within a given species cluster, following a gradient from blue (low) to yellow (high). Grey tiles denote species clusters for which zero predicted virulence factor genes were identified. Bacterial families are colour-coded in the figure legend. The bar chart on the right shows the total number of genes identified within each species cluster. All code and data to recreate this figure can be found at https://github.com/MosAIC-Collection/MosAIC_V1 in the folder “05_Virulence_Factor_Analysis.” MosAIC, Mosquito-Associated Isolate Collection.
Fig 4
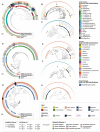
Fig 4. Selected population structures with improved mosquito representation.
Population structures based on previously published genomic collections for (A–C) Enterobacter [61], (D–F) Serratia [62], and (G, H) Elizabethkingia anophelis [60], with added mosquito-derived representation from MosAIC and an additional manually curated set of publicly available En. asburiae genomes. Phylogenies were built using a maximum likelihood approach within IQ-TREE2 [63] and 1,000 bootstraps, using SNP-filtered core gene alignments generated with Panaroo [64] and SNP-sites [65]. The rings of each population phylogeny (A, D, G) denote, from outer to inner, host from which the sample was isolated, genomic collection from which the genome originated, GTDB classifications for the MosAIC isolates, and NCBI classifications from the original studies for the non-MosAIC isolates. Evolutionary scales are displayed on the bottom left of the figure panels. To the right of each population tree are subsets highlighting mosquito-associated lineages within a population (B, C, E, F, H), with the coloured brackets corresponding to their location within a given population tree. The rings of each subset phylogeny denote: Host (as on the population phylogenies), then 3 outer rings that show additional metadata for the mosquito-derived isolates, 1 = whether the mosquito was lab-reared (L) or field-derived (F), 2 = the laboratory group that isolated the sample, comprising some MosAIC contributors and some groups that contributed to previous studies (Lab 1 = Kerri Coon and UW-Madison Capstone in Microbiology Students, Lab 2 = Michael Povelones, Lab 3 = Michael Strand, Lab 4 = Claire Valiente Moro, Lab 5 = Douglas Brackney, Lab 6 = Eric Caragata, Lab 7 = Marcelo Jacobs-Lorena, Lab 8 = Edward Walker, Lab 9 = Sibao Wang, Lab 10 = Dong Pei), and 3 = the mosquito species the isolate was cultured from. Enterobacter liquefaciens within the Serratia phylogeny are derived from [62] and have since been reclassified as Serratia liquefaciens. All code and data to recreate this figure can be found at https://github.com/MosAIC-Collection/MosAIC_V1. For Fig 4A–4C, the code and data are in the folder “06b_EnterobacterPopulationStructure;” for Fig 4D–4F, they are in the folder “06a_SerratiaPopulationStructure,” and for Fig 4G, 4E, and 4H, they are in the folder “06c_ElizabethkingiaPopulationStructure.” GTDB, Genome Taxonomy Database; MosAIC, Mosquito-Associated Isolate Collection; SNP, single-nucleotide polymorphism.
Fig 5
Fig 5. Pangenomes of Enterobacter asburiae, Serratia marcescens, and Elizabethkingia anophelis with highlighted mosquito-associated lineages.
Panels (A–C) depict gene presence/absence within each species, generated with Panaroo [64]. Phylogenies and matrices are shaded grey to highlight mosquito-associated lineages defined by PopPUNK [66]. The y-axis shows the host each bacterium was isolated from, denoted as 1 Host in the figure legend. The x-axis shows subclassifications of the pangenome, denoted as 2 Gene Classification in the figure legend. Here, subclassification of the accessory genome was performed using the twilight package [67]. In brief, the classification of each gene was first defined by determining their frequency within a lineage (Core, genes present in ≥95% of strains in a lineage; Int, genes present in ≥15% and ≤95% of strains; Rare, genes present in ≤15% of strains). The resulting gene classifications were then compared across each lineage using genome clusters defined with PopPUNK, which correspond to predicted lineages within the phylogeny (Collection core, genes core to the whole phylogeny; Lineage specific core, genes core to a single lineage; Multi-lineage core, genes core to ≥2 lineages). Genes defined by different classifications across lineages are given a combined class denoted by the green shading. Numbers of genes given on the x-axis refer to the total number of genes within each pangenome (core + accessory genes). Mosquito symbols are from https://phylopic.org. All code and data to recreate this figure can be found at https://github.com/MosAIC-Collection/MosAIC_V1. For Fig 5A the code and data are in the folder “07b_EnterobacterPangenome;” for Fig 5B, they are in the folder “07a_SerratiaPangenome,” and for Fig 5C, they are in the folder “07c_ElizabethkingiaPangenome.”

References

    1. Coon KL, Vogel KJ, Brown MR, Strand MR. Mosquitoes rely on their gut microbiota for development. Mol Ecol. 2014. Jun;23(11):2727–2739. doi: 10.1111/mec.12771 - DOI - PMC - PubMed
    1. Sharma A, Dhayal D, Singh OP, Adak T, Bhatnagar RK. Gut microbes influence fitness and malaria transmission potential of Asian malaria vector Anopheles stephensi. Acta Trop. 2013. Oct;128(1):41–47. doi: 10.1016/j.actatropica.2013.06.008 - DOI - PubMed
    1. Hegde S, Rasgon JL, Hughes GL. The microbiome modulates arbovirus transmission in mosquitoes. Curr Opin Virol. 2015. Dec;15:97–102. doi: 10.1016/j.coviro.2015.08.011 - DOI - PMC - PubMed
    1. Wang J, Gao L, Aksoy S. Microbiota in disease-transmitting vectors. Nat Rev Microbiol. 2023. May 22;21(9):604–618. doi: 10.1038/s41579-023-00901-6 - DOI - PubMed
    1. Cansado-Utrilla C, Zhao SY, McCall PJ, Coon KL, Hughes GL. The microbiome and mosquito vectorial capacity: rich potential for discovery and translation. Microbiome. 2021. Dec;9(1):111. doi: 10.1186/s40168-021-01073-2 - DOI - PMC - PubMed

Substances