. 2024 Nov 19;121(47):e2418096121.
doi: 10.1073/pnas.2418096121. Epub 2024 Nov 15.

Loss of XIST lncRNA unlocks stemness and cellular plasticity in ovarian cancer

Affiliations

Loss of XIST lncRNA unlocks stemness and cellular plasticity in ovarian cancer

Ikrame Naciri et al. Proc Natl Acad Sci U S A. .

Abstract

Plasticity, a key hallmark of cancer, enables cells to transition into different states, driving tumor heterogeneity. This cellular plasticity is associated with cancer progression, treatment resistance, and relapse. Cancer stem cells (CSCs) play a central role in this process, yet the molecular factors underlying cancer cell stemness remain poorly understood. In this study, we explored the role of XIST (X-inactive specific transcript) long noncoding RNA in ovarian cancer stemness and plasticity through in silico and in vitro analyses. We found that XIST is significantly down-regulated in ovarian tumors, with low XIST expression linked to a higher stemness index and lower overall survival. Knocking down XIST in ovarian cancer cells enhanced stemness, particularly increasing mesenchymal-like CSCs, and under hypoxic conditions, it promoted epithelial-like CSC markers. Our findings suggest that XIST loss leads to CSC enrichment and cellular plasticity in ovarian cancer, pointing to potential therapeutic targets for patients with low XIST expression.

Keywords: XIST; cancer stem cell; cellular plasticity; epigenetics; ovarian cancer.


Conflict of interest statement

Competing interests statement:The authors declare no competing interest.

Figures

Fig. 1.
Fig. 1.
XIST is down-regulated in ovarian tumors in cancer patients, and XIST-low expression is associated with poor prognosis. (A) XIST expression in 430 ovarian tumors (TCGA cohort) compared to 195 normal ovaries (GTEx database). (B) XIST expression in ovarian tumors sorted by grade compared to normal ovaries (GB: Grade borderline, G2: Grade 2; G3: Grade 3). (C) Stemness index of ovarian tumors with high (Upper quartile) vs. low XIST (Lower quartile) expression. (D) Kaplan–Meier curve showing survival of patients with ovarian tumors of low and high XIST expression. (E) Kaplan–Meier curve showing survival of patients with Grade 3 ovarian tumors of low and high XIST expression. (AC) The statistical analyses were performed with a two-tailed t test (* for P < 0.05, ** for P < 0.01, **** for P < 0.0001, ns: non-significant).
Fig. 2.
Fig. 2.
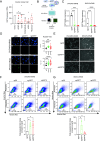
XIST expression in ovarian cancer cell lines and effects of XIST KD. (A) XIST expression in ovarian cancer cell lines from CCLE sorted by ovarian cancer subtypes: HGSC, CCC, Endometrioid, LGSC (Low-Grade Serous Carcinoma), and Mucinous. OVCAR3 and SKOV3 show high expression of XIST compared to other ovarian cancer cell lines (red dots). (B) Scheme of XIST KD in ovarian cancer cell line using CRISPRi technology. (C) XIST expression analysis by RT-qPCR after KD of XIST and clonal selection in OVCAR3-KRAB and SKOV3-KRAB. The statistical analyses were performed with a two-tailed ANOVA test. (D) FISH of XIST lncRNA in OVCAR3-KRAB (Upper) and SKOV3-KRAB (Lower). The histograms on the right represent nucleus area measurement in OVCAR3-KRAB (Upper) and SKOV3-KRAB (Lower) after XIST KD with sgXIST7 and sgXIST9. Two-tailed one-way ANOVA statistical test. (Scale bar, 10 µm.) (E) Brightfield images of OVCAR3-KRAB and SKOV3-KRAB clonal cell lines. (Scale bar, 200 µm.) (F) Side population assay in OVCAR3-KRAB after XIST KD in clonal cells. Upper panels represent results without ABC transporter inhibitor Reserpine, and Bottom panels represent results from cells treated with 15 µM of Reserpine (negative control). Side population was gated by performing the experiment with an ABC transporter inhibitor Reserpine. (G) Side population assay in SKOV3-KRAB after XIST KD in clonal cells. Upper panels represent results without ABC transporter inhibitor Reserpine, and Bottom panels represent results from cells treated with 15 µM of Reserpine (negative control). Side population was gated by performing the experiment with an ABC transporter inhibitor Reserpine. (CG) The statistical analyses were performed with a two-tailed t test. (* for P < 0.05, ** for P < 0.01, **** for P < 0.0001, ns: nonsignificant). All experiments have been performed at least 3 times.
Fig. 3.
Fig. 3.
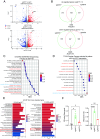
Transcriptome analysis of OVCAR3-KRAB with XIST KD reveals changes in metabolism and cell differentiation. (A) Volcano plot showing differential gene expression in OVCAR3-KRAB with sgXIST7 (Upper) and sgXIST9 (Bottom). Blue dots represent significantly down-regulated genes, red the significantly up-regulated genes (P-value cut off: 0.01, log2 fold change cut off: 1), and larger dots represent X chromosome-linked genes. (B) Venn Diagram of common significantly up-regulated genes (Upper) and down-regulated genes (Bottom) in OVCAR3-KRAB with XIST KD (common genes between sgXIST7 and sgXIST9). (C) Bubble map of pathways enriched in OVCAR3-KRAB in XIST KD after GSEA. Hallmark gene sets from Human MSigDB Collections have been use for the analyses. Only pathways with an FDR < 0.25 has been plotted. (D) Bubble map of pathways enriched in patient samples with low XIST expression after GSEA. Hallmark gene sets from Human MSigDB Collections have been use for the analyses. Only pathways with an FDR < 0.25 has been plotted. (E) Gene Ontology analysis of down-regulated genes in OVCAR3-KRAB with sgXIST7(Left) and sgXIST9 (Right). (F) EB Stemness and Mesoderm index in OVCAR3-KRAB. The statistical analyses were performed with a two-tailed t test (* for P < 0.05, ** for P < 0.01, **** for P < 0.0001). Three biological replicates were performed for the RNA sequencing experiment.
Fig. 4.
Fig. 4.
XIST KD leads to M-CSC enrichment in ovarian cancer cell line. (A) Flow cytometry analysis of surface markers CD44 and CD24 in OVCAR3-KRAB and SKOV3-KRAB after XIST KD in clonal cells. Statistical analysis two-tailed t test. (B) OVCAR3-KRAB clonal cell invasion assay. (C) OVCAR3-KRAB clonal cell migration assay. The statistical analyses were performed with a two-tailed ANOVA test. (D) GSEA plot showing Mesenchymal-like Cancer SC Signature enrichment in OVCAR3-KRAB cell with XIST KD. (E) UMAP of XIST (Left) and CD44 (Right) on ovarian cancer patient single-cell sequencing data. Different cell types as labeled as well as the percentage of cells with gene expression >0. (AC) All the experiments have been performed at least three times. (* for P < 0.05, ** for P < 0.01, **** for P < 0.0001).
Fig. 5.
Fig. 5.
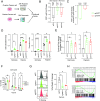
Hypoxia treatment of XIST KD in ovarian cancer cells induces higher stemness and hypoxia-cell death resistance. (A) Scheme of the hypoxia experiment strategy. (B) Log2 Fold Change of XIST in OVCAR3-KRAB sgCtl-Hypoxia vs. sgCtl-Normoxia, sgXIST7-hypoxia vs. sgXIST7-normoxia, and sgXIST9-hypoxia vs. sgXIST-normoxia after 24 h in hypoxia chamber compared to sgCtl, sgXIST7, and sgXIST9 samples in normoxia respectively assessed by RNA-seq. (C) XIST expression in OVCAR3-KRAB with sgXIST7 and sgXIST9 compared to sgCtl after 24 h in hypoxia chamber. (D) EB-Stemness and Mesoderm index in OVCAR3-KRAB in normoxia condition and hypoxia condition. (E) Survival analysis of OVCAR3-KRAB and SKOV3-KRAB cells with sgCtl or sgXIST after hypoxia treatment assessed by crystal violet assay. (F) Flow cytometry analysis of cell-cycle phases (PI staining) of OVCAR3-KRAB cells with XIST KD after hypoxia treatment. (G) Flow cytometry analysis of cell death by PI staining after hypoxia treatment in OVCAR3-KRAB cells. (H) GSEA of apoptosis pathways in OVCAR3-KRAB cells with sgXIST and sgCtl after hypoxia treatment: Upper panel sgXIST7-H (sgXIST7-Hypoxia) vs. sgCtl-H (sgCtl-Hypoxia), Bottom panel sgXIST9-H (sgXIST9-Hypoxia) vs. sgCtl-H (sgCtl-Hypoxia). (DG) The statistical analyses were performed with a two-tailed ANOVA test (* for P < 0.05, ** for P < 0.01, **** for P < 0.0001). All experiments have been performed at least 3 times.
Fig. 6.
Fig. 6.
XIST loss enhances cellular plasticity. (A) Log2 fold change expression of epithelial markers CD24 and ALDH1A3 after 24 h of hypoxia in OVCAR3-KRAB with sgCtl, sgXIST7, and sgXIST9 vs. sgCtl, sgXIST7, and sgXIST9 respectively in normoxia condition. (B) GSEA of OVCAR3-KRAB with sgXIST7-H (sgXIST7-Hypoxia) and sgXIST9-H (sgXIST9-Hypoxia) vs. sgCtl, sgXIST7, and sgXIST9 in normoxia condition. (C) UMAP of XIST (Left) and ALDH1A3 (Right) for CD24+/EPCAM+ tumor cells in ovarian cancer patients. (D) Log2 normalization count of ALDH1A3 expression in clusters with high XIST expression and clusters with low XIST expression. The statistical analyses were performed with a t test (* for P < 0.05, ** for P < 0.01, **** for P < 0.0001).

References

    1. Melo F. D. S. E., Vermeulen L., Fessler E., Medema J. P., Cancer heterogeneity—A multifaceted view. EMBO Rep. 14, 686–695 (2013). - PMC - PubMed
    1. Loh J.-J., Ma S., Hallmarks of cancer stemness. Cell Stem Cell 31, 617–639 (2024). - PubMed
    1. Batlle E., Clevers H., Cancer stem cells revisited. Nat. Med. 23, 1124–1134 (2017). - PubMed
    1. Patel A. S., Yanai I., A developmental constraint model of cancer cell states and tumor heterogeneity. Cell 187, 2907–2918 (2024). - PMC - PubMed
    1. Hanahan D., Hallmarks of cancer: New dimensions. Cancer Discov. 12, 31–46 (2022). - PubMed

MeSH terms