. 2024 Nov 15;10(46):eadp3687.
doi: 10.1126/sciadv.adp3687. Epub 2024 Nov 15.

The HDAC6 inhibitor AVS100 (SS208) induces a pro-inflammatory tumor microenvironment and potentiates immunotherapy

Affiliations

The HDAC6 inhibitor AVS100 (SS208) induces a pro-inflammatory tumor microenvironment and potentiates immunotherapy

Damian Kovalovsky et al. Sci Adv. .

Abstract

Histone deacetylase 6 (HDAC6) inhibition is associated with an increased pro-inflammatory tumor microenvironment and antitumoral immune responses. Here, we show that the HDAC6 inhibitor AVS100 (SS208) had an antitumoral effect in SM1 melanoma and CT26 colon cancer models and increased the efficacy of anti-programmed cell death protein 1 treatment, leading to complete remission in melanoma and increased response in colon cancer. AVS100 treatment increased pro-inflammatory tumor-infiltrating macrophages and CD8 effector T cells with an inflammatory and T cell effector gene signature. Acquired T cell immunity and long-term protection were evidenced as increased immunodominant T cell clones after AVS100 treatment. Last, AVS100 showed no mutagenicity, toxicity, or adverse effects in preclinical good laboratory practice studies, part of the package that has led to US Food and Drug Administration clearance of an investigational new drug application for initiating clinical trials. This would be a first-in-human combination therapy of pembrolizumab with HDAC6 inhibition for locally advanced or metastatic solid tumors.


Figures

Fig. 1.
Fig. 1.. Regulation of macrophage polarization by AVS100.
(A) Western blot analysis of RAW264.7 murine macrophages unpolarized (M0) or after polarization by stimulation with IFN-γ plus LPS (M1) in the absence or presence of AVS100. (B) Western blot analysis of BMA31A7 murine macrophages unpolarized (M0) or after polarization by stimulation with IL-4 plus IL-13 (M2) in the absence or presence of AVS100. (C) Western blot analysis of bone marrow–derived macrophage (BMDM) polarized toward M1 and M2 conditions in the absence or presence of AVS100. (D) Quantitative polymerase chain reaction (qPCR) analysis for the indicated genes in BMDM polarized toward M1 and M2 phenotypes. n = 3; ****P < 0.0001, unpaired t test. ns, not significant. (E) Flow cytometry analysis of F4/80-gated macrophages after polarization of BMDM toward M1 and M2 in the absence or presence of AVS100. Data are representative of two to three independent experiments.
Fig. 2.
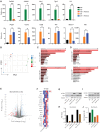
Fig. 2.. Transcriptional regulation by AVS100 in human macrophages.
(A) qPCR analysis of primary human macrophages after stimulation with IFN-γ plus LPS (M1) or IL-4 (M2) in the absence or presence of AVS100 to identify expression of M1 and M2 markers. Data are representative of two experiments. n = 3; *P < 0.05 and **P < 0.01, unpaired t test. (B) Principal components (PC) analysis of human macrophages polarized toward M1 and M2 phenotype in the absence or presence of AVS100. (C) TRRUST pathway analysis showing significantly changed transcription factor (TF) activity after M1 and M2 polarization showing the significance of change. (D) TRRUST pathway analysis by AVS100 treatment in M1 and M2 macrophages showing the significance of change. (E) Volcano plot showing differentially affected genes by AVS100 treatment of M2 cells, highlighting in red genes corresponding to the pathways represented in (D). (F) Heatmap of genes highlighted in (E) and representing the pathways in (D) from three different donors. (G) Western blot analysis after AVS100 treatment of myeloid and lymphoid human cell lines. (H) Quantification of Western blot shown in (G). (I) Western blot analysis of THP1 cells differentiated to macrophages, unpolarized or polarized to M2 in the absence or presence of AVS100. (J) Quantification of Western blot shown in (I). Western blots are representative of two to three independent experiments.
Fig. 3.
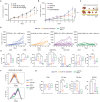
Fig. 3.. Antitumoral effect of AVS100 in melanoma as a standalone treatment and in combination with anti-PD1.
(A) Analysis of tumor volume in the SM1 melanoma model by daily oral gavage of AVS100 at the indicated doses. (B) Analysis of tumor volume in the SM1 melanoma model by anti-PD1 injection administered intraperitoneally three times a week and daily oral gavage of AVS100. Each treatment group corresponds to 10 to 13 mice. N = 10 to 13; ****P < 0.0001 and **P < 0.01, two-way analysis of variance (ANOVA) with Tukey posttest. (C) Images of dissected tumors at the end point. (D) Tumor volume of individual mice per treatment group. The percentage of responder mice (R) having the specified tumor volume at the end point is presented in parentheses. (E) Percentage of intratumoral immune cells as obtained by flow cytometry analysis. Data correspond to six to seven mice per group. Only the significance of AVS100 versus control (CTR), anti-PD1 versus CTR, and anti-PD1 plus AVS100 versus anti-PD1 treatments is represented. *P < 0.05, ***P < 0.001, and ****P < 0.0001 unpaired t test. (F) Flow cytometry analysis of CD80 levels in TAMs. (G) Quantitation of the percentage of M1-like, M2-like, and M1/M2 ratio. Data correspond to six to seven mice per group. N = 6 to 7; *P < 0.05, **P < 0.01, ***P < 0.001, and ****P < 0.0001 unpaired t test.
Fig. 4.
Fig. 4.. Antitumoral effect of AVS100 in colon cancer as a standalone treatment and in combination with anti-PD1.
(A) Analysis of tumor volume in the CT26 colon cancer model by anti-PD1 injection administered intraperitoneally three times a week and daily oral gavage of AVS100. Each treatment group corresponds to 15 mice. ****P < 0.001, two-way ANOVA with Tukey posttest. (B) Tumor volume of individual mice per treatment group. The percentage of responder mice having the specified tumor volume at the end point is presented in parentheses. (C) Quantitation of the percentage of M1-like, M2-like, and M1/M2 ratio. Data correspond to six to seven mice per group. n = 6 to 7; *P < 0.05 and **P < 0.01, unpaired t test.
Fig. 5.
Fig. 5.. scRNA-seq analysis of the tumor microenvironment in melanoma after AVS100 treatment and in combination with anti-PD1.
(A) Cluster analysis of tumor-infiltrating immune cells (CD45+) identifying different immune cell types. Lymphoid corresponds to B, T, and NKT cells. Myeloid corresponds to basophils, monocytes, macrophages, neutrophils, and dendritic cells. (B) Cluster analysis of TAM subclusters present in all treatment groups. (C) Expression of M1 (orange) and M2 (green) genes in each of the TAM subclusters. (D) Functional classification of TAM subclusters based on specific gene expression. (E) Analysis representing TAM subclusters in treatment groups. (F) Proportional changes in TAM subclusters in treatment groups. (G) Heatmap representing single-cell levels of selected genes representing T cell signal and effector function in T cells. (H) Heatmap representing single-cell levels of selected genes regulated by the NF-κB pathway in T cells. (I) Histograms comparing mRNA levels of selected T cell signaling/effector genes in the indicated conditions.
Fig. 6.
Fig. 6.. Analysis of the intratumoral T cell diversity after AVS100 treatment.
(A) Tumor growth in mice that have achieved complete remission and were reimplanted 1 month after termination of treatment. CTR corresponds to naïve mice that have not received tumor before the time of reengraftment. Empty arrows indicate dissection of tissues for T cell receptor sequencing (TCR-seq) analysis. (B) Phenotype of CD8 T cells from tumors and spleens to identify CM (CD62L+CD44+) and effector memory (EM) (CD62LCD44+) phenotypes. (C) Analysis of the clonality index (1-Pielou) based on TCRβ sequencing of CD8 CM + EM subsets. Each dot represents an individual mouse from the indicated groups. (D) Pie chart representing the proportion of the most immunodominant T cell clones in each treatment group. (E) Absolute counts of the 10 immunodominant T cell clones in each treatment group.

References

    1. Bondarev A. D., Attwood M. M., Jonsson J., Chubarev V. N., Tarasov V. V., Schioth H. B., Recent developments of HDAC inhibitors: Emerging indications and novel molecules. Br. J. Clin. Pharmacol. 87, 4577–4597 (2021). - PubMed
    1. Yoon S., Eom G. H., HDAC and HDAC inhibitor: From cancer to cardiovascular diseases. Chonnam. Med. J. 52, 1–11 (2016). - PMC - PubMed
    1. Li M., Zhuang Y., Shan B., Analysis of expression and functions of histone deacetylase 6 (HDAC6). Methods Mol. Biol. 1436, 85–94 (2016). - PubMed
    1. Boyault C., Sadoul K., Pabion M., Khochbin S., HDAC6, at the crossroads between cytoskeleton and cell signaling by acetylation and ubiquitination. Oncogene 26, 5468–5476 (2007). - PubMed
    1. Li Y., Shin D., Kwon S. H., Histone deacetylase 6 plays a role as a distinct regulator of diverse cellular processes. FEBS J. 280, 775–793 (2013). - PubMed

MeSH terms

Substances