. 2024 Nov 15;10(46):eadp1747.
doi: 10.1126/sciadv.adp1747. Epub 2024 Nov 15.

B cell adapter for PI 3-kinase (BCAP) coordinates antigen internalization and trafficking through the B cell receptor

Affiliations

B cell adapter for PI 3-kinase (BCAP) coordinates antigen internalization and trafficking through the B cell receptor

Jonathan Lagos et al. Sci Adv. .

Abstract

B cell adapter for PI 3-kinase (BCAP) is an adaptor molecule associated with signaling through multiple immune receptors, including the B cell receptor (BCR). However, B cell-intrinsic role of BCAP in antibody responses is unclear. We investigated the role of BCAP in B cell response to viral particles and found a previously unidentified mechanism by which BCAP regulates antigen-specific responses. B cell-specific deletion of BCAP in mice leads to decreases in antigen-specific responses through defects in BCR-antigen endocytosis. BCAP is necessary to orchestrate actin reorganization around the antigen for efficient endocytosis through BCR and intracellular processing of antigens. Therefore, loss of BCAP from B cells leads to defects in antigen endocytosis, hampering the propagation of antigen-derived signals and decreasing the ability of B cells to present antigens to T cells. Thus, our study clarifies how BCAP regulates B cell responses to complex antigens and elucidates that antigen positioning inside B cells determines different B cell activation outcomes.


Figures
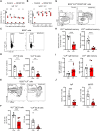
Fig. 1.
Fig. 1.. BCAP KO B cells show decreased antigen-specific B cell response.
(A and B) Serum anti-VLP antibody titers in control and BCAP KO mice immunized with 2 μg of VLPs containing ssRNA measured at 7, 14, 21, 28, and 35 days after immunization. (C) Fluorescence-activated cell sorting (FACS) plots of VLP-immunized control and BCAP KO mice splenocytes stained with fluorescent VLPs, showing VLP+ cells in the B220+ gate. FSC-W, forward scatter width. (D) Proportion and count of spleen VLP+ B cells [gated as in (C)] from control and KO mice immunized with 2 μg of VLPs for 35 days. (E) B220+VLP+ GC B cells were identified as Fas+CD38 cells in control and KO mice. (F) Proportion and count of spleen VLP-specific GC B cells [gated as in (E)] from control and KO mice. (G to I) Splenocytes were gated as B220+VLP+FasCD38+ non-GC B cells, and the frequencies and count of switched memory and IgM memory B cells were determined on the basis of IgM and IgD levels. (J) VLP-specific plasma cells of IgG or IgG2c isotype enumerated by ELISpot assay on bone marrow (BM) cells from control or KO mice harvested at day 35 after immunization. All data are from one of the two independent experiments yielding similar conclusions. Points represent individual mice (n = 7 mice per group) with mean [(A) and (B)] or mean with SEM [(D) to (J)] shown. P values of less than 0.05 are shown: *P < 0.05, **P < 0.01, ***P < 0.001, and ****P < 0.0001, calculated with two-way analysis of variance (ANOVA) with multiple comparisons test [(A) and (B)] or Mann-Whitney U test [(D) to (J)]. A.U., arbitrary units.
Fig. 2.
Fig. 2.. Decreased humoral antigen-specific response in BCAP KO mice is due to B cell–intrinsic defect.
(A and B) Serum anti-VLP antibody titers in control and BCAP cKO mice immunized with 2 μg of VLPs containing ssRNA measured at 7, 14, 21, 28, and 35 days after immunization. (C) FACS plots from splenocytes of VLP-immunized control and cKO mice stained with fluorescent VLPs showing VLP+ cells in B220+ gate. (D) Proportion and count of spleen VLP+ B cells [gated as in (C)] from control and BCAP cKO mice immunized with 2 μg of VLP for 35 days. (E) B220+VLP+ GC B cells were identified as Fas+CD38 cells in control and BCAP cKO mice. (F) Proportion and count of spleen VLP-specific GC B cells [gated as in (E)] from control and BCAP cKO mice. (G to I) Splenocytes were gated as B220+VLP+FasCD38+ non-GC B cells, and the frequencies and count of switched memory and IgM memory B cells were determined on the basis of IgM and IgD levels. (J) Antigen-specific plasma cells enumerated by ELISpot assay on BM cells from control or BCAP cKO mice harvested after immunization. Data from two independent experiments were combined, representative of three different experiments. All data points represent individual mice (n = 9 for control and n = 8 for cKO mice per group) with mean [(A) and (B)] or mean with SEM [(D) to (J)] shown. P values of less than 0.05 are shown: *P < 0.01, **P < 0.001, ***P < 0.001, and ****P < 0.0001, calculated with two-way ANOVA with multiple comparisons test [(A) and (B)] or Mann-Whitney U test [(D) to (J)].
Fig. 3.
Fig. 3.. BCAP KO B cells show defects in proliferation in response to BCR activation.
(A) Experimental workflow of the plasma cell differentiation assay. This workflow includes a three-step differentiation culture that is divided by a B cell activation phase with or without the presence of TLR ligands, a plasmablast differentiation phase (phase I), and a plasma cell differentiation phase (phase II) using the different cocktails of soluble factors and cytokines specified. (B) Bar graph showing the percentage of IRF4+FAS antibody-secreting cells (ASCs) from B220+ gate 8 days after activation. Every point is a biological replicate expressed as means ± SEM (n = 4 in non-TLR conditions and n = 8 in TLR conditions). (C) Bar graph showing the percentage of Fas+IRF4 GC-like B cells from B220+ gate 8 days after activation. Every point is a biological replicate expressed as means ± SEM (n = 4 in non-TLR conditions and n = 8 in TLR conditions). (D) Cell count and viability assay were used on the last day of differentiation culture. Every point is a biological replicate expressed as means ± SEM (n = 4). (E to G) Sorted spleen follicular (B220+CD24+CD23hiCD21+), marginal zone (MZ; B220+CD24+CD23lowCD21hi), and transitional B cells (B220+CD21lowCD24hi) from BCAP-KO and control mice after TLR ligands (CpG-C, 2 μM; and R848, 5 μg/ml) or α-IgM (10 μg/ml) stimulation. Proliferation was measured by [3H]-thymidine incorporation and is expressed as means ± SEM for three independent cultures. P values of less than 0.05 are shown: *P < 0.05, **P < 0.01, ***P < 0.001, and ****P < 0.0001 by two-way ANOVA with multiple comparisons test. (A) created using BioRender.com.
Fig. 4.
Fig. 4.. BCAP KO B cells exhibit increased global BCR signaling but decreased BCR endocytosis.
(A) Immunoblotting of pTyr from control or BCAP KO splenic B cells lysates stimulated with α-IgM or CpG for the indicated time points. Bands within the red box are quantified in fig. S5A. n = 3. (B) Representative confocal planes showing the immune synapse of B cells activated on α-IgM–coated coverslips stained for pTyr (green) and F-actin (cyan). Arrowhead, central pTyr; arrows, peripheral pTyr. (C) Normalized fluorescence intensity distributions of pTyr (green) and F-actin (cyan) sampled across the outlined portion of the images in (B). (D) Graph represents pTyr fluorescence percentage in the peripheral 1/4 of the cell defined by actin. Data of two independent experiments yielding similar findings (221 to 214 cells per condition). (E) Histograms and graph surface α-IgM of splenic B cells from control and KO mice at resting condition. n = 4, means ± SEM. (F) Histograms and line graph of α-IgM remaining on surface (percentage from α-IgM MFI at time 0). n = 3, means ± SEM. (G) Confocal single plane of BCAP KO or control B cell incubated with α-IgM–biotin (green) and stained with Rab5 (red). Scale bar, 5 μm. Graph showing Pearson coefficient between α-IgM and Rab5 analyzed in multiple z-stack using ImageJ. Data are shown as means ± SEM of one of the two independent experiments, yielding similar results (52 to 59 cells per condition). (H) Representative confocal plane of control or KO splenocytes incubated with BSA or α-IgM–coated beads for different time points. Cells were fixed and stained for F-actin (magenta). Arrowheads, base of actin cup. BF, bright field. (I) Quantification of (H). Data from two experiments combined (91 to 55 cells per condition). *P < 0.05, **P < 0.01, and ****P < 0.0001 were calculated using Mann-Whitney U test [(D) and (E)] or two-way ANOVA with multiple comparisons test [(F), (G), and (I)].Schematic in (I) created using BioRender.com.
Fig. 5.
Fig. 5.. BCAP recruits actin-regulatory proteins to the antigen.
(A) Confocal images showing Arp2 and BCAP localization in cells stimulated with an antigen-coated bead (α-IgM) or a negative ligand (BSA). Left images show one plane of control and BCAP KO B cell for BCAP (red) and Arp2 (green) staining at 5 min of stimulation. Center images show Arp2 and BCAP merge staining (red and green) and the bright field with beads conjugated with a negative ligand (BSA) or α-IgM at different time points. The right scheme depicts the area defined as synaptic interface where (B) and (C) were calculated. Arrows highlight the interface of B cells with the bead. (B) Pearson coefficient of the colocalization of BCAP with Arp2/3 at the area of the bead presented as dot graph (left) or line graph (right). Graph of data of two independent experiments combined (83 to 62 cells per condition). (C) MFI of Arp2 at the synaptic interface. Data of two independent experiments combined (137 to 109 cells per condition). P values of less than 0.05 are shown. **P < 0.01, ***P < 0.001, and ****P < 0.0001 by two-way ANOVA with multiple comparisons test. Schematic in (A) created using BioRender.com.
Fig. 6.
Fig. 6.. Defects in antigen-BCR complex trafficking in BCAP KO B cells affect the propagation of BCR signaling.
(A) Representative confocal images of BCAP KO or control splenic B cells resting or activated with α-IgM–biotin (10 μg/ml) for the indicated time points. Cells were fixed and stained with streptavidin-AF488 (green), pERK (red), and the bright field is shown at greyscale. Images are shown as a single plane. Scale bars, 5 μm. (B) Radial quantification of normalized pERK fluorescence from BCAP KO and control B cells relative to inner cell radius and violin plots showing the percentage of total fluorescence in the different thirds (61 to 76 cells per condition). Graphs represent one of the two independent experiments yielding similar results. (C) Confocal images of BCAP KO or control splenic B cells activated with α-IgM–biotin (10 μg/ml) for the indicated time points. Cells were fixed and stained with streptavidin-AF88 (green) and NF-κB (red). One single plane is presented. Scale bars, 5 μm. (D) Image quantification of nuclear NF-κB (defined by a Hoescht mask in the middle of z-stack) normalized by NF-κB in the whole cell. Graphs represent two different experiments yielding similar results (n = 319 to 242 cells per condition). (E and F) Confocal plane images of spleen B cells from control and KO mice fixed and stained for lysosomes (green) and pS6K (magenta) in resting (0 min) or activated condition (60 min). Arrow indicates lysosome and pS6k positioned in the periphery. Dashed lines based on the contour of the cell by bright field. Scale bars, 5 μm. (G) Quantification of pS6K MFI from images in (F) by box plot (top) or radial distribution of fluorescence at 60 min of α-IgM stimulation (bottom). Representative graph from n = 2 experiments yielding similar results (159 to 118 cells per condition). Two-way ANOVA with Šidák’s multiple comparisons test. *P < 0.05, ***P < 0.001, and ****P < 0.0001. No stim, non-stimulated.
Fig. 7.
Fig. 7.. Defects in antigen-BCR complex trafficking in BCAP KO B cells impact antigen presentation.
(A) Expansion microscopy of control and BCAP KO cells after 60 min of IgM stimulation. Cells were fixed and stained with WGA (green), LAMP1 (red), and Hoechst (Blue). Images are shown as a single plane. Scale bars, 5 μm. (B) Manders’ colocalization between WGA and LAMP1 performed in one plane; 12 to 16 cells from two independent experiments combined are presented. (C) Scheme for antigen presentation assay. (D) Representative graph of antigen presentation assay of control or BCAP KO B cells. Levels of proliferation of T cells were quantified following cell trace dilution by flow cytometry. (E) Representative graph of peptide controls for cells used in antigen presentation assays. (F and G) Levels of CD25 and CD44 on the surface of T cells activated by control or BCAP KO B cells. Graph shows means and SEM of three technical replicates and representative of three independent experiments yielding similar results. One-way ANOVA with multiple comparisons (D) or Mann-Whitney U test [(B) and (E) to (G)] were calculated. *P < 0.05. (C) created using BioRender.com.

References

    1. Okada T., Maeda A., Iwamatsu A., Gotoh K., Kurosaki T., BCAP: The tyrosine kinase substrate that connects B cell receptor to phosphoinositide 3-kinase activation. Immunity 13, 817–827 (2000). - PubMed
    1. Yamazaki T., Takeda K., Gotoh K., Takeshima H., Akira S., Kurosaki T., Essential immunoregulatory role for BCAP in B cell development and function. J. Exp. Med. 195, 535–545 (2002). - PMC - PubMed
    1. Yamazaki T., Kurosaki T., Contribution of BCAP to maintenance of mature B cells through c-Rel. Nat. Immunol. 4, 780–786 (2003). - PubMed
    1. Aiba Y., Kameyama M., Yamazaki T., Tedder T. F., Kurosaki T., Regulation of B-cell development by BCAP and CD19 through their binding to phosphoinositide 3-kinase. Blood 111, 1497–1503 (2008). - PubMed
    1. Ni M., MacFarlane A. W., Toft M., Lowell C. A., Campbell K. S., Hamerman J. A., B-cell adaptor for PI3K (BCAP) negatively regulates Toll-like receptor signaling through activation of PI3K. Proc. Natl. Acad. Sci. U.S.A. 109, 267–272 (2012). - PMC - PubMed