

Predicting egg production rate and egg weight of broiler breeders based on machine learning and Shapley additive explanations
- PMID: 39546918
- PMCID: PMC11647772
- DOI: 10.1016/j.psj.2024.104458
Predicting egg production rate and egg weight of broiler breeders based on machine learning and Shapley additive explanations
Abstract
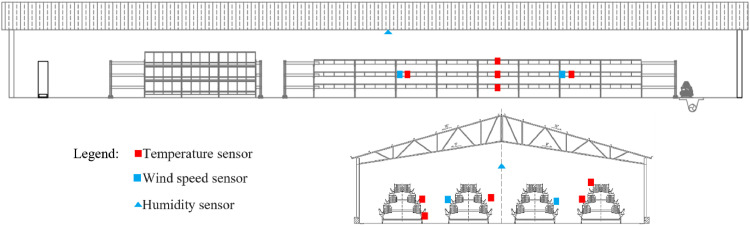
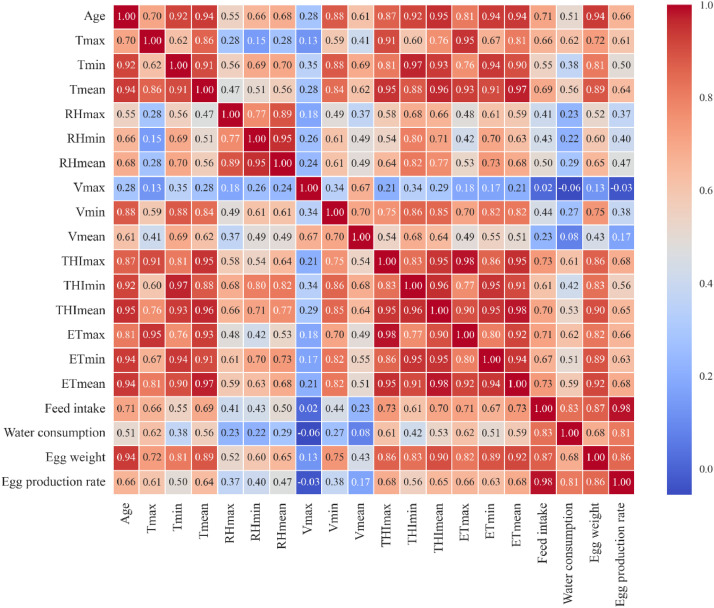
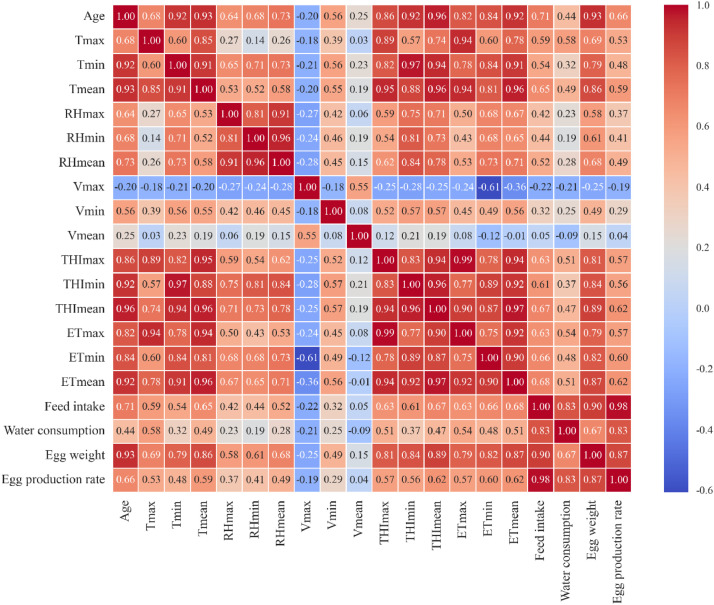
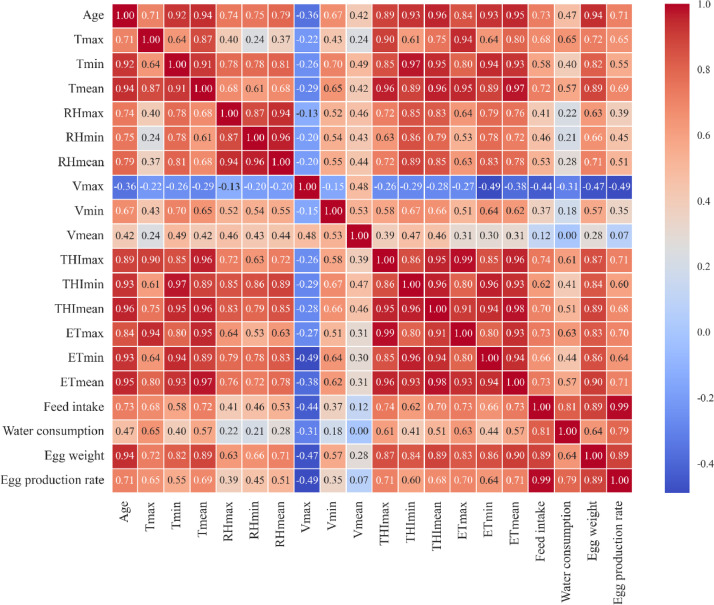
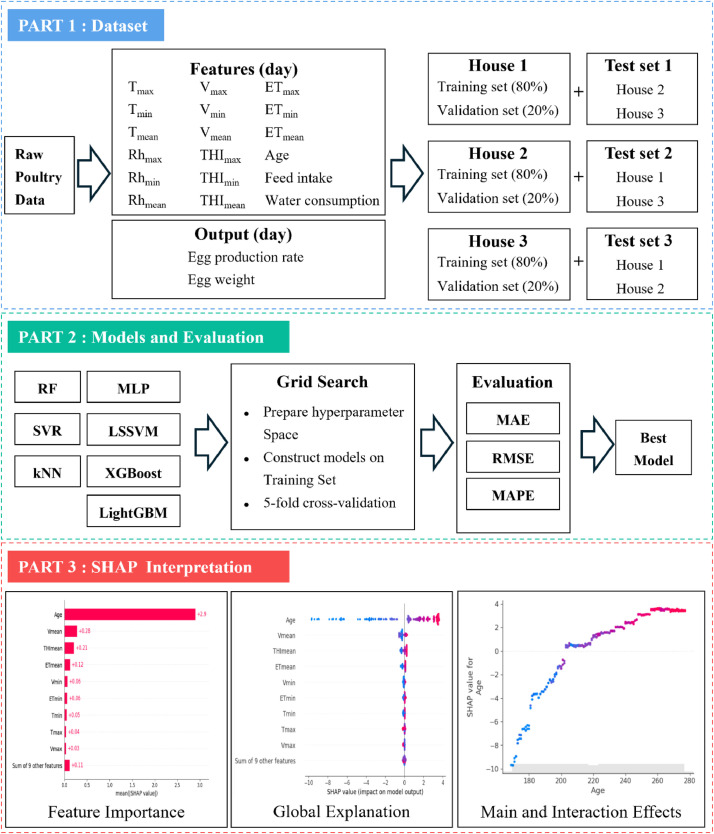
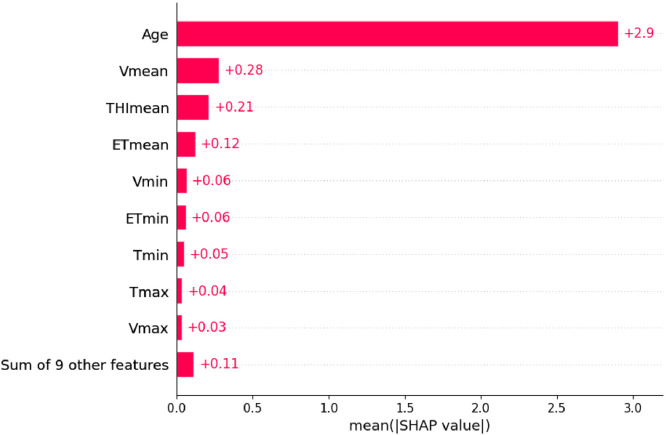
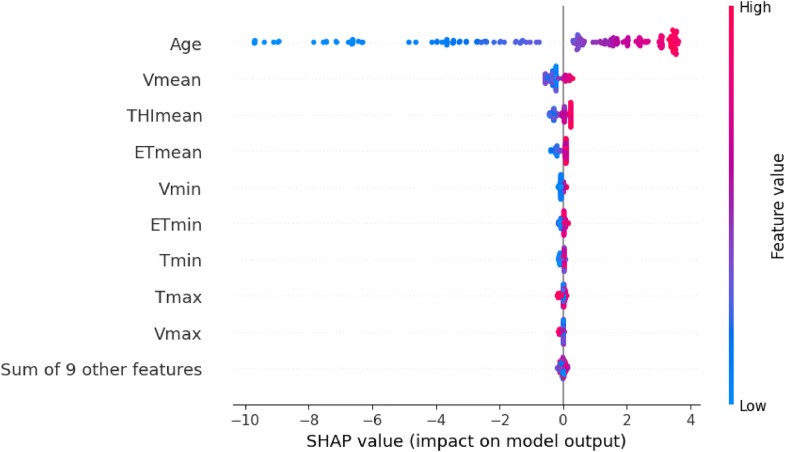
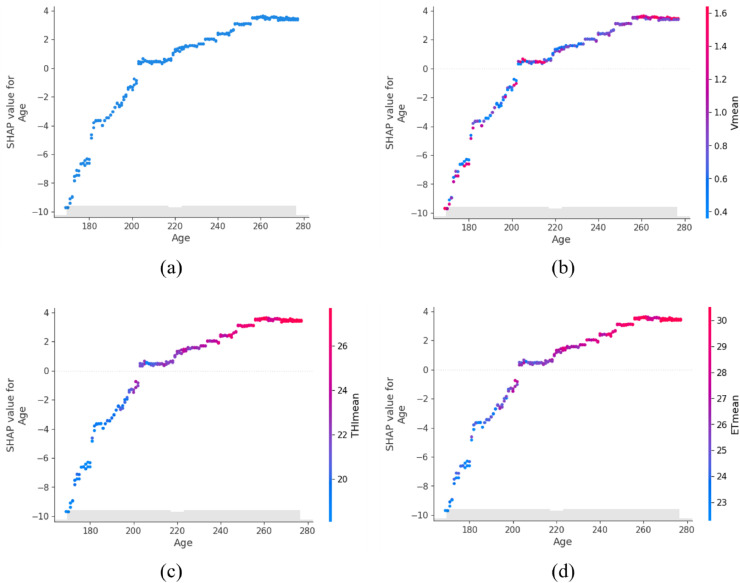
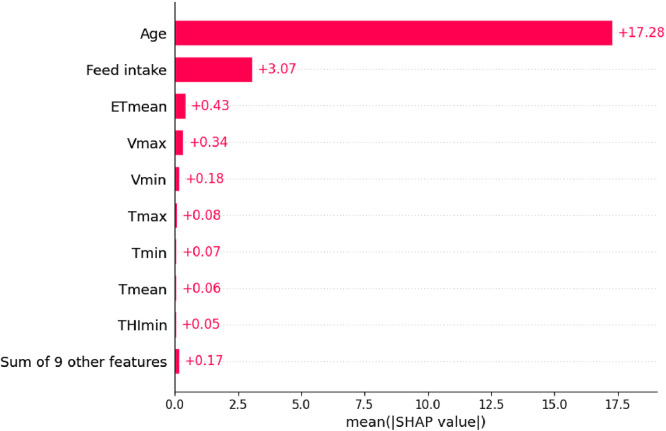
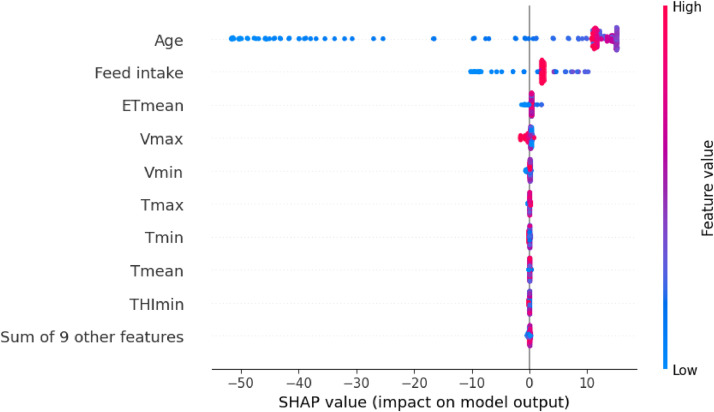
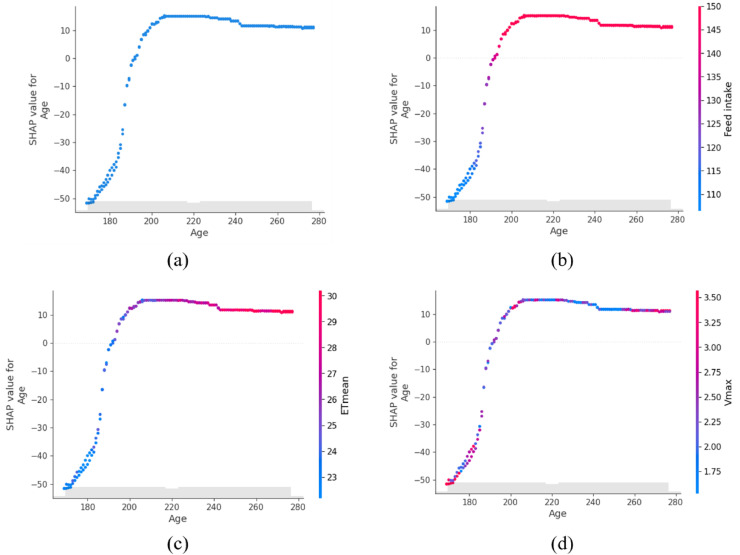
Egg production rate and egg weight are core indicators for evaluating the production performance of broiler breeders. The accurate prediction of these indicators can significantly enhance farm economic efficiency and can provide a basis for future production strategies. Currently, there is a lack of research on the application of machine learning (ML) models to predict egg production rate and egg weight in broiler breeders. In this study, we collected data on age, feed intake, water consumption, and environmental factors (temperature, humidity and wind speed) from three poultry houses to train the predictive models. Based on this data, we developed three different datasets. In each dataset, data from a single poultry house were divided into a training set and a validation set in an 8:2 ratio, and data from the remaining two poultry houses were combined to form the test set. We systematically compared the performances of the following seven ML models in predicting egg production rate and egg weight: random forest (RF), multilayer perceptron (MLP), support vector regression (SVR), least squares support vector machine (LSSVM), k-nearest neighbors (kNN), XGBoost, and LightGBM. The results indicated that the XGBoost model demonstrated the best performance across all three datasets. In predicting egg production rate, the XGBoost model achieved a mean absolute error (MAE), root mean square error (RMSE) and mean absolute percentage error (MAPE) of less than 2.86%, 4.17% and 7.03%, respectively. For egg weight predictions, the XGBoost model's MAE, RMSE and MAPE were less than 0.63g, 0.86g and 1.1%, respectively. Given the inherent black-box nature of ML models, we used the Shapley additive explanations (SHAP) method to interpret the key features influencing the XGBoost model's predictions and the interactions between these features. The key features for predicting egg production rate are age, feed intake and effective temperature (ET). For egg weight prediction, the most important features are age, wind speed, temperature-humidity index (THI) and ET. This approach enhanced the model's transparency and credibility. This study provides scientific evidence for predicting the production performance of broiler breeders. Accurately predicting egg production rate and egg weight provides a scientific basis for farm operations, aiding in optimizing resource allocation, improving production efficiency, enhancing animal welfare, and ultimately boosting the farm's profitability.
Keywords: Broiler breeder; Egg production rate; Egg weight; Machine learning.
Copyright © 2024. Published by Elsevier Inc.
Conflict of interest statement
Declaration of competing interest The authors declare that they have no known competing financial interests or personal relationships that could have appeared to influence the work reported in this paper.
Figures
Similar articles
-
Predicting dry matter intake in cattle at scale using gradient boosting regression techniques and Gaussian process boosting regression with Shapley additive explanation explainable artificial intelligence, MLflow, and its containerization.J Anim Sci. 2025 Jan 4;103:skaf041. doi: 10.1093/jas/skaf041. J Anim Sci. 2025. PMID: 39943876 Free PMC article.
-
Enhancing the Predictive Performance of Molecularly Imprinted Polymer-Based Electrochemical Sensors Using a Stacking Regressor Ensemble of Machine Learning Models.ACS Sens. 2025 Apr 25;10(4):3123-3133. doi: 10.1021/acssensors.5c00364. Epub 2025 Apr 17. ACS Sens. 2025. PMID: 40241481
-
Predicting Readmission Charges Billed by Hospitals: Machine Learning Approach.JMIR Med Inform. 2022 Aug 30;10(8):e37578. doi: 10.2196/37578. JMIR Med Inform. 2022. PMID: 35896038 Free PMC article.
-
An investigation of machine learning methods applied to genomic prediction in yellow-feathered broilers.Poult Sci. 2025 Jan;104(1):104489. doi: 10.1016/j.psj.2024.104489. Epub 2024 Nov 1. Poult Sci. 2025. PMID: 39571199 Free PMC article.
-
Interpretable machine learning model to predict surgical difficulty in laparoscopic resection for rectal cancer.Front Oncol. 2024 Feb 6;14:1337219. doi: 10.3389/fonc.2024.1337219. eCollection 2024. Front Oncol. 2024. PMID: 38380369 Free PMC article. Review.
Cited by
-
Research Progress and Technological Application Prospects of Comprehensive Evaluation Methods for Egg Freshness.Foods. 2025 Apr 25;14(9):1507. doi: 10.3390/foods14091507. Foods. 2025. PMID: 40361590 Free PMC article. Review.
-
Genome-Wide Association Studies and Candidate Genes for Egg Production Traits in Layers from an F2 Crossbred Population Produced Using Two Divergently Selected Chicken Breeds, Russian White and Cornish White.Genes (Basel). 2025 May 15;16(5):583. doi: 10.3390/genes16050583. Genes (Basel). 2025. PMID: 40428405 Free PMC article.
References
-
- Adebayo M.O., Abiona J.A., Uyanga V.A., Onagbesan O.M., Oke O.E. Growth and reproductive performance of broiler breeders reared to puberty under the open-sided housing in a tropical environment. Anim. Prod. Sci. 2024;64(AN231831)
-
- Akilli A., Gorgulu O. Comparative assessments of multivariate nonlinear fuzzy regression techniques for egg production curve. Trop. Anim. Health Prod. 2020;52:2119–2127. - PubMed
-
- Bjerg B., Zhang G., Pedersen P., Morsing S., 2018. Effective temperature for poultry and pigs in hot climate. Pages 23-41 in Animal husbandry and nutrition. ed. Y. Banu, T. Turgay. London, United Kingdom.
-
- Chen T., Guestrin C. Proceedings of the 22ND ACM Sigkdd International Conference on Knowledge Discovery and Data Mining; San Francisco, CA; 2016. pp. 785–794. XGBoost: A Scalable Tree Boosting System. KDD'16:
-
- Costantino A., Fabrizio E., Ghiggini A., Bariani M. Climate control in broiler houses: A thermal model for the calculation of the energy use and indoor environmental conditions. Energy Build. 2018;169:110–126.
MeSH terms
LinkOut - more resources
Full Text Sources
