. 2024 Dec 12;187(25):7107-7125.e25.
doi: 10.1016/j.cell.2024.10.018. Epub 2024 Nov 14.

STK19 facilitates the clearance of lesion-stalled RNAPII during transcription-coupled DNA repair

Affiliations

STK19 facilitates the clearance of lesion-stalled RNAPII during transcription-coupled DNA repair

Diana van den Heuvel et al. Cell. .

Abstract

Transcription-coupled DNA repair (TCR) removes bulky DNA lesions impeding RNA polymerase II (RNAPII) transcription. Recent studies have outlined the stepwise assembly of TCR factors CSB, CSA, UVSSA, and transcription factor IIH (TFIIH) around lesion-stalled RNAPII. However, the mechanism and factors required for the transition to downstream repair steps, including RNAPII removal to provide repair proteins access to the DNA lesion, remain unclear. Here, we identify STK19 as a TCR factor facilitating this transition. Loss of STK19 does not impact initial TCR complex assembly or RNAPII ubiquitylation but delays lesion-stalled RNAPII clearance, thereby interfering with the downstream repair reaction. Cryoelectron microscopy (cryo-EM) and mutational analysis reveal that STK19 associates with the TCR complex, positioning itself between RNAPII, UVSSA, and CSA. The structural insights and molecular modeling suggest that STK19 positions the ATPase subunits of TFIIH onto DNA in front of RNAPII. Together, these findings provide new insights into the factors and mechanisms required for TCR.

Keywords: CSA; CSB; DNA repair; ELOF1; RNA polymerase II; STK19; TFIIH; UVSSA; nucleotide excision repair; transcription.


Conflict of interest statement

Declaration of interests The authors declare no competing interests.

Figures
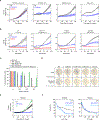
Figure 1 |
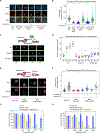
Figure 1 |. STK19-deficient cells are sensitive to transcription-blocking DNA damage.
A. Quantification of cell growth using Incucyte, with or without 15 J/m2 UV in the wild type and knockout cell-lines indicated. Confluency was monitored every 3 h and the data were normalized to t = 0 for each well. Data represent average relative confluency of 2 biological replicates ± SD. 3 experimental repeats. B. As in A, but also after 1 hour treatment with the indicated compounds. C. Quantification of clonogenic survival after Illudin S treatment in RPE1 cells with the indicated genotype. Bars represent the means of 3 experiments with individual data points shown as circles. D. Representative examples of clonogenic growth in the presence of Illudin S as in C. E. As in A but also showing STK19 over-expressing cells (OE). n=3 with different UV doses. F. Quantification using luminescence CellTiter-Glo assays of cell survival after UV (left) or after treatment with camptothecin (CPT, right). Lines represent the mean of 3 experiments with individual data points shown as circles. Statistical significance in C and F determined by paired 2-tailed t-test (*p<0.05). See also Figures S1, S2 and S3.
Figure 2 |
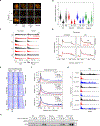
Figure 2 |. STK19 promotes transcription recovery after DNA damage.
A. Images of RPE1 cells 1 h after EU-labelling in untreated (−) condition, or 3 and 16 h after 12 J/m2 UV. Scale bar, 10 μm. B. Quantification of A. Cells depicted as individual data points, with the bar representing the mean. Open symbols, individual means of five biological replicates. Statistical significance determined by paired 2-tailed t-test (*p<0.05). C. TTchem-seq browser tracks before and after 15 J/m2 UV. D. Metagene TTchem-seq profiles of genes 50–150 kb and ≧150 kb, in untreated cells and 20h after 15 J/m2 UV. TSS, transcription start site. TTS, transcription termination sites. E. BrU-seq heatmaps before and after 12 J/m2 UV irradiation of RPE1 cells, from the TSS into the first 100 kb of 3000 genes with strongest BrU signal in untreated cells. F. Average read count profiles from −5 kb to +50 kb around the TSS of 787 genes above 50 kb in RPE1 cells before, or 3 and 16 h after 12 J/m2 UV. G. BrU-seq density across the DAB2 gene in RPE1 cells before, or 3 and 16 h after 12 J/m2 UV. H. ATF3 Western blot in RPE1 cells with the indicated genotype before or 7, 24 and 32 h after 12 J/m2 UV. HSPA4 is a loading control. See also Figure S4.
Figure 3 |
Figure 3 |. STK19 promotes downstream DNA repair steps.
A. Representative images TCR-specific UDS after 100 J/m2 UV through 5 μm pore membranes in RPE1 cells with the indicated genotypes. Local damage identified by CPD staining. Scale bar, 10 μm. B. Quantification of A. All cells are depicted as individual semi-transparent data points with the bar representing the mean. The individual means of three to five biological replicates are depicted as solid circles with black lines. C. Representative images of 30 μm COMET chip from G1-arrested RPE1 cells with the indicated genotype that were untreated (NT) or treated for 2 h with 50 nM trabectedin and subsequently released for 0, 2, or 4 h. D. Quantification of C. The means of all technical replicates are depicted as individual semi-transparent data points with the bar representing the mean. The individual means of four biological replicates (with four technical replicates per experiment) are depicted as solid circles with black lines. E. Representative images of TCR-dependent γH2AX induction following trabectedin exposure in replicating cells labelled with 5-ethynyl-deoxyuridine (EdU) in RPE1 cells with the indicated genotype. Scale bar, 10 μm. F. Quantification of E, presented as in B. The γH2AX levels were normalized to the average of the trabectedin-treated parental cells within each experiment. G, H. Quantification of clonogenic survival after Trabectedin treatment in (G) RPE1 cells or (H) XPC-KO RPE1 cells with the indicated genotype. Bars represent the means of 3 experiments with individual data points shown as colored circles. Statistical significance of differences in B, D, F, G and H was determined by paired 2-tailed t-test (* = p<0.05). Statistics was performed per timepoint (D), focused on trabectedin-treated conditions (F), or per dose of trabectedin (G, H).
Figure 4 |
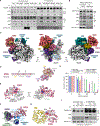
Figure 4 |. Structure of the RNAPII-TCR-STK19 complex.
A. IP of RNAPII Ser2p in RPE1 cells with the indicated genotype before or after UV (12 J/m2, 1 h recovery). n≥3. B. Co-IP experiment as shown in A. C. Molecular model of the RNAPII-TCR-STK19 complex. D. Schematics of the STK19 domain composition. E. Zoom-in on the STK19-RNAPII interface. STK19 residues at the interface are shown as spheres. F. Zoom-in on the STK19-UVSSA interface. UVSSA in the RNAPII-TCR complex without STK19 is shown in green was modelled based on our previous structure by aligning structures on CSA. Positively charged STK19 residues in the vicinity of downstream DNA are shown as blue spheres. G. Zoom-in on the STK19-CSA interface. STK19 residues at the interface are shown as spheres. H. Quantification of clonogenic survival after Illudin S treatment in RPE1 cells with the indicated genotype. The following amino acid substitutions were introduced in STK19: ΔRNAPII (D154A-T158A-V161A-N162A-V168A-W174A-W175A), ΔUVSSA (K203A-Y204A), and ΔCSA (R72A-T73A-D76A-D98A). Bars represent the means of 3 experiments with individual datapoints shown as colored circles. Statistical significance at each dose of Illudin S was determined by paired 2-tailed t-test (*p<0.05, indicated below the graph). I. IP in RPE1 cells as in B to detect STK19-TY1 association with TCR factors in parental and two CSA-KO clones. See also Figures S4, S5 and S6.
Figure 5 |
Figure 5 |. Evidence that STK19 positions TFIIH in the RNAPII-TCR complex.
A. AlphaFold model of STK19 and XPD interaction. B. Interaction interface between STK19 and UVSSA. C. The XPD-STK19 model with XPB-XPD bound to DNA from was superimposed on RNAPII-bound STK19. D. As in C now also showing the RNAPII-TCR and TFIIH core complexes. E. Schematic of XPD helicase assay. F. Real-time fluorescence measurement of the XPD 5′–3′ helicase activity using a fluorescence energy transfer-based assay when TFIIH (0.4 μM), STK19 (2.4 μM), or TFIIH (0.4 μM) + STK19 (2.4 μM), or TFIIH (0.4 μM) + XPA (1.2 μM) were added to the DNA substrate. G. RNAPII Ser2p IP in RPE1 cells with the indicated genotype before or 1 h, 3 h, 8 h, or 16 h after 12 J/m2 UV. n≥3. H. Representative images of EdU incorporation in RPE1 cells with the indicated genotype to specifically measure TCR-UDS, as in Figure 3A. STK19 amino acid substitutions: ΔXPD (E211A-T244A-S245A). Scale bar, 10 μm. I. Quantification of TCR-UDS signal from H, presented as in Figure 3B. Statistical significance determined by paired 2-tailed t-test (* = p<0.05) between WT and KO, or WT rescue and ΔXPD.
Figure 6 |
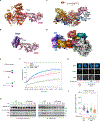
Figure 6 |. STK19 accelerates RNAPII clearance from sites of DNA damage.
A. Schematic representation of TCR-seq (from). B. Averaged metaplots of Ser2p-RNAPII TCR-seq in RPE1 cells with the indicated genotype before or 1 or 8 h after 12 J/m2 UV. Red, coding (non-transcribed) strand. Blue, template (transcribed) strand. C. Outline of DRB run-off imaging assay. D. Representative images of RNAPII Ser2p signal in RPE1 cells with the indicated genotype at 5 min, 30 min, and 60 min after local UV damage (100 J/m2) marked by CPD. Cells were treated with DRB immediately after UV irradiation to prevent new RNAPII molecules from moving into gene bodies. Scale bar, 10 μm. E. Quantification of D. Ratios below 1 signify that loss of RNAPII Ser2p in the local damage is faster than the general run-off outside. Cells are depicted as individual semi-transparent data points with the bar representing the mean. The individual means of three biological replicates are depicted as solid circles with black lines. Statistical significance at each timepoint was determined by paired 2-tailed t-test (* = p<0.05). F. Outline of a DRB-run off assay. G. Western blot analysis on HEK293 cells using the experimental approach in F. Samples collected at the indicated time points after DRB addition immediately after UV irradiation. Total RPB1 (IIo – phosphorylated and IIa- non phosphorylated), Ser2p and Ser5p RPB1, and histone H3 (control) in chromatin are shown. H. As in G, but without UV irradiation. See also Figure S7.
Figure 7 |
Figure 7 |. Ubiquitylated RNAPII persists on chromatin when STK19 is absent.
A. Dsk2 pulldown-western blot analysis of HEK293 cells with the indicated genotype before or 45 min, 3 h, or 24 h after 15 J/m2 UV. B. IP of RNAPII Ser2p in RPE1 cells with the indicated genotype before or 3 h, 8 h, or 16 h after 12 J/m2 UV. n≥3. C. Western blot of a time course after UV irradiation showing the amount of unphosphorylated (IIa) and phosphorylated (IIo) RPB1 in chromatin in HEK293 cells of the indicated genotype. H3 is loading control. D. Molecular model for how STK19 accelerates effective clearance of arrested RNAPII to facilitate transcription-coupled DNA repair. (1) TCR complex assembly with TFIIH recruitment by UVSSA through an interaction with p62. (2) STK19 wedges between CSA, UVSSA, and RNAPII, and positions TFIIH through an interaction with XPD. (3) UVSSA is displaced and XPD unwinds towards RNAPII. (4) RNAPII is displaced, providing downstream NER factors access to the lesion.

Update of

References

    1. Mellon I, Spivak G, and Hanawalt PC (1987). Selective removal of transcription-blocking DNA damage from the transcribed strand of the mammalian DHFR gene. Cell 51, 241–249. - PubMed
    1. Bohr VA, Smith CA, Okumoto DS, and Hanawalt PC (1985). DNA repair in an active gene: Removal of pyrimidine dimers from the DHFR gene of CHO cells is much more efficient than in the genome overall. Cell 40, 359–369. - PubMed
    1. Xu J, Lahiri I, Wang W, Wier A, Cianfrocco MA, Chong J, Hare AA, Dervan PB, DiMaio F, Leschziner AE, and Wang D (2017). Structural basis for the initiation of eukaryotic transcription-coupled DNA repair. Nature 551, 653–657. 10.1038/nature24658. - DOI - PMC - PubMed
    1. Jia N, Guo C, Nakazawa Y, van den Heuvel D, Luijsterburg MS, and Ogi T (2021). Dealing with transcription-blocking DNA damage: Repair mechanisms, RNA polymerase II processing and human disorders. DNA Repair (Amst) 106, 103192. 10.1016/j.dnarep.2021.103192. - DOI - PubMed
    1. van den Heuvel D, van der Weegen Y, Boer DEC, Ogi T, and Luijsterburg MS (2021). Transcription-Coupled DNA Repair: From Mechanism to Human Disorder. Trends in cell biology 31, 359–371. 10.1016/j.tcb.2021.02.007. - DOI - PubMed

MeSH terms