. 2024 Nov 26;43(11):114954.
doi: 10.1016/j.celrep.2024.114954. Epub 2024 Nov 14.

Netrin1 patterns the dorsal spinal cord through modulation of Bmp signaling

Affiliations

Netrin1 patterns the dorsal spinal cord through modulation of Bmp signaling

Sandy Alvarez et al. Cell Rep. .

Abstract

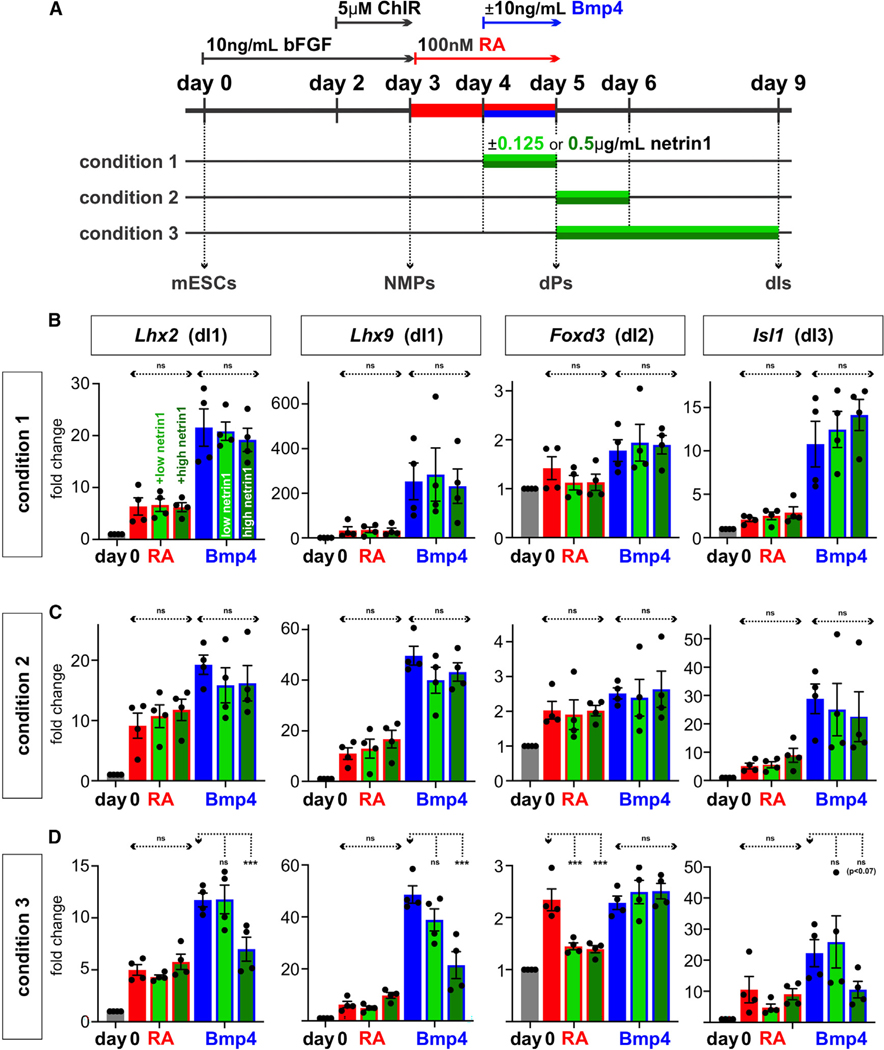
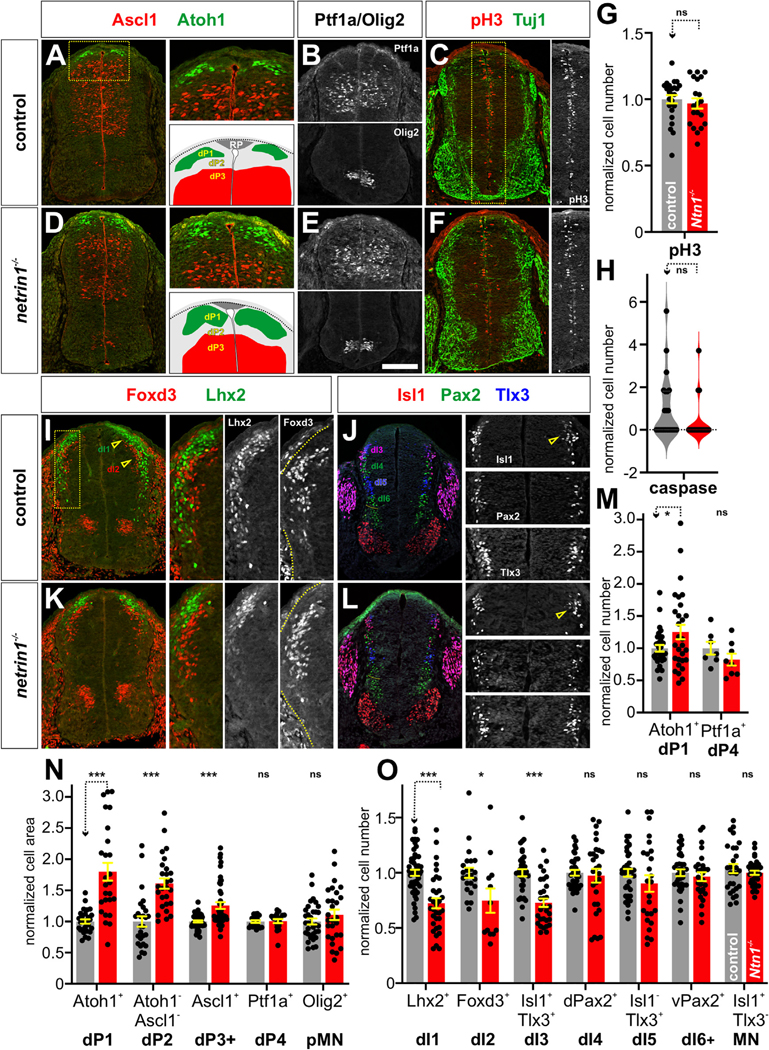
We have identified an unexpected role for netrin1, a canonical axonal guidance cue, as a suppressor of bone morphogenetic protein (Bmp) signaling in the developing dorsal spinal cord. Using a combination of gain- and loss-of-function approaches in chicken and mouse embryonic models, as well as mouse embryonic stem cells (mESCs), we have observed that manipulating the level of netrin1 specifically alters the patterning of the Bmp-dependent dorsal interneurons (dIs), dI1-dI3. Altered netrin1 levels also change Bmp signaling activity, as assessed using bioinformatic approaches, as well as monitoring phosophoSmad1/5/8 activation, the canonical intermediate of Bmp signaling, and Id levels, a known Bmp target. Together, these studies support the hypothesis that netrin1 acts from the intermediate spinal cord to regionally confine Bmp signaling to the dorsal spinal cord. Thus, netrin1 has reiterative activities shaping dorsal spinal circuits, first by regulating cell fate decisions and then acting as a guidance cue to direct axon extension.

Keywords: Bmp; Bmp inhibition; CP: Developmental biology; CP: Neuroscience; cell fate; dorsal interneurons; interneuron differentiation; netrin1; neural development; patterning; spinal cord.


Conflict of interest statement

Declaration of interests The authors declare no competing interests.

Figures

Figure 1.
Figure 1.. Overexpression of netrin1 does not affect the integrity of the developing spinal cord
(A–L) Distribution of netrin1 (A–C and G–I) and netrin2 in (D–F and J–L) in thoracic sections of the HH18 (A–F) and HH24 (G–L) spinal cord. Netrin1 mRNA is expressed in the apical FP (A and G), while netrin1 protein (red, B and H) decorates the apical-most and basal FP (arrowhead, C and I), where it is coincident with NF+ axons crossing the FP (H). Netrin2 mRNA is expressed in the intermediate VZ (D and J), while netrin2 protein (red, E and K) decorates pial surface in the intermediate spinal cord (arrowheads, F and L), immediately adjacent to NF+ axons (green) extending ventrally in the dorsal spinal cord (L). (M–R) Electroporation of a control fluorophore, GFP (green, M and P), expressed from a ubiquitously expressed CAG enhancer, does not affect the distribution of endogenous netrin1 (red, M; arrowhead, O), or the integrity of the spinal cord as assessed by antibodies against laminin (red, P and Q) and nestin (blue, P and R). (S–DD) In contrast, electroporation of a low (50 ng, S–X) or high (1 μg, Y–DD) concentration of netrin1-myc construct, results in ectopic netrin1 (red, S, Y, U, and AA) and myc (blue, S, Y, T, and Z) decorating the pial surface (arrowheads, T, U, Z, and AA) with no effect on the distribution of laminin (red, V, W, BB, and CC) or nestin (blue, V, X, BB, and DD). Scale bar: 100 μm.
Figure 2.
Figure 2.. Overexpression of ntrin1 in chicken embryos results in the loss of dorsal interneurons
(A–L) Chicken spinal cords were electroporated at HH stage 14 with Gfp (A–C and G–I) or different concentrations of netrin1 (50 ng, 500 ng, 1 μg) (D–F and J–L) under the control of the CAG enhancer and incubated until HH stage 24. Thoracic transverse sections were labeled with antibodies against Sox2 (red, A, B, D, and E), p27 (blue, A, C, D, and F), Lhx2 (red, G and J), Isl (red, H and K), Lhx1/5 (blue/green G, I, J, and L) and Pax2 (red, I and L). The dotted box (G–L) indicates the magnified region in the adjacent panel(s). (M) Schematic spinal cord, showing the position of the dorsal progenitor (dP) domains and post-mitotic dorsal interneurons (dIs). (N and O) Ectopic Gfp expression had no significant effect on cell fate specification. In contrast the total area occupied by Sox2+ (progenitors) or p27+ (neurons) cells was significantly reduced at all concentrations of netrin1 tested (N). The dorsal spinal cord was more profoundly affected at lower concentrations of netrin1 than the ventral spinal cord (O). n > 20 sections from four embryos from each experimental condition (i.e., GFP, 50 ng, 500 ng, and 1 μg netrin), Student’s t test. (P) The different classes of dIs can be identified by specific combinations of transcription factors. (Q) There was no significant difference (p > 0.58) in the number of caspase+ cells between spinal cords electroporated with GFP and 50 ng of netrin1. In contrast, there was significant cell death when the higher concentrations of netrin1 were electroporated. n > 20 sections from four embryos from each condition (GFP, 50 ng, 500 ng, and 1 μg netrin). Student’s t test. (R) Ectopic Gfp expression had no significant effect on dI specification. However, all concentrations of netrin1 tested significantly reduced the number of Lhx2+ dI1s, Lhx1/5+ Pax2 dI2s, and Isl1+ dI3s in a dose-dependent manner. In contrast, only the higher concentrations of netrin1 reduced the number of Lhx1/5+ Pax2+ dI4s. n > 20 sections from six embryos from each condition (GFP, 50 ng, 500 ng, and 1 μg netrin), one way ANOVA. Probability of similarity between control and experimental groups: *p < 0.05, **p < 0.005 ***p < 0.0005. Scale bar: 100 μm.
Figure 3.
Figure 3.. Addition of netrin1 blocks dorsalization in mESC stem cell model of dI differentiation
(A) Two concentrations of Netrin1 recombinant protein (0.125 μg/mL [low] and 0.5 μg/mL [high]) were added to the RA ± Bmp4 protocol at the same time as Bmp4 from day 4–5 (condition 1), immediately after Bmp4 treatment from day 5–6 (condition 2), and for an extended period after Bmp4 treatment from day 5–9 (condition 3). qPCR was used to assess alterations in gene expression. (B and C) The addition of either high (dark green) or low (light green) netrin1 in condition 1 and 2 had no significant effect on the expression of Lhx2 and Lhx9 (dI1), Foxd3 (dI2), or Isl1 (dI3) compared to RA (red) or RA + Bmp4 (blue) controls. (D) Prolonged treatment with 0.5 μg/mL netrin1 in the RA + Bmp4 protocol significantly reduced the expression of both dI1 markers, and there is a trend (p < 0.07) toward the loss of dI3 marker Isl1. Probability of similarity between control and experimental groups: *p < 0.05.
Figure 4.
Figure 4.. Netrin1 is required to limit the number of the dorsal-most NPCs
(A–F) Thoracic transverse spinal cord sections from either control (A–C) or netrin1/ (D–F). E11.5 mouse spinal cords were labeled with antibodies against Ascl1 (A and D; red, dP3–dP5), Atohl1 (A and D; green, dP1), Ptf1a (top panel, B and E; dP4), Olig2 (bottom panel, B and E; pMN), phospho-histone H3 (C and F; red; cells in mitosis [M] phase), and Tuj1 (C and F; green; neurites). The dotted box in (A) and (C) indicates position of the magnified region in the adjacent panel(s). (G and H) There was no significant difference in the number of cells in M phase (G, p > 0.50; n= >20 sections from three control and three netrin1/ embryos) or that were caspase+ (i.e., dying) (H, p > 0.28; n= >13 sections from three control and three netrin1/ embryos) between control and netrin1/ spinal cords. (I–L) To assess for changes in post-mitotic dIs, thoracic transverse spinal cord sections from either control (I and J) or netrin1/ (K and L) E11.5 mouse spinal cords were labeled with antibodies against Lhx2 (I and K; green; dI1), Foxd3 (I and K; red; dI2), Isl (J and L; red, dI3, MNs), Pax2 (J and L; green; dI4, dI6, v0), and Tlx3 (J and L; blue; dI3, dI5). The dotted box (I–L) indicates the magnified region in the adjacent panel(s). (M and N) Loss of netrin1 resulted in a 25% increase in the number of Atoh1+ dP1s and an almost 2-fold increase in the area occupied by the dP1s. Similarly, the area of the dP2 domain (region bounded by the Atoh1+ and Ascl1+ domains) was increased by 60%, and the Ascl1+ dP3-dP5 domain was increased by 25%. In contrast, there was no change in the area of the Ptf1a+ dP4 domain (n > 26 sections from four embryos). (O) This increased number of progenitors did not result in a loss of dIs. Rather there was a ~30% decrease specifically in the number of dI1, dI2, and dI3s (n > 25 sections from five embryos) but not in the intermediate dorsal populations or the ventral motor neurons (MNs). Probability of similarity between control and experimental groups: *p < 0.05, **p < 0.005, ***p < 0.0005; Student’s t test. Scale bar: 100 μm.
Figure 5.
Figure 5.. Netrin1 downregulates Bmp signaling and alters mRNA processing
(A) Netrin1 was added to the RA ± Bmp4 directed differentiation protocol at three different time points. RNA samples for bulk RNA-seq were collected on day 5 (condition 1), day 6 (condition 2), and day 9 (condition 3). (B and C) The pulse of netrin1 in condition 1 resulted in essentially no differentially expressed genes at a false discovery rate (FDR) of p < 0.05. In contrast, there was a modest increase in transcriptional changes in condition 2, while ~10,000 genes were differentially expressed in condition 3 after extended treatment with netrin1. In each case, the control condition for the differential analysis is the RA + Bmp4 condition at the same time point. (D) GO analyses of the differentially expressed genes after netrin1 treatment showed that Bmp signaling was downregulated at day 6 and mRNA processing was upregulated at day 9. (E) A gene target analysis of published gene sets also identifies that Bmp2 target genes (highlighted) are downregulated after netrin1 addition by day 6. (F) Several transcription factor regulatory networks (for complete set of networks, see Table S1) were identified as being downregulated in netrin1-treated cultures in condition 3. Many Bmp target genes were found to be downregulated by Egr1 (highlighted), including Id3. The heatmap shows the Fragments per kilobase of transcript per million mapped reads (FPKM) values of select genes. (G) Heatmap showing the upregulated expression (FPKM values) of mRNA processing genes in netrin1-treated cultures at day 9 (condition 3), validating the GO analysis in (D).
Figure 6.
Figure 6.. Netrin1 modulates the level of Bmp signaling both in vivo and in vitro
(A) Thoracic sections of E11.5 mouse spinal cord labeled with antibodies against pSmad1/5/8 (red) and netrin1 (green). pSmad1/5/8 and netrin1 proteins are detected in neighboring domains. pSmad1/5/8 is present in the VZ immediately flanking the RP (open arrowheads) and along the pial surface of the dorsal-most spinal cord (closed arrowheads). Netrin1 is present in the intermediate spinal cord, at low levels in the VZ (open arrowheads) where netrin1 is expressed, and high levels on the pial surface (closed arrowheads) after trafficking along the radial processes. (B–E and I) Chicken spinal cords were electroporated at HH stage 14 with Gfp (B) or different concentrations of netrin1 (50 ng, 500 ng, and 1 μg) (C–E) under the control of the CAG enhancer and incubated until HH stage 24/25. Thoracic transverse sections were labeled with antibodies against pSmad1/5/8 (red). Ectopic netrin1 in the dorsal-most spinal cord resulted a ~30%–50% decrease in the levels of Smad1/5/8 compared to a control GFP electroporation. (F, G, and J) Thoracic transverse spinal cord sections from either control (F) or netrin1/ (G) E11.5 mouse spinal cords were labeled with antibodies against pSmad1/5/8. The loss of netrin1 resulted in a ~40% larger Smad+ area (J), suggesting Bmp signaling had been increased. (H and K) The interaction between netrin1 and Bmp4 was further assessed in a western analysis, using GAPDH levels as a loading control. Treating Cos7 cells with Bmp4 resulted in the robust activation of pSmad1/5/8, while treatment with netrin1 alone had no effect on Smad activation above control levels. However, if netrin1 is added together with Bmp4, there is a decrease in Smad activation in a dose-dependent manner. The highest level of netrin1 (0.5 ng/mL) resulted in a ~60% decrease in the level of pSmad1/5/8, suggesting that Bmp signaling had been suppressed. (L) Model for the biological significance of the netrin1/Bmp interaction. Multiple Bmps are secreted from the RP where they pattern the surrounding tissue into the dorsal progenitor domains (dP1–dP3). Netrin1 acts as a boundary, coincident with the dorsal root entry zone (DREZ), to limit Bmp signaling spreading into the intermediate spinal cord. Supporting this model, the dorsal-most dIs (dI1–dI3) are preferentially lost when netrin1 is expressed dorsally. In contrast, dP1–dP3 domains expand in the absence of netrin1. Probability of similarity between control and experimental groups: *p < 0.05, **p < 0.005, ***p < 0.0005; Student’s t test. Scale bar (A–D), 50 μm.
Figure 7.
Figure 7.. Ids expression is increased after the loss of netrin1
(A–D) Control (A and C) or netrin1/ (B and D) E11.5 mouse spinal cords were assessed for Id1 (A and B) and Id3 (C and D) expression in the dorsal-most spinal cord (brackets). (E and F) There is a ~35% increase in the domain of Id1 expression (E) and a ~40% increase in Id3 expression (F) in the netrin1/ dorsal-most spinal cord compared to control littermates, consistent with increased Bmp signaling (n = 20 sections from four embryos). (G–L) Chicken spinal cords were electroporated at HH stage 14 with Gfp (G–I) or 1 μg of netrin1 (J–L) under the control of the CAG enhancer and incubated until HH stage 24. (M and N) The electroporation of GFP had no significant effect on the intensity of Id1 (p > 0.12, eight sections from four embryos) or Id3 (p > 0.262, nine sections from four embryos) compared to the non-electroporated side. In contrast, there is a ~35% decrease in the level of Id1 expression (M) when netrin1 is electroporated (p < 0.023, n = 13 sections from eight embryos). There is no significant decrease for Id3 expression (N, p > 0.3, n = 7 sections from five embryos), although expression might be more diffuse. (O and P) Bmps have sequential roles in the specification of dIs, directing dP proliferation, and then the differentiation of dPs into dIs (O). In the absence of netrin1, we observe increased Bmp and Id signaling and an increased number of dPs, but fewer dIs (P). Since Ids are a known target of Bmp signaling, these data suggest that elevating Bmp signaling directly increases Id activity, which then maintains progenitors in an undifferentiated state and suppresses the transition to dIs. (Q and R) In the dorsal-most spinal cord, Bmps act from the RP to activate Bmpr signaling in NPCs, thereby resulting in the activation of Ids, and other factors, needed for dP identity (Q). In the intermediate spinal cord, the presence of netrin1 acts to limit Bmp signaling, potentially through the regulation of mRNA processing, thereby permitting intermediate dP identity (R). Probability of similarity between control and experimental groups: *p < 0.05, ***p < 0.0005, Student’s t test. Scale bar: 100 μm.

Update of

Similar articles

References

    1. Kennedy TE, Serafini T, de la Torre JR, and Tessier-Lavigne M. (1994). Netrins are diffusible chemotropic factors for commissural axons in the embryonic spinal cord. Cell 78, 425–435. - PubMed
    1. Serafini T, Kennedy TE, Galko MJ, Mirzayan C, Jessell TM, and Tessier-Lavigne M. (1994). The netrins define a family of axon outgrowth-promoting proteins homologous to C. elegans UNC-6. Cell 78, 409–424. - PubMed
    1. Deiner MS, Kennedy TE, Fazeli A, Serafini T, Tessier-Lavigne M, and Sretavan DW (1997). Netrin-1 and DCC mediate axon guidance locally at the optic disc: loss of function leads to optic nerve hypoplasia. Neuron 19, 575–589. - PubMed
    1. Hamasaki T, Goto S, Nishikawa S, and Ushio Y. (2001). A role of netrin-1 in the formation of the subcortical structure striatum: repulsive action on the migration of late-born striatal neurons. J. Neurosci. 21, 4272–4280. 10.1523/JNEUROSCI.21-12-04272.2001. - DOI - PMC - PubMed
    1. Livesey FJ, and Hunt SP (1997). Netrin and netrin receptor expression in the embryonic mammalian nervous system suggests roles in retinal, striatal, nigral, and cerebellar development. Mol. Cell. Neurosci. 8, 417–429. 10.1006/mcne.1997.0598. - DOI - PubMed

Publication types

Associated data