. 2025 Mar;1871(3):167572.
doi: 10.1016/j.bbadis.2024.167572. Epub 2024 Nov 13.

Integrated multiomic analysis identifies TRIP13 as a mediator of alveolar epithelial type II cell dysfunction in idiopathic pulmonary fibrosis

Affiliations

Integrated multiomic analysis identifies TRIP13 as a mediator of alveolar epithelial type II cell dysfunction in idiopathic pulmonary fibrosis

Laurence St Pierre et al. Biochim Biophys Acta Mol Basis Dis. 2025 Mar.

Abstract

Idiopathic pulmonary fibrosis (IPF) is a lethal progressive lung disease urgently needing new therapies. Current treatments only delay disease progression, leaving lung transplant as the sole remaining option. Recent studies support a model whereby IPF arises because alveolar epithelial type II (AT2) cells, which normally mediate distal lung regeneration, acquire airway and/or mesenchymal characteristics, preventing proper repair. Mechanisms driving this abnormal differentiation remain unclear. We performed integrated transcriptomic and epigenomic analysis of purified AT2 cells which revealed genome-wide alterations in IPF lungs. The most prominent epigenetic alteration was activation of an enhancer in thyroid receptor interactor 13 (TRIP13), although TRIP13 was not the most significantly transcriptionally upregulated gene. TRIP13 is broadly implicated in epithelial-mesenchymal plasticity. In cultured human AT2 cells and lung slices, small molecule TRIP13 inhibitor DCZ0415 prevented acquisition of the mesenchymal gene signature characteristic of IPF, suggesting TRIP13 inhibition as a potential therapeutic approach to fibrotic disease.

Keywords: ATAC-seq; Epigenomic analysis; Epithelial-mesenchymal plasticity; Idiopathic pulmonary fibrosis (IPF); RNA-seq; TRIP13.


Conflict of interest statement

Declaration of competing interest The authors declare that they have no known competing financial interests or personal relationships that could have appeared to influence the work reported in this paper.

Figures

Fig. 1.
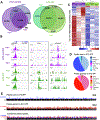
Fig. 1.. AT2-IPF cells exhibit genome-wide dysregulation in gene expression patterns.
A. Supervised heatmap of top 5 % significantly differentially expressed genes (false discovery rate (FDR) < 0.05) between AT2-control (purple) and AT2-IPF (green) samples. Expression counts normalized by z-score; red = elevated in IPF, blue = decreased in IPF. B. Volcano plot of differentially expressed genes between AT2-control and AT2-IPF. X-axis = log2-fold change between AT2-control and AT2-IPF. Y-axis = −log10 of the FDR-corrected p-value significance of gene expression changes. Red = activated in AT2-IPF relative to AT2-control, blue = decreased in AT2-IPF relative to AT2-control. Black = non-significant changes. Gray dotted lines = significance cutoffs. Select significant changes are indicated. C. Bar plot of pathway enrichment for differentially expressed genes in AT2-IPF vs. AT2-control generated in Ingenuity Pathways Analysis (IPA). X-axis = −log10 Benjamini-Hochberg corrected p-value of pathway enrichment significance. Bar color reflects Z-score for pathway enrichment; red = predicted activation in AT2-IPF, blue = predicted inhibition in AT2-IPF. D. Bar graph of relative expression values for AT2-associated, EMT-associated and basal-associated genes in AT2-control (purple) vs. AT2-IPF cells (green). *p ≤ 0.05, **p ≤ 0.01, and ***p ≤ 0.001 compared to control group.
Fig. 2.
Fig. 2.. AT2-IPF cells exhibit genome-wide epigenetic alterations.
A. Venn Diagrams of bulk ATAC-seq peak overlap among AT2-control (purple) and AT2-IPF (green) replicates. B. Peak enrichment for select loci displayed using Integrated Genomics Viewer (IGV). X = genomic locus peak occupies, y = peak height. AT2-control replicates = purple, AT2-IPF replicates = green. C. Heatmap of top 10 % differentially accessible (DA) peaks, calculated as area under the curve (AUC) in GenRich. Ward clustering was used for samples (columns) and ATAC peak regions (rows). Red = enriched for ATAC reads within the peak, blue = little to no reads within the peak region. AT2-control = purple, AT2-IPF = green. D. Pie charts showing genomic distribution of consensus peaks with differential occupancy in AT2-control and AT2-IPF and their position relative to nearest-neighbor gene bodies. Regions closing (blues) and opening in IPF (reds) are classified based on the indicated nearest neighbor gene structures: Exon = peak overlap with nearest neighborgene known exon region, Intergenic = peak occurs >2.5 kb from transcriptional start site and outside of known gene regions, Intron = peak lies within known intron of nearest-neighbor gene, Non-coding = peak lies in the non-coding region of nearest-neighbor gene, Promoter = peak occurs within 2.5 kb of the transcription start site (TSS) of nearest-neighbor gene, TSS = peak lies within 1 kb of the TSS of nearest-neighbor gene, Other = peak overlaps with other known genomic elements (e.g., LINE, SINE, etc). Pie chart values are percentages of total peak occurrences. E. Genome graph plot of genomic distribution for peaks present in AT2-control and lost in AT2-IPF (blue, 366 peaks) and peaks gained in AT2-IPF (red, 1567 peaks). X-axis = human chromosomes 1–22 displayed as one contiguous line. Y-axis = number of peaks within a given region (~250 k bases).
Fig. 3.
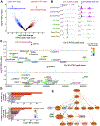
Fig. 3.. Integrated transcriptomic and epigenomic analysis reveals the TRIP13 gene as a primary target of epigenomic dysregulation in IPF.
A. Volcano plot of differential ATAC peak strength in AT2-control vs. AT2-IPF. X-axis = log2 fold change, y-axis = −log10 of the FDR-corrected p-value significance calculated in GenRich. Red = ATAC reads enriched in AT2-IPF consensus peak regions, blue = ATAC reads enriched in AT2-control consensus peak regions. Black = non-significant changes. Gray dotted lines = significance cutoffs. B. Read count enrichment and called peaks at the top gained (TRIP13 genomic locus, Chr5) and lost (Chr20) loci displayed using Integrated Genomics Viewer (IGV). X-axis = chromosome 5: 906,847–920,609 (left) or chromosome 20: 6,056,800-6,059,700 (right). Coordinates are hg38-based. Y-axis = peak height. AT2-control replicates = purple, AT2-IPF replicates = green, basal replicates = brown. C. Local Manhattan plot of the distal tip of the p-arm of chromosome 5. X-axis = genomic coordinates. Y-axis = −log of p-value for significance in gene expression changes. Dashed line indicates significance threshold. Each dot represents a known gene within the distal p arm of chromosome 5 (upper plot) or chromosome 20 (lower plot). Dot color reflects log2 fold change in gene expression between AT2-IPF and AT2-control. Red = elevated expression in AT2-IPF relative to AT2-control, blue = decreased expression in AT2-IPF relative to AT2-control. D. Bar plot of IPA of RNA gene expression differences in known upstream regulator transcription factors predicted to influence differential gene expression in AT2-IPF vs. AT2-control (top panel). Bar plot of HOMER-calculated transcription factor binding site (TFBS) motifs enriched in AT2-IPF vs. AT2-control consensus ATAC peaks (bottom panel). Bar colors based on the IPA-calculated Z-sore of activation; red = predicted to be activated in AT2-IPF samples, blue = predicted to be inhibited in AT2-IPF samples. E. IPA network diagram of relationship between known upstream regulators predicted to be activated in AT2-IPF compared to AT2-control samples. Orange = predicted to be activated in AT2-IPF, blue = predicted to be inhibited in AT2-IPF.
Fig. 4.
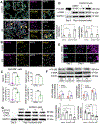
Fig. 4.. TRIP13 expression in control and IPF human lung and effect of TRIP13 inhibition on AT2 cells.
A. Representative control (n = 4) and IPF (n = 4) lungs stained for TRIP13 (magenta), HTII-280 (yellow) and KRT5 (gray). Yellow arrows: TRIP13 co-expression with HTII-280 and KRT5. DAPI (cyan): nuclear counterstain. Scale bars = 100 μm for lower magnification and 50 μm for higher magnification views (small squares). B. Representative cytospins of EpCAM+ cells isolated from control (n = 4) and IPF (n = 3) distal lung stained for TRIP13 (magenta), SFTPC (yellow) and KRT5 (gray). DAPI (cyan): nuclear counterstain. Scale bars = 100 μm. C. Quantitative analysis of cytospins of EpCAM+ cells from B. Data are shown as mean ± SEM (* = P < 0.05; ** = P <0.01; *** = P <0.001; **** = P <0.0001). D. Representative western blots of freshly isolated (D0) and AT2 cells cultured in 2D on plastic, treated with DMSO or DCZ0415 for 4 days (n = 3) and probed for HTII-280 and α-SMA. Bar graphs below show quantitation of western blot densitometric analyses of cultured AT2 cells. Data are shown as mean ± SEM (* = P < 0.05; ** = P≤ 0.01). E. Representative images of AT2 cells cultured in 2D on chamber slides treated with DMSO or DCZ0415 (5 μM) for 2, 4, and 8 days, and stained for VIM (magenta) (n = 3). DAPI (cyan): nuclear counterstain. Scale bars: 100 μm. F. Representative western blots of control lung tissue slice cultures treated with control cocktail (CC) or fibrotic cocktail (FC) together with DMSO or DCZ0415 (5 μM) for 2 days (n = 5). Bar graphs below show quantitation of western blot densitometric analyses. Data are shown as mean ± SEM (* = P < 0.05). G. Representative western blots of freshly isolated (D0) and AT2 cells cultured in 2D on plastic, treated with DMSO or DCZ0415 for 4 days (n = 4) and probed for phospho-STAT3 (p-STAT3) and STAT3 (total STAT3). Bar graphs at the right show quantitation of western blot densitometric analyses of cultured AT2 cells. Data are shown as mean ± SEM (* = P<0.05; *** = P≤0.001).

References

    1. King TE, Pardo A, Selman M, Idiopathic pulmonary fibrosis, Lancet 378 (9807) (2011) 1949–1961. - PubMed
    1. Luo W, Gu Y, Fu S, Wang J, Zhang J, Wang Y, Emerging opportunities to treat idiopathic pulmonary fibrosis: design, discovery, and optimizations of small-molecule drugs targeting fibrogenic pathways, Eur. J. Med. Chem 260 (2023) 115762. - PubMed
    1. George PM, Patterson CM, Reed AK, Thillai M, Lung transplantation for idiopathic pulmonary fibrosis, Lancet Respir. Med 7 (3) (2019) 271–282. - PubMed
    1. Selvarajah B, Platé M, Chambers RC, Pulmonary fibrosis: emerging diagnostic and therapeutic strategies, Mol. Aspects Med 94 (2023) 101227. - PubMed
    1. Pauchet A, Chaussavoine A, Pairon JC, Gabillon C, Didier A, Baldi I, et al., Idiopathic pulmonary fibrosis: what do we know about the role of occupational and environmental determinants? A systematic literaturereview and meta-analysis, J. Toxicol. Environ. Health B Crit. Rev 25 (7) (2022) 372–392. - PubMed

Publication types

MeSH terms

Substances