. 2024 Dec;47(12):100149.
doi: 10.1016/j.mocell.2024.100149. Epub 2024 Nov 13.

PKA regulates autophagy through lipolysis during fasting

Affiliations

PKA regulates autophagy through lipolysis during fasting

Yul Ji et al. Mol Cells. 2024 Dec.

Abstract

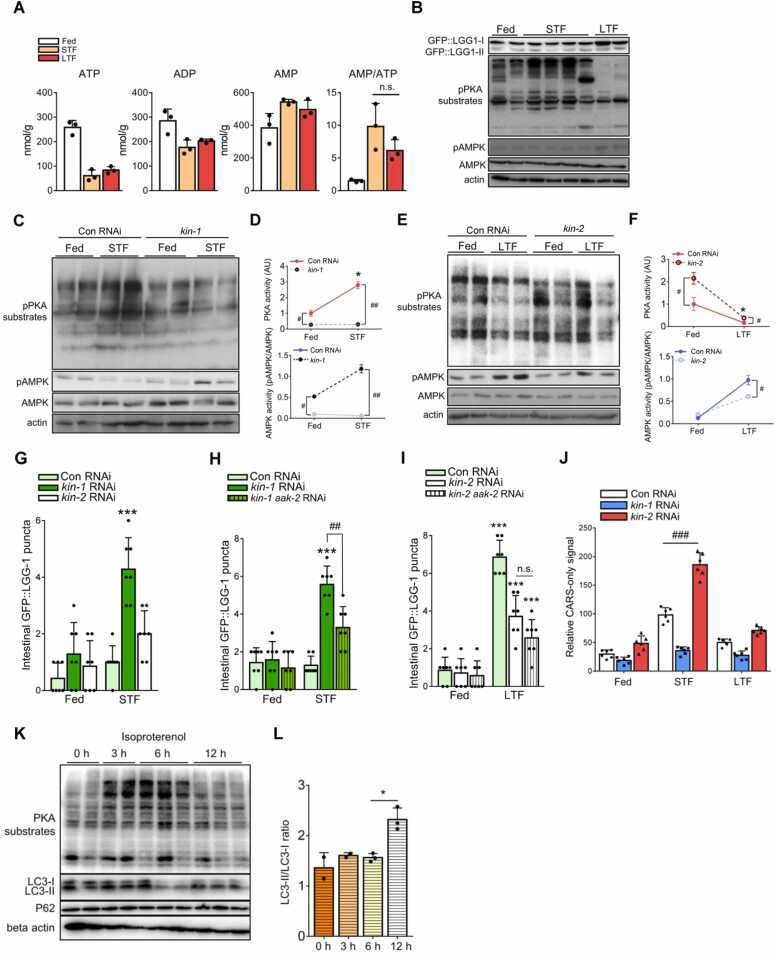
Autophagy is a crucial intracellular degradation process that provides energy and supports nutrient deprivation adaptation. However, the mechanisms by which these cells detect lipid scarcity and regulate autophagy are poorly understood. In this study, we demonstrate that protein kinase A (PKA)-dependent lipolysis delays autophagy initiation during short-term nutrient deprivation by inhibiting AMP-activated protein kinase (AMPK). Using coherent anti-Stokes Raman spectroscopy, we visualized free fatty acids (FFAs) in vivo and observed that lipolysis-derived FFAs were used before the onset of autophagy. Our data suggest that autophagy is triggered when the supply of FFAs is insufficient to meet energy demands. Furthermore, PKA activation promotes lipolysis and suppresses AMPK-driven autophagy during early fasting. Disruption of this regulatory axis impairs motility and reduces the lifespan of Caenorhabditis elegans during fasting. These findings establish PKA as a critical regulator of catabolic pathways, prioritizing lipolysis over autophagy by modulating AMPK activity to prevent premature autophagic degradation during transient nutrient deprivation.

Keywords: AMP-activated protein kinase; Autophagy; Caenorhabditis elegans; Free fatty acid; Lipolysis; Protein kinase A.


Conflict of interest statement

Declaration of Competing Interests The authors declare that they have no known competing financial interests or personal relationships that could have appeared to influence the work reported in this paper.

Figures

ga1
Graphical abstract
Fig. 1
Fig. 1
Autophagy is initiated by long-term nutritional deprivation. (A) In worms, lipids and autophagy initiation were visualized over time during fasting. Representative images of lipids and GFP::LGG-1 puncta (white arrowhead). (B) Increased GFP::LGG-1 puncta (white arrowhead) during fasting in the intestine. (C) Time course measurement to quantify lipid levels based on LipidTOX signal and intestinal GFP::LGG-puncta during fasting (n = 7). (D-F) 3T3-L1 adipocytes were treated with isoproterenol (1 μM). BODIPY signal was used for neutral lipid measurement (E), and lysosomal activity was observed by lysotracker staining (F). (G) Measurement of neutral lipids and lysotracker signal over time during fasting (n = 5). (H) Levels of LC3 and P62 protein were detected by western blotting in 3T3-L1 adipocytes treated with isoproterenol (1 μM). (I) Relative levels of glycerol and free fatty acids in 3T3-L1 adipocytes upon isoproterenol (1 μM) treatment. Data represent the mean ± SD; *P < .05, **P < .01, ***P < .001 vs 0-hour fasted group (or isoproterenol-treated group), #P < .05, ###P < .001 vs 0-hour fasted group (or isoproterenol-treated group).
Fig. 2
Fig. 2
Autophagy is initiated when stored lipids are decreased during fasting. (A-C) Worms were fed with different sources of bacteria, followed by fasting. Representative images of lipids and GFP::LGG-1 puncta (white arrowhead) (A), quantification data of intestinal lipids (B), and GFP::LGG-1 puncta (C) during short-term fasting (STF, 4 hours) and long-term fasting (LTF, 8 hours; n = 7). (D–F) atgl-1 was suppressed via feeding RNA interference (RNAi), resulting in attenuated lipids breakdown throughout fasting (STF [4 hours], LTF [8 hours]). Fewer decreased lipids during LTF (E) with attenuated increased GFP::LGG-1 puncta (F) (n = 7). (G) Principal component (PC) analysis plot of the first 2 principal components (PC1 and PC2) generated from the metabolome profiles of worm extracts during fasting (STF [4 hours], LTF [8 hours]). (H) Heat map of metabolites in metabolomic analysis (STF [4 hours], LTF [8 hours]). (I and J) Heat map of fatty acids (I) and acylcarnitines (J) in metabolomic analysis (STF [4 hours]), LTF [8 hours]). All scale bars are 10 µm. Data represent the mean ± SD; *P < .05, **P < .01, ***P < .001, and #P < .05, ##P < .01, ###P < .001 vs fed.
Fig. 3
Fig. 3
Coherent anti-Stokes Raman spectroscopy (CARS)-only signals detect FFAs in Caenorhabditis elegans. (A and B) CARS signal for lipids (-CH2-) and neutral lipids dye (BODIPY) signals were imaged together in 3T3-L1 adipocytes treated with isoproterenol (1 μM). White dashed lines indicate CARS-only signals (A). CARS-only signals increased after 3 hours of isoproterenol treatment (B). (C and D) Biochemically measured glycerol and free fatty acid (FFA) levels in isoproterenol-treated 3T3-L1 adipocytes. Similar to the CARS-only signals, both glycerol (C) and FFAs (D) increased after 3 hours of isoproterenol treatment. (E) CARS image of lipids in fed worms. (F and G) Inset images of the intestinal area (F) and hypodermis (G). (H) CARS image of lipids (red) in the anterior intestine during fasting. Hypodermal area “H” around the intestinal area between dashed lines, “I” between solid and dashed lines. (I) Unlike the hypodermis, the intestine showed a decrease in stored lipids over time during fasting (n = 6). (J) Conserved fatty acid oxidation-related genes (red characters). (K) In atgl-1 Tg worms, CARS-only signals were increased and further enhanced when fatty acid oxidation genes were suppressed via RNAi. Data represent the mean ± SD; *P < .05, **P < .01, ***P < .001 vs 0 hour isoproterenol treatment (B-D), vs N2 control RNAi (N2 Con RNAi) (K), #P < .05.
Fig. 4
Fig. 4
Oxidation of lipolysis-derived free fatty acids (FFAs) is required for autophagy initiation. (A) Coherence anti-Stokes Raman spectroscopy (CARS) signals for lipids (-CH2-) and neutral lipid dye (LipidTOX) were monitored together with GFP::LGG-1 puncta (white arrowhead) during fasting (short-term fasting [STF] [4 hours], long-term fasting [LTF] [8 hours]). (B) CARS-only signals increased during STF, followed by a decrease during LTF when GFP::LGG-1 puncta were increased (STF [4 hours], LTF [8 hours]). (C) CARS-only signals of cpt-3 RNAi worms upon fasting (STF [4 hours], LTF [8 hours]). (D) GFP::LGG-1 puncta of cpt-3 RNAi worms upon fasting (STF [4 hours], LTF [8 hours]). (E) FFA levels were calculated upon the progression of lipolysis and fatty acid oxidation. Nonlinear equations were obtained (i and ii), where α and β are the elimination rate constant of neutral lipids via lipolysis and FFAs via oxidation, respectively. (iii) was obtained from (i and ii). (F) Progression of lipolysis and fatty acid oxidation are αt and βt, respectively (dashed line represents changes in FFA levels over time that can be determined according to α and β). (G) Top view of (F). (H) Graph for estimated FFA levels when α and β were 0.4909 and 0.3736, respectively, calculated from the mean value of CARS-only signals observed in STF (STFCO) and LTF (LTFCO). (I) Estimated FFA levels in atgl-1 RNAi and control group. Data represent the mean ± SD; *P < .05, **P < .01, ***P < .001 vs fed group, and ##P < .01, ###P < .001.
Fig. 5
Fig. 5
Protein kinase A (PKA) is activated during short-term fasting (STF) and suppresses AMPK-dependent autophagy. (A) Ratio of AMP/ATP levels from metabolomic analysis (STF [4 hours], long-term fasting [LTF] [8 hours]). (B) Western blot of protein extracts from worms during fasting (STF [4 hours], LTF [8 hours]). (C) Western blot of protein extracts from kin-1 RNAi worms during fasting (STF, 4 hours). (D) Quantification of PKA activity (pPKA substrates normalized to the fed group) and AMPK activity (pAMPK normalized to AMPK in each group). (E) Western blot of protein extracts from kin-2 RNAi worms during fasting (LTF, 8 hours). (F) Quantification of PKA activity (pPKA substrates normalized to the fed group) and AMPK activity (pAMPK normalized to AMPK in each group). (G) kin-1 RNAi worms showed increased GFP::LGG-1 puncta during STF (n = 7). (H and I) Double RNAi knockdown with aak-2 decreased GFP::LGG-1 puncta during fasting (STF [4 hours], LTF [8 hours]) (n = 7). (J) Upregulation of PKA activity by kin-2 RNAi resulted in increased FFA levels during STF (STF [4 hours], LTF [8 hours]). (K) Western blots of isoproterenol-treated (1 μM) 3T3-L1 adipocytes, PKA activity decreased after 12 hours of isoproterenol treatment, which is the time point at which CARS-only signals decrease (Fig. 4B). (L) LC3-II/LC3-I ratio increased when PKA activity and CARS-only signals decreased. Data represent the mean ± SD; *P < .05, ***P < .001 vs fed and #P < .05, ##P < .01. ns, not significant.
Fig. 6
Fig. 6
Hyperactive autophagy decreases food foraging behavior and lifespan. (A) Worms were treated with AMPK activator berberine (BBR) to induce hyperactive autophagy (HA) during short-term fasting (STF), followed by food foraging behavior measurement (STF [4 hours], long-term fasting [LTF] [8 hours]). (B) Foraging ratio was measured over time as the number of worms on bacteria lawn among the transferred nutrient-deprived worms. (C, F, and G) Foraging ratio measurement (STF [4 hours], LTF [8 hours]) (n = 4 biological replicates of 20 worms per experimental condition). 3-Methyladenine (3-MA) was used as an autophagy inhibitor. (D) Bending rate of worms (n = 10). FCCP, trifluoromethoxy carbonylcyanide phenylhydrazone. (E) Pumping rate of worms (n = 7). (H) Worms were treated with BBR to promote HA during STF, followed by lifespan measurement. IF, intermittent fasting (STF [4 hours], LTF [8 hours]). (I-K) Survival rate measurement (n > 50 for each condition). FSK, forskolin. Worms were treated with BBR (100 μM), 3-MA (10 μM), and FSK (200 μM) for 1 h. Data represent the mean ± SD; **P < .01, **P < .001 vs control and ##P < 0.01.

References

    1. Ashrafi K., Chang F.Y., Watts J.L., Fraser A.G., Kamath R.S., Ahringer J., Ruvkun G. Genome-wide RNAi analysis of fat regulatory genes. Nature. 2003;421(6920):268–272. - PubMed
    1. Bonaldo P., Sandri M. Cellular and molecular mechanisms of muscle atrophy. Dis. Models Mech. 2013;6(1):25–39. - PMC - PubMed
    1. Brooks K.K., Liang B., Watts J.L. The influence of bacterial diet on fat storage in C. elegans. PLoS One. 2009;4(10) - PMC - PubMed
    1. Bujak A.L., Crane J.D., Lally J.S., Ford R.J., Kang S.J., Rebalka I.A., Green A.E., Kemp B.E., Hawke T.J., Schertzer J.D., et al. AMPK activation of muscle autophagy prevents fasting-induced hypoglycemia and myopathy during aging. Cell Metab. 2015;21(6):883–890. - PMC - PubMed
    1. Carmen G.Y., Víctor S.M. Signalling mechanisms regulating lipolysis. Cell. Signal. 2006;18(4):401–408. - PubMed

MeSH terms

Substances