. 2024 Nov 15;15(1):9910.
doi: 10.1038/s41467-024-54141-0.

Loss of cytoplasmic actin filaments raises nuclear actin levels to drive INO80C-dependent chromosome fragmentation

Affiliations

Loss of cytoplasmic actin filaments raises nuclear actin levels to drive INO80C-dependent chromosome fragmentation

Verena Hurst et al. Nat Commun. .

Abstract

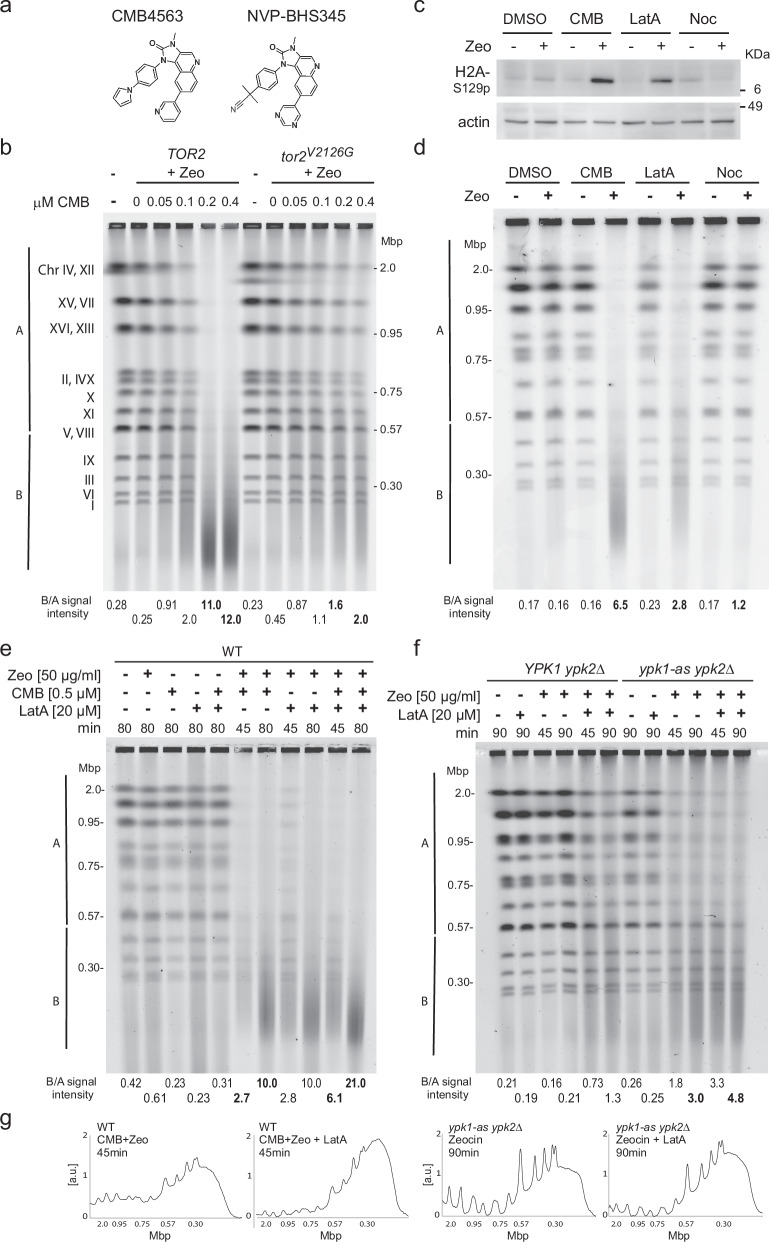
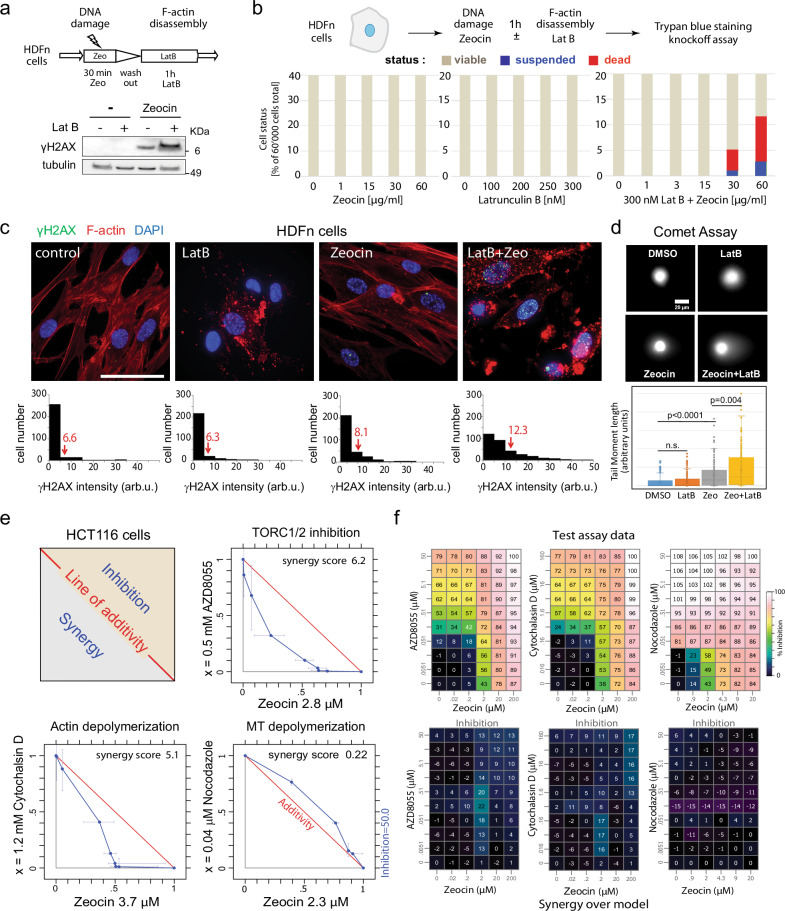
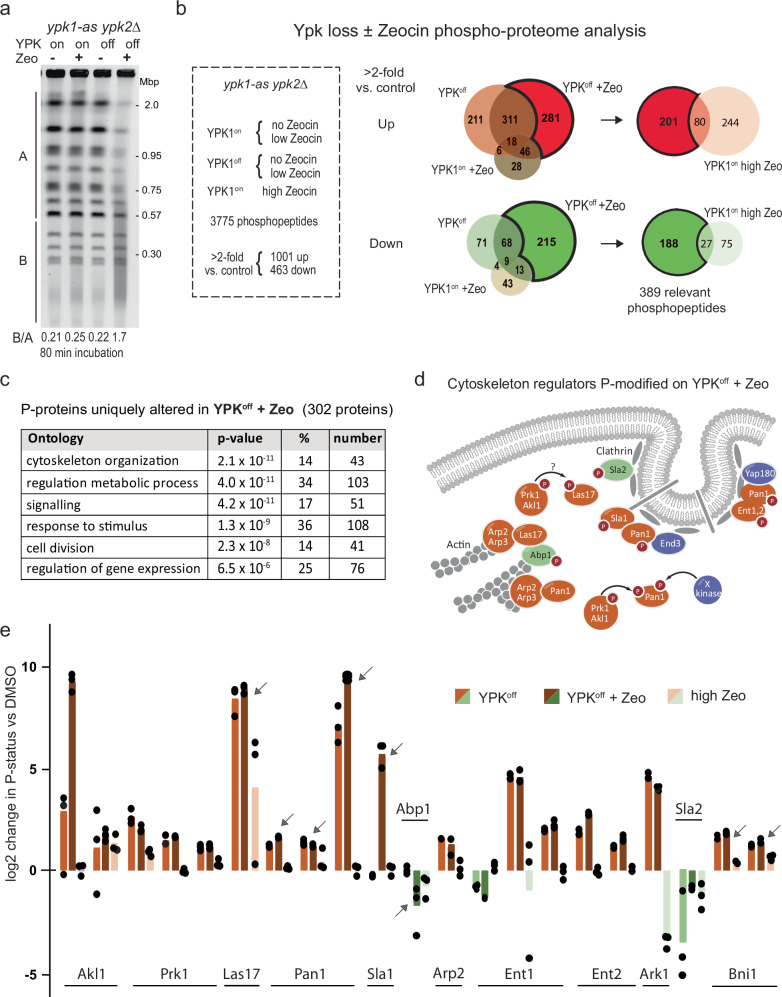
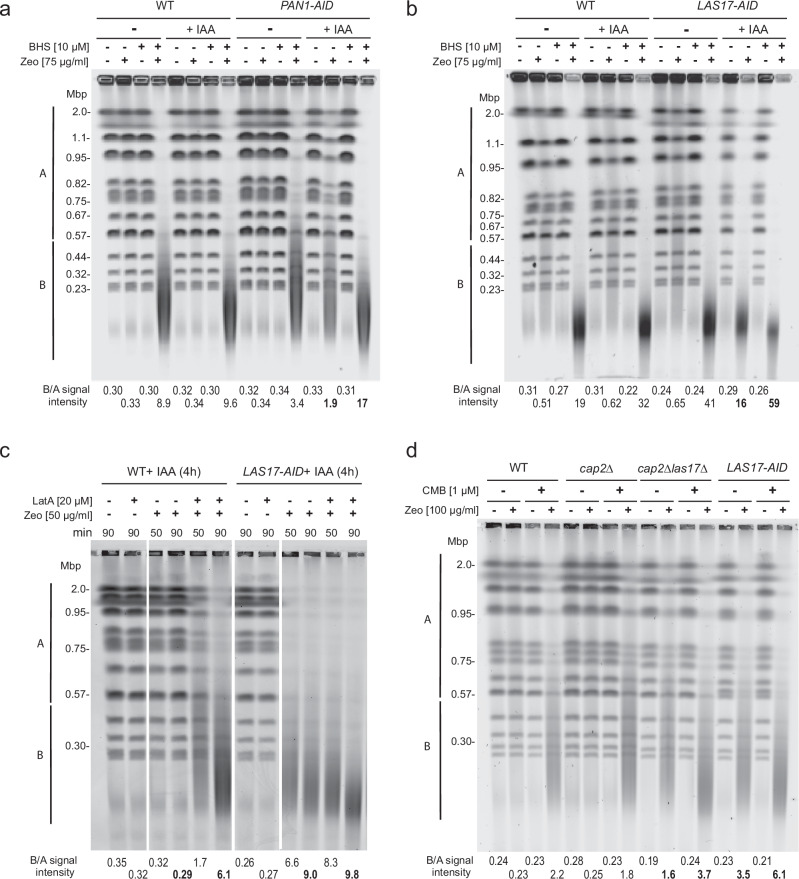
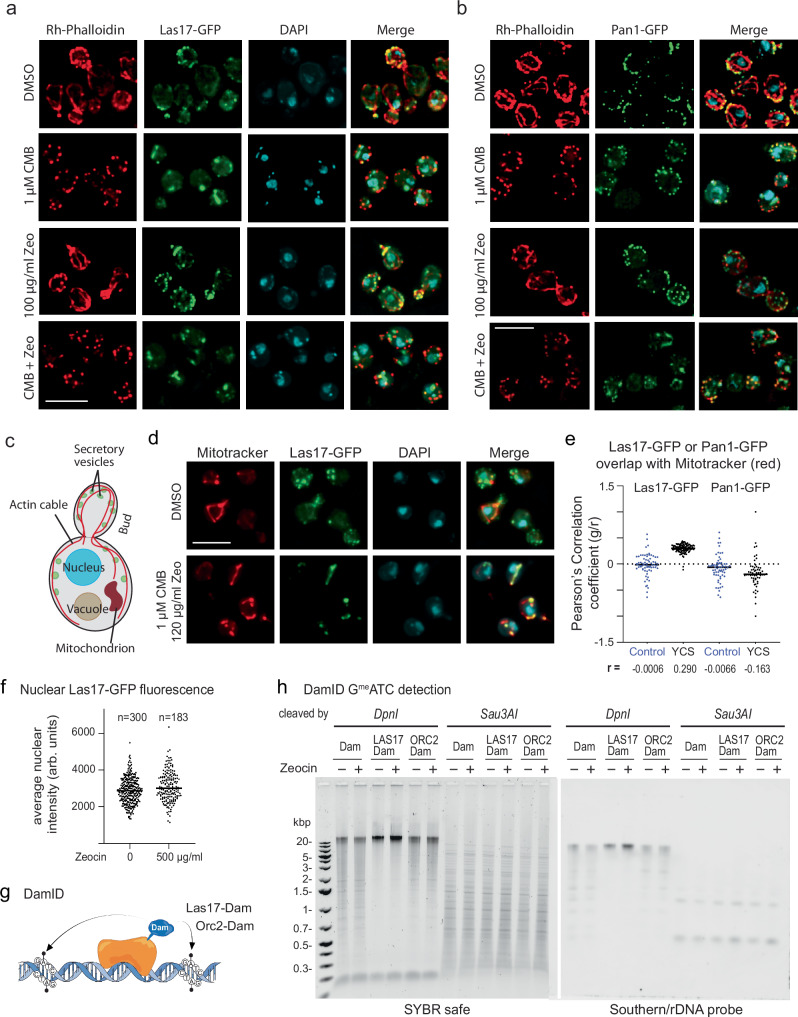
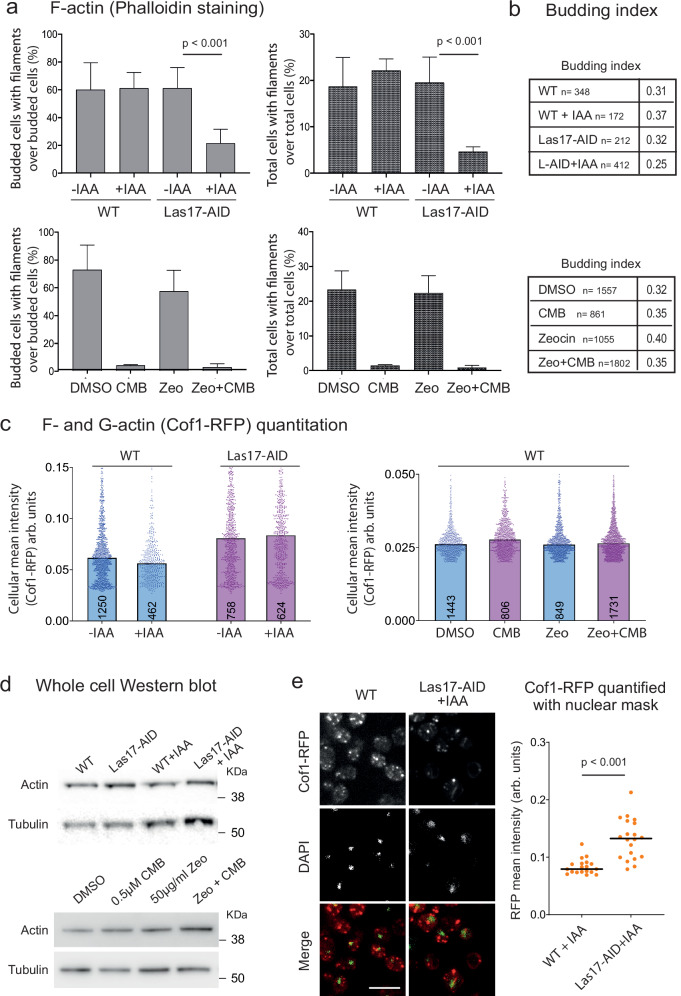
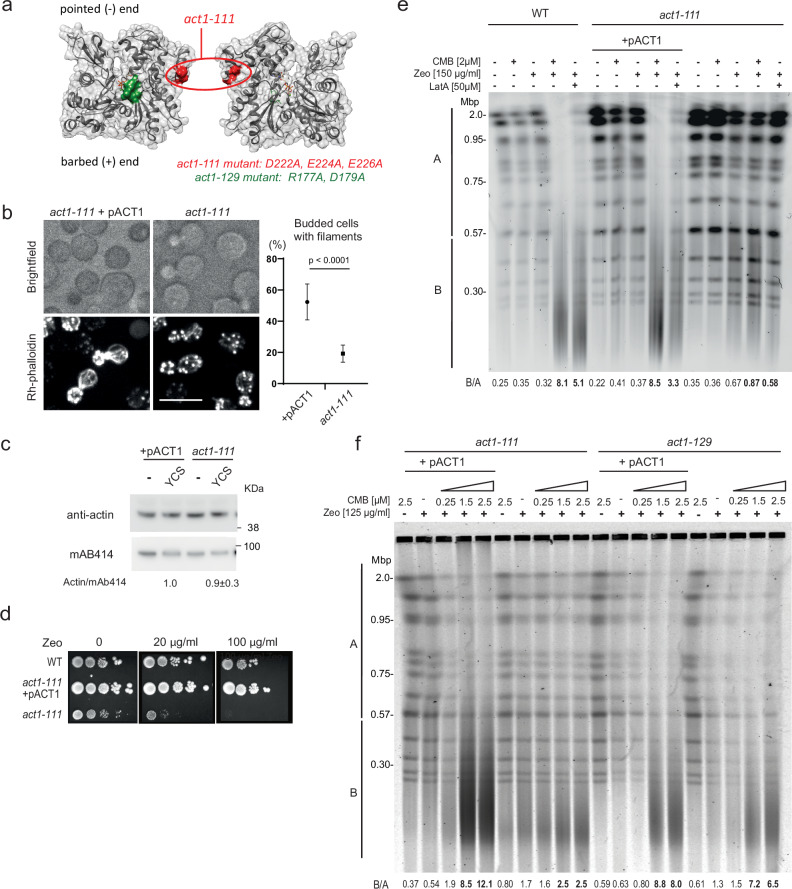
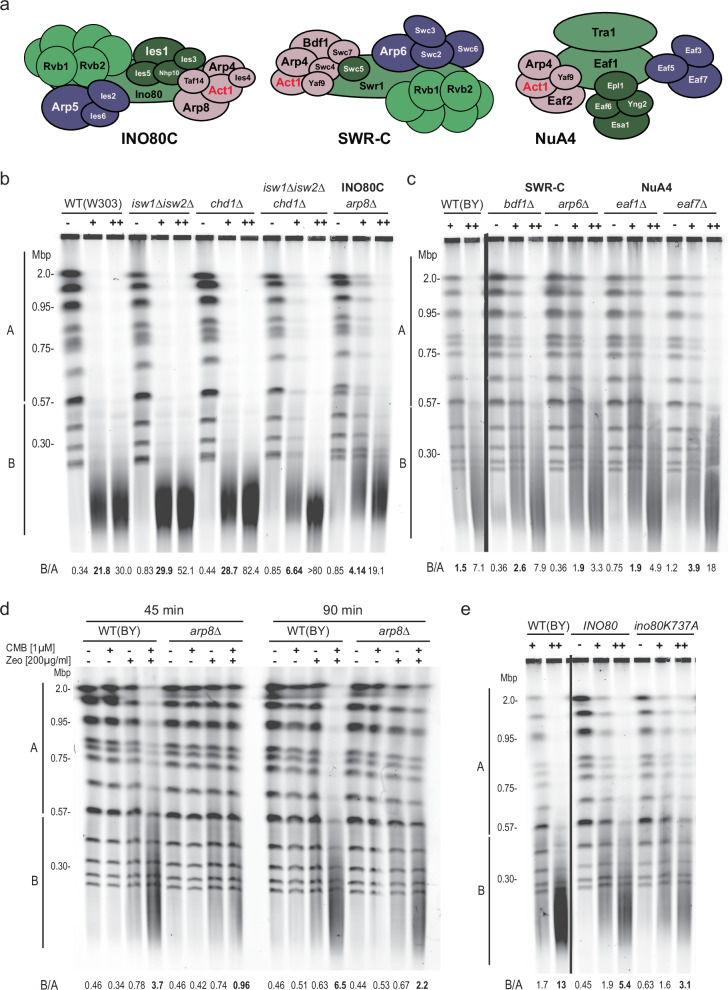
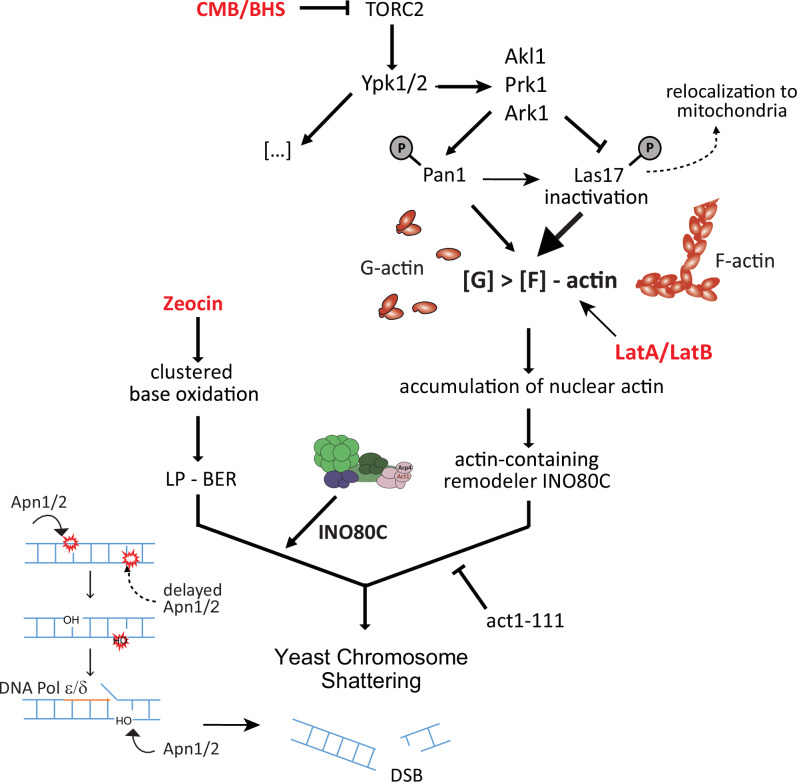
Loss of cytosolic actin filaments upon TORC2 inhibition triggers chromosome fragmentation in yeast, which results from altered base excision repair of Zeocin-induced lesions. To find the link between TORC2 kinase and this yeast chromosome shattering (YCS) we performed phosphoproteomics. YCS-relevant phospho-targets included plasma membrane-associated regulators of actin polymerization, such as Las17, the yeast Wiscott-Aldrich Syndrome protein. Induced degradation of Las17 was sufficient to trigger YCS in presence of Zeocin, bypassing TORC2 inhibition. In yeast, Las17 does not act directly at damage, but instead its loss, like TORC2 inhibition, raises nuclear actin levels. Nuclear actin, in complex with Arp4, forms an essential subunit of several nucleosome remodeler complexes, including INO80C, which facilitates DNA polymerase elongation. Here we show that the genetic ablation of INO80C activity leads to partial YCS resistance, suggesting that elevated levels of nuclear G-actin may stimulate INO80C to increase DNA polymerase processivity and convert single-strand lesions into double-strand breaks.


Conflict of interest statement

Competing interests The authors declare that no competing interests.

Figures

Fig. 1
Fig. 1. TORC2 inhibition and Latrunculin A act on the same pathway for Zeocin-induced YCS.
a Structures of related imidazoquinoline TORC inhibitors CMB4563(CMB) and NVP-BHS345 (BHS). b Isogenic GA-6148 (TOR2) and GA-6150 (tor2V2126G) strains were treated with 75 μg/ml Zeocin (Zeo) with the indicated concentrations of CMB for 75 min. Genomic DNA was subjected to CHEF gel analysis and stained by EtBr, and quantitation is as described in Methods. The tor2V2126G mutation blocks the imidazoquinoline binding pocket rendering GA-6150 resistant to CMB. Molecular weight markers and yeast chromosome numbers are indicated. B/A signal intensity is used to compare chromosome fragmentation within one gel. In bold are values discussed in the text. c Exponentially growing GA-1981 (WT) yeast cells were treated with either 1% DMSO, 0.5 μM CMB, 20 μM Latrunculin A (LatA), or 50 μM Nocodazole (Noc), with or without 50 μg/ml Zeocin for 80 min. Total protein extract was subjected to Western blot probed with anti-H2A-S129-phospho antibody and anti-actin antibody (My BioSource, BSS9231831) or anti-tubulin antibody (Abcam, ab6161). Histone H2A-S129 is the target of checkpoint kinases Tel1 and Mec1. d Yeast genomic DNA from WT cells treated as in c) was analyzed by CHEF gel electrophoresis as in b) and was stained with HDGreen. Gel conditions and quantitation as b. e Exponentially growing WT cells (GA-1981) were treated with Zeocin (50 μg/ml), CMB (0.5 μM), LatA (20 μM), or with indicated combinations for 45 or 80 min. Genomic DNA was subjected to CHEF gel analysis and quantitation as in b. In bold are relevant lanes discussed in the text. f Exponentially growing YPK1 ypk2Δ (GA-5892) and ypk1-as ypk2Δ (GA-5893) cells were treated with Zeocin (50 μg/ml), LatA (20 μM), or the combination, all in the presence of 0.5 μM 1NM-PP1, which inactivates the analog sensitive (as) allele of Ypk1. Incubation time is as indicated. Genomic DNA was analyzed and quantified as in b. g The scans of signal intensities of relevant lanes (indicated in bold) are plotted for visualization but are not those used for quantitation. To the left, the scans relate lanes with bold B/A values in e and to the right, f).
Fig. 2
Fig. 2. Actin depolymerization is synthetically lethal with Zeocin in cultured human cells.
a Experimental flow. b Primary human dermal fibroblasts (HDFn; Life Technologies) were incubated 1 h ± 50 μg/ml Zeocin, washed, then cultured 1 h ± 300 nM LatB. Total protein extracts were probed for α-γH2AX (Merck-Milipore JBW301) and α-tubulin (Abcam ab6161) by western blot. Full blots of duplicate experiments are in Source data. b Synergistic lethality from Zeocin and LatB. HDFn cells (60,000 per sample) were incubated 1 h with indicated titrations of Zeocin, LatB, or in Zeocin +300 nM LatB. Dead cells (Trypan blue+) and suspended cells (Trypan blue-) were scored by BIO-TC20 (BioRad). c HDFn cultures were supplemented with SiR-actin (2 μM) to visualize actin, and treated 1 h with LatB (300 nM), Zeocin (60 μg/ml), or both. Fixed cells immunostained for γH2AX (green, see a), F-actin (SiR-actin, red), and DAPI (blue) were imaged and γH2AX intensity (arbitrary units) was measured by ImageJ for control cells (n = 294), LatB (n = 252), Zeocin (n = 299), and both (n = 323 cells). Arrows indicate mean intensities. Bar = 25 μm. d Alkaline Comet assay monitors ss and ds breaks in HDFn cells after 4 h on LatB (300 nM), Zeocin (60 μg/ml), or both. Comet tail moments calculated by CASP software for ≥200 cells each condition and plotted. Significance was determined by Mann–Whitney rank sum test. Data presented are mean value ±SEM, cells outside 95% confidence. ns = p > 0.05. Raw images uploaded as Source data file. e Inhibition of mTORC1/2 or actin depolymerization reduces HCT116 cell growth synergistically with Zeocin. Human HCT116 cells seeded at 2700 cells/well in 96-well format were treated with titration of Zeocin (x axis) and AZD8055 (mTOR catalytic inhibitor), Cytochalasin D (blocks actin polymerization), or Nocodazole (depolymerizes microtubules; y axes). Proliferation was measured after 96 h using cell titer blue (compound exposure 72 h). Scheme illustrates the isobologram with the red line showing additivity, synergism in lower gray triangle, antagonism in tan, as calculated by a combined chemical genetics method. Blue line = 50% inhibition as f. f The corresponding average values of growth inhibition (upper panels) and synergy over model for three replicates. Colors = % inhibition; for synergy calculation see ref. .
Fig. 3
Fig. 3. The YCS phosphoproteome identifies regulators of actin cytoskeleton as major targets.
a Exponentially growing ypk1-as ypk2Δ cells (GA-5893) were treated with 1% DMSO (mock), 75 μg/ml Zeocin (Ypk1on+Zeo), 0.5 μM 1NM-PP1 (Ypk1off), or both for 80 min, and genomic DNA was subjected to CHEF gel analysis as in Fig. 1b. b Treatments as in a, as well as wild-type yeast in 750 μg/ml Zeocin (high Zeo), were for 80 min, performed in triplicate. Extracted proteins were analyzed by label-free mass spectrometry (see Methods). Phosphopeptides were triaged for change >2-fold vs DMSO control. Venn diagrams show phopshopeptides up (reddish) or down (green tones) in Ypk1off + Zeo vs. Ypk1off or Ypk1on + Zeo. Ypk1off + Zeo-specific targets are darker in the Venn diagrams. From this subgroup we subtracted phosphopeptides altered by Zeocin alone (80 up; 27 down), leaving 201 up- and 188 downregulated phosphopeptides, in 302 proteins. c GO-term analysis of the Ypk+Zeocin-specific phosphoproteome was carried out, and significance was determined vs a total number of factors in yeast in that category using the hypergeometric distribution. Cytoskeletal organization was most significantly enriched. d A cluster of interacting regulators of yeast endocytosis and actin cytoskeleton (image based on), of which all except two (blue) were recovered as Ypk+Zeocin-sensitive phosphoacceptors. Red-labeled proteins gain phosphorylation, green lose it. e Each bar represents a specific phosphotarget site involved in actin filament regulation and endo- and exocytosis, plotted as log2 change of increased (reddish) or decreased (green) phosphorylation by indicated treatments vs DMSO. Individual values are from biological triplicates; tops of bars are median values. Relevant target sites are: Akl1: S541, S496, S504; Prk1, S553, S556, S560; Las17, T380; Pan1, S1003; S1253 or T1256; S991. T993, T995; Sla1, S449; Abp1, T206; T211; Ent1, T160, T163; T395, T388; Ent2, T468, T470, T479; Ark1. S478; Sla2, T468. T470, T479; Bni1, S325, S327, some defining overlapping phosphopeptides. Arrows indicate proteins studied further.
Fig. 4
Fig. 4. Degradation of Pan1 and Las17 elicit YCS on Zeocin.
a Exponentially growing isogenic WT (GA-5731) and PAN1-AID (GA-6810) cells were treated ± 0.5 mM IAA for 4 h to deplete Pan1. Cells were then treated with Zeocin (75 μg/ml) alone or in combination with BHS (10 μM) for 70 min. YCS was monitored as in Fig. 1b and quantitation is described in Methods, with B/A values determined as in Fig. 1 (bold values discussed in text). b As a but for isogenic WT (GA-5731) and LAS17-AID (GA-6839) cells. 0.5 mM IAA was added for 3.5 h and cells were then treated with Zeocin (75 μg/ml) ± BHS (10 μM) for 70 min. YCS was monitored, quantified and scanned as in a. Depletion of Las17 elicits efficient YCS in combination with Zeocin but not alone. c Isogenic WT (GA-5731) and LAS17-AID (GA-6839) strains were exponentially cultured and treated for 4 h with 0.5 mM IAA for 3.5 h to trigger Las17-AID degradation as in b. Cells were treated with LatA (20 μM), Zeocin (50 μg/ml), or the combination in the presence of IAA for 50 or 90 min as indicated. YCS was monitored and quantified as in a. d Isogenic WT, GA-4732 (BY4741 WT), GA-10701 (cap2Δ), GA-10905 cap2Δ las17Δ), and GA-9204 (LAS17-AID, TIR1) were cultured in SC overnight, cells were diluted to OD600 0.16 in 20 ml SC and cultured for 3 h with 0.5 mM IAA for 2 h to deplete Las17. Then equal aliquots were treated with 0.25% DMSO (control), 100 µg/ml Zeocin, 1 µM CMB, or the combination of both for 90 min. YCS was monitored, quantified and scanned as in a, with SYBR safe staining. The strain background is S288C, not W303, and therefore slightly higher concentrations of reagents were used. The cap2Δ mutation partially suppresses YCS provoked by Las17 degradation or by TORC2 inhibition.
Fig. 5
Fig. 5. Pan1 and Las17 do not shift to the nucleus in the presence of Zeocin or CMB + Zeocin.
a Yeast expressing Las17-GFP (GA-6804) was treated 1.5 h with CMB (1 μM), with Zeocin (100 μg/ml) or both. After fixation, DAPI (blue) and F-actin (Rh-phalloidin, red) were captured by spinning disk confocal microscopy. Images are maximum-intensity projections of focal stacks acquired in each channel (see Methods). Bar = 5 µm. b Yeast expressing Pan1-GFP (GA-6764) was treated and stained as in a. DAPI alone is not shown. Bar = 5 µm. c Scheme of a budding yeast cell illustrating structures of interest. d Las17-GFP expressing cells were treated as in a, but stained with 20 nM Mitotracker Red CMXRos (Thermo Scientific) and DAPI (blue). Colocalization of Las17-GFP and mitochondria is quantified in e. Bar = 5 µm. e Yeast expressing Las17-GFP or Pan1-GFP (see a, b) were split and treated 1.5 h either with DMSO (Control, blue) or 1 µM CMB and 150 µg/ml Zeocin (YCS, black). Colocalization of Las17-GFP or Pan1-GFP (green) and Mitotracker (red) was quantified by determining the Pearson correlation coefficient in each single plane of an image stack. n = 118 nuclei for Las17-YCS, all others n = 78; line = median. r values show a robust correlation of Las17 with mitochondria. Repeated twice. Quantitations in Source Data file. f Las17-GFP is not enriched in nuclei on Zeocin. Las17-GFP (green) expressing cells were treated ± 500 μg/ml Zeocin for 1 h at 30 °C, fixed and counterstained with DAPI (blue). Image stacks (green and UV) were analyzed for nuclei spanning at least 5 planes. Nuclear GFP intensity was measured per plane and averaged across ≥5 planes for mean intensity per nucleus, plotted as arbitrary GFP units. n = 300 nuclei without Zeo, mean and S.D. = 2861±700; n = 183 with Zeo, mean and S.D. = 3002±805. Unpaired two-tailed T test with Welch’s correction, p = 0.051. See Source Data Files. g Concept of DamID mapping of Las17- and Orc2-Dam fusions, derived from an existing sketch. h Wild-type (GA-1981) cells expressing Dam, Las17-Dam, or Orc2-Dam were treated ±300 μg/ml Zeocin for 1 h at 30 °C. Genomic DNA digested with DpnI (cleaves at GmATC) or Sau3AI (cleaves GATC, methylation indifferent), was run on 1% agarose gels; stained with SYBR safe or rDNA by Southern blot (see Methods).
Fig. 6
Fig. 6. Las17 degradation and TORC2 inhibition decrease F-actin altering the G-/F-actin ratio.
a Fraction of budded cells or total cells with F-actin filaments was determined after staining with Rh-phalloidin. Exponentially growing cells (GA-5731, AID control; GA-6840, Las17-AID; GA-1981, WT) were treated as indicated (±0.25 mM IAA for Las17-AID and its control, and 50 μg/ml Zeocin ± 0.5 μM CMB for WT), then fixed and stained with Rh-phalloidin. Image examples in Supplementary Fig. 3. Both brightfield and fluorescent images were scored for budding index and cells with filaments by three independent operators on blinded images. Number of cells scored per condition is shown in b. Plots show % budded cells with filaments (left) or % total cells with filaments (right). Data presented as mean value (top of bar) ±SEM. Raw numbers in Source Data file. b Budding index (bud presence) was scored for the same cell populations analyzed in a by three operators on blinded images. Total number cells are same for a, b. Plotting Budded cells with filament/Budded cells excludes cell cycle impact on results. c Yeast strains as a were transformed with a Cof1-RFP (internal tag, Addgene #37102) expression plasmid and treated as above. Cof1-RFP intensity monitors both G- and F-actin and was quantified for each condition with a CellProfiler pipeline. Each dot represents one cell and the number of cells scored range from 402 to 1731, as indicated within each bar. All data points are plotted and top of bar indicates median. By Wilcoxon rank sum test actin levels do not vary significantly ± IAA nor under YCS conditions. d Cells of the samples used in a were collected before fixation. Total protein extracts were subjected to SDS-PAGE and western blotting with validated anti-actin (My BioSource, BSS9231831) or anti-tubulin (Abcam, ab6161). e Scoring nuclear actin detected through Cof1-RFP (expressed as in c) using nuclear masking based on DAPI staining (Fig. 5f) on WT and an isogenic strain lacking Las17 (LAS17-AID + IAA). Samples visualized as c. Bar = 10 μm. In graph of mean (bar = mean values) of n nuclei (n = 19, WT; Mean = 0.8339 ± 0.0131; n = 20 Las17-AID; Mean = 0.1316 ± 0.0340). Based on a two-tailed T test p < 0.0001. Data in Data Source file.
Fig. 7
Fig. 7. The act1-111 mutation attenuates TORC2-Zeocin-induced YCS.
a Position of act1-111 (red) and act1-129 (green) mutations on an actin monomer shown in two orientations. Filament formation is intact through pointed and barbed ends. b Actin cytoskeleton staining in act1-111 (GA-8592) ±pACT1. Exponentially growing cells were fixed with PFA, stained Rh-phalloidin for 2 h, and imaged. The phalloidin signal in act1-111 expressing pACT1 resembles wild-type, while act1-111 has mostly cortical F-actin patches. Quantitation of actin cables was scored by two blinded operators on three isolates of the act1-111 mutant vs act1-111 + pACT1. n total +pACT1 = 1012, n total act1-111 = 2790; data are presented as mean value ±SEM, by two-tailed unpaired T test, p < 0.0001. Scoring is in Source Data file. Scale bar = 10 μm. c Actin levels are constant under YCS conditions in act1-111 strains. Whole protein extracts from strains grown as in b were analyzed by western for a nuclear pore protein (Mab414, Abcam) and actin (My BioSource). Quantitation reflects four blots scanned by the Typhoon scanner; Actin:Mab414 value on YCS is normalized to +pACT1. d The act1-111 mutant (a) is hypersensitive to Zeocin. 1:10 dilution series of act1-111 ± pACT1 on SC agar plus glucose with indicated Zeocin concentrations. Colonies grew 3 days at 30 °C; performed in triplicate with similar results. e Las17-GFP act1-111 cells (GA-8592) ± pACT1 plasmid are resistant to YCS. An isogenic wild-type background (GA-9247; BY background) and the act1-111 mutant were treated with 2 µM CMB and 150 µg/ml Zeocin for 1.5 h, and genomic DNA was monitored by CHEF gel analysis. Where indicated, 50 µM LatA was added rather than CMB. Gels and quantitation are as Fig. 1b. B/A values show that act1-111 is resistant to CMB and LatA treatment. Experimental repeats (n = 3) include panel f. f Wild-type and act1-111 (GA-8592) and act1-129 cells (GA-8590) ± pACT1 plasmid were treated 1.5 h with Zeocin (125 µg/ml), a titration of CMB (0.25–2.5 μM) or Zeocin and CMB as indicated. Genomic DNA was monitored by CHEF gel, stained, and quantified as Fig. 1b. The act1-111, but not act1-129 cells show less CMB-induced fragmentation. The experiment was repeated three times.
Fig. 8
Fig. 8. Functional INO80C is required for efficient YCS.
a Sketches of subunit composition of the S. cerevisiae INO80C, SWR-C and NuA4 chromatin remodelers and modifiers each containing actin as a core subunit. Subunit names are from budding yeast. b Individual ISWI and CHD remodelers are not needed for YCS, while loss of Arp8, a unique INO80C subunit confers partial resistance. Exponential cultures of wild-type (WT) W303 (GA-9875); isw1Δ,isw2Δ (GA-9878); chd1Δ (GA-9879); isw1Δ isw2Δ chd1Δ (GA-9882) and arp8Δ (GA-9848) were treated for 1.5 h with 0.5 μM CMB and 50 μg/ml Zeocin (+) or 1 μM CMB and 100 μg/ml Zeocin (++), prior to processing for CHEF gel analysis. Quantitation as in Fig. 1b. c Isogenic strains in the BY background lacking indicated remodeler subunits of SWR-C or NuA4 were tested in the YCS assay. Note that this background is more resistant to Zeocin than W303. BY4733 (GA-2263), bdf1Δ (GA-9953), arp6Δ (GA-2319), eaf1Δ (GA-9954), eaf7Δ (GA-9955) were grown to exponential phase and treated for 1.5 h with DMSO (−), 0.5 µM CMB and 80 µg/ml Zeocin (+) or 1 µM CMB and 125 µg/ml Zeocin (++), prior to CHEF gel analysis. Quantitation as in Fig. 1b. The eaf7Δ mutant showed slight resistance at low concentrations of Zeocin/CMB, while arp6Δ and eaf1Δ mutants showed minor resistance at the higher concentration. Except for INO80C, the minor effects were inconsistent for a given remodeler. d Deletion of arp8 delays YCS consistent with a requirement for functional INO80C for polymerase processivity during LP-BER. The indicated isogenic strains (ARP8 + = GA-9247; arp8Δ = GA-9250) were incubated with the indicated compounds for either 45 or 90 min, prior to processing for CHEF gel analysis. Quantitation is as in Fig. 1b. At 45 min ARP8+ started to show fragmentation, unlike arp8Δ. The experiment was repeated twice. e The ATPase mutant in the catalytic subunit ino80 (K737A) confers resistance to YCS. Performed in the BY background, ino80Δ (GA-2264) cells bearing Cen-plasmids expressing WT INO80 or ino80 K737A were treated for 1.5 h with 0.5 μM CMB and 80 μg/ml Zeocin (+) or 1 μM CMB and 125 μg/ml Zeocin (++); CHEF gel analysis and quantitation as Fig. 1b. Experiment repeated twice.
Fig. 9
Fig. 9. Model for synergistic action of TORC2 inhibition and Zeocin driving fragmentation.
A mechanistic model of how TORC2 inhibition impacts base excision repair to generate rapid and irreversible DSBs in yeast. Related imidazoquinolines CMB4563 and NVP-BHS345 inhibit TORC2, and in turn YPK1/YPK2, which inactivates Alk1, Prk1 and Ark1,,. These kinases lead to the disruption of several actin regulatory complexes that primarily downregulate endocytosis but also lead to Las17 inactivation and partial relocation to mitochondria. TORC2 inhibition, like the degradation of Las17, leads to increased availability of non-filamentous globular actin (G-actin) and its nuclear accumulation. In Zeocin-treated yeast, the presence of enhanced levels of nuclear actin could activate actin-dependent nucleosome remodelers such as INO80C to increase endonuclease access at paired base oxidation events on opposite strands (as shown) and increase DNA polymerase processivity. When the processive replication polymerase meets a single-strand break created by premature Apn1 (or Ogg1) activity, DSBs can form ref. . Our results suggest a role for chromatin in the appropriate coordination of repair of clustered oxidative lesions.

References

    1. Pollard, T. D. & Cooper, J. A. Actin, a central player in cell shape and movement. Science326, 1208–1212 (2009). - PMC - PubMed
    1. Hu, H. et al. Phosphoinositide 3-kinase regulates glycolysis through mobilization of aldolase from the actin cytoskeleton. Cell164, 433–446 (2016). - PMC - PubMed
    1. Vartiainen, M. K., Guettler, S., Larijani, B. & Treisman, R. Nuclear actin regulates dynamic subcellular localization and activity of the SRF cofactor MAL. Science316, 1749–1752 (2007). - PubMed
    1. Samwer, M. et al. The nuclear F-actin interactome of Xenopus oocytes reveals an actin-bundling kinesin that is essential for meiotic cytokinesis. EMBO J.32, 1886–1902 (2013). - PMC - PubMed
    1. Han, S. S. et al. WASp modulates RPA function on single-stranded DNA in response to replication stress and DNA damage. Nat. Commun.13, 3743 (2022). - PMC - PubMed

Publication types

MeSH terms

LinkOut - more resources