. 2024 Nov 15;15(1):9906.
doi: 10.1038/s41467-024-53787-0.

Microbial species and intraspecies units exist and are maintained by ecological cohesiveness coupled to high homologous recombination

Affiliations

Microbial species and intraspecies units exist and are maintained by ecological cohesiveness coupled to high homologous recombination

Roth E Conrad et al. Nat Commun. .

Abstract

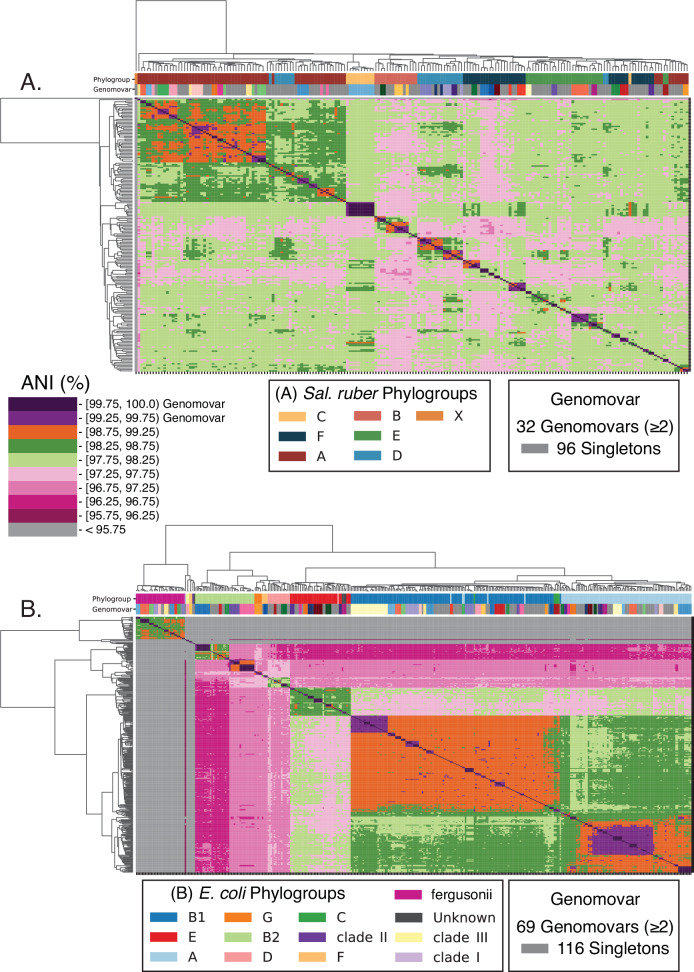
Recent genomic analyses have revealed that microbial communities are predominantly composed of persistent, sequence-discrete species and intraspecies units (genomovars), but the mechanisms that create and maintain these units remain unclear. By analyzing closely-related isolate genomes from the same or related samples and identifying recent recombination events using a novel bioinformatics methodology, we show that high ecological cohesiveness coupled to frequent-enough and unbiased (i.e., not selection-driven) horizontal gene flow, mediated by homologous recombination, often underlie these diversity patterns. Ecological cohesiveness was inferred based on greater similarity in temporal abundance patterns of genomes of the same vs. different units, and recombination was shown to affect all sizable segments of the genome (i.e., be genome-wide) and have two times or greater impact on sequence evolution than point mutations. These results were observed in both Salinibacter ruber, an environmental halophilic organism, and Escherichia coli, the model gut-associated organism and an opportunistic pathogen, indicating that they may be more broadly applicable to the microbial world. Therefore, our results represent a departure compared to previous models of microbial speciation that invoke either ecology or recombination, but not necessarily their synergistic effect, and answer an important question for microbiology: what a species and a subspecies are.


Conflict of interest statement

Competing interests The authors declare no competing interests.

Figures

Fig. 1
Fig. 1. ANI clustering showing genomovar and phylogroup structure for the Sal. ruber and E. coli genomes used in this study.
All vs. all ANI values were computed for Sal. ruber (A) and E. coli and relatives (E. fergusonii/Escherichia clades I–III) (B) using FastANI with default settings. Hierarchical clustering was performed with average linkage using Euclidean distances. Phylogroups were determined from a concatenated core gene tree for each species and with ClermonTyping (see figure key for details). Genomovar assignments were called based on ANI values (see figure key).
Fig. 2
Fig. 2. Extensive recent recombination within the Sal. ruber and E. coli genomes.
Pairwise reciprocal best match (RBM) genes were identified for eight Sal. ruber (A) and eight E. coli (B) genomes spanning different genomovars and clades/phylogroups using BLAST+ with default settings. Each rectangular marker represents a gene, colored differently for highly conserved/universal, core, and accessory genes (see key), and represents the nucleotide sequence identity of RBM genes (y-axis) shared between seven query genomes (each row) and the same reference genome (x-axis, RBM gene position in reference genome) sorted by their ANI values to the reference genome shown on the far right of the panels. Two genomes from the same genomovar as the reference genome are shown in the top 2 rows and other genomovars and phylogroups are shown below. Note the hotspots of sequence diversity among members of the same genomovar, and that some of the genes in these hotspots show ~100% nucleotide identity between the reference genome and genomes of other genomovars (e.g., blue arrows). Green arrows denote genomic islands specific to the reference genome (i.e., not shared with query genomes, denoted by lack of markers in the genomes not carrying the island in the corresponding region of the reference genome) while red arrows denote highly identical regions conserved within the genomovar.
Fig. 3
Fig. 3. Limited functional biases in the recently recombined genes.
The graphs show gene annotations summarized by high-level COG categories as a fraction of total genes in the genome (y-axis) for RBM genes divided into two categories (x-axis): genes with ≥99.8% sequence identity (recombinant), and genes with <99.8% sequence identity (non-recombinant). The asterisks represent functional categories found to be significantly different by one-sided Chi-square test (p value < 0.05) with Benjamini/Hochberg multiple test correction, likely reflecting genes undergoing more frequent recombination than the average gene in the genome, favored by selection for the corresponding functions. Nonetheless, note that, overall, all functional categories are subject to recombination (left columns) and, more or less, with the same frequency—or distribution—as they are found in the genome (right columns) for both species.
Fig. 4
Fig. 4. Recombination to mutation (r/m) ratio as a function of the ANI of the genome pairs compared.
The r/m ratio (y-axes) was estimated for all genome pairs in our collection for each species (graph title on top) using the empirical approach described in the main text, and is plotted against the ANI value of the genome pair compared (x-axes). The marginal plots outside the two axes show histograms for the density of datapoints on each axis. Graphs on the right are zoomed-in versions of the main graphs on the left in the 0–5 range of the y-axis values. Top graphs (A) show results for Sal. ruber genomes; bottom graphs (B) show E. coli genomes. Note that the ratio is frequently above 1 for genomes sharing between 98.5 and 99.5% ANI (e.g., members of different genomovars of the same phylogroup) for both species and that the estimates above ~99.5% ANI are not reliable due to the inability to detect recombination at this high sequence identity level. A few outlier datapoints (genome pairs) with ratios higher than 100 were also observed in the 98–99.5% ANI range and are due to the high identity of the recombined genes identified (causing the denominator in the r/m ratio to be a small number); the graphs on the right show the majority of datapoints, and thus better represent the average pattern. Also, note that a few E. coli and E. fergusoni genome pairs (left part of the lower graph) show a ratio higher than 1, but this is driven by recombined genes that are localized in a couple of specific regions of the genome and encode specific functions (selection-driven recombination, and not widespread across the genome). See main text for additional details.
Fig. 5
Fig. 5. Fraction of identical genes a genome shares with all other genomes within or between genomovar, phylogroup, and species.
Each genome was compared to all other genomes within each group (AF) and the cumulative fraction of shared identical genes was recorded and plotted using the custom script Allv_RBM_Violinplot.py. The groups were as follows: A genomes within the same genomovar, B genomes in each separate genomovar within the same phylogroup, excluding genomes from the same genomovar, C genomes in each separate genomovar within different phylogroups, D genomes of the other species (S. pepae for Sal. ruber and E. fergusonii for E. coli), E genomes within the same phylogroup excluding genomes from the same genomovar, F genomes within the same species excluding genomes from the same phylogroup. Data are presented in hybrid violin plots where the top and bottom whiskers show the minimum and maximum values, the middle whisker shows the median value, the black boxes show the interquartile range, and the shaded light blue regions show the density of values along the y-axis. The top graph shows results for Sal. ruber genomes; the bottom graph shows E. coli genomes. For Sal. ruber the number of genomes used in each group were, n = 67 for (A), 422 for (B), 897 for (C), 67 for (D), 176 for (E), and 192 for (F). For E. coli, n = 199 for (A), 2213 for (B), 2910 for (C), 425 for (D), 422 for (E), and 433 for (F). The right panel shows a graphical representation for comparisons performed for both graphs on the left. See also Fig. S6 for graphical examples of the underlying data. Note that while one or a few genomes create extreme outliers, overall, the fraction of identical genes gradually decreases among more divergent genomes compared. Also, note that our modeling analysis (red circles on the graph; see “Methods” section for more details) suggests—for example—that only about 6–7% of the total genes in the genome should be expected to be identical among genomes showing around 98.5% ANI if there is no recent recombination (i.e., the b and e groups); both species show many more such genes in one-to-one genomovar (group B) or one-to-many genomovars (group E) at this level, revealing extensive recent gene exchange.

References

    1. Rossello-Mora, R. & Amann, R. Past and future species definitions for Bacteria and Archaea. Syst. Appl. Microbiol.38, 209–216 (2015). - PubMed
    1. Gevers, D. et al. Opinion: re-evaluating prokaryotic species. Nat. Rev. Microbiol.3, 733–739 (2005). - PubMed
    1. Konstantinidis, K. T., Ramette, A. & Tiedje, J. M. The bacterial species definition in the genomic era. Philos. Trans. R. Soc. Lond. B Biol. Sci.361, 1929–1940 (2006). - PMC - PubMed
    1. Konstantinidis, K. T. Sequence‐discrete species for Prokaryotes and other microbes: a historical perspective and pending issues. mLife10.1002/mlf2.12088 (2023). - PMC - PubMed
    1. Caro-Quintero, A. & Konstantinidis, K. T. Bacterial species may exist, metagenomics reveal. Environ. Microbiol.14, 347–355 (2012). - PubMed

Publication types

LinkOut - more resources