. 2024 Nov 15;15(1):9933.
doi: 10.1038/s41467-024-54111-6.

VSV∆M51 drives CD8+ T cell-mediated tumour regression through infection of both cancer and non-cancer cells

Affiliations

VSV∆M51 drives CD8+ T cell-mediated tumour regression through infection of both cancer and non-cancer cells

Jahanara Rajwani et al. Nat Commun. .

Abstract

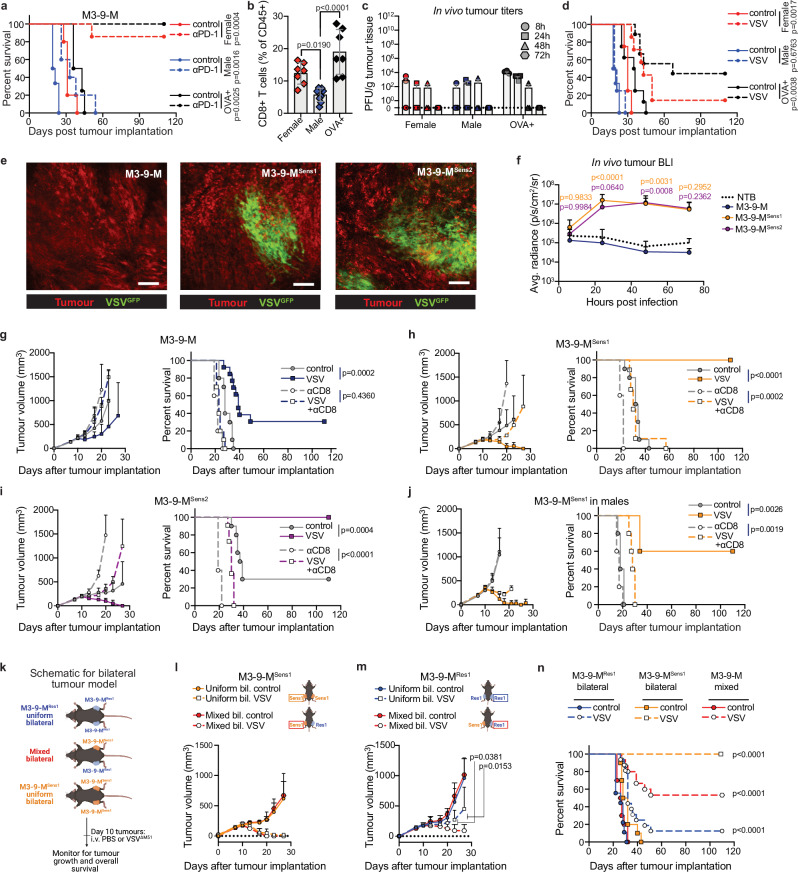
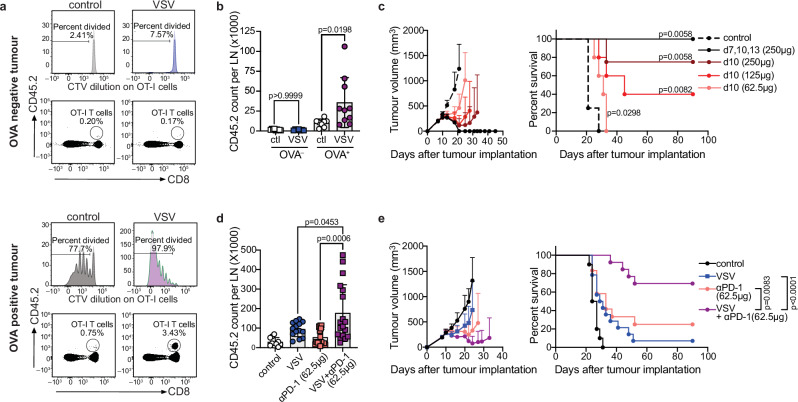
Oncolytic viruses (OV) are designed to selectively infect and kill cancer cells, while simultaneously eliciting antitumour immunity. The mechanism is expected to originate from infected cancer cells. However, recent reports of tumour regression unaccompanied by cancer cell infection suggest a more complex mechanism of action. Here, we engineered vesicular stomatitis virus (VSV)ΔM51-sensitive and VSVΔM51-resistant tumour lines to elucidate the role of OV-infected cancer and non-cancer cells. We found that, while cancer cell infections elicit oncolysis and antitumour immunity as expected, infection of non-cancer cells alone can also contribute to tumour regression. This effect is partly attributed to the systemic production of cytokines that promote dendritic cell (DC) activation, migration and antigen cross-presentation, leading to magnified antitumour CD8+ T cell activation and tumour regression. Such OV-induced antitumour immunity is complementary to PD-1 blockade. Overall, our results reveal mechanistic insights into OV-induced antitumour immunity that can be leveraged to improve OV-based therapeutics.


Conflict of interest statement

Competing interests The authors declare no competing interests.

Figures

Fig. 1
Fig. 1. VSV∆M51 elicits tumour regression in infection-resistant tumours.
a Tumour virus titers post VSV∆M51-GFP (n = 3–7 mice/group, compiled from 1 or 2 independent experiments). b Viral transgene expression in tumours post VSV∆M51-oFluc (n = 3–5 mice/group measured repeatedly over time, except non-tumour bearing (NTB), which had 2–3 mice/group, representative of 2 independent experiments). c Tumour infection 24 h post VSV∆M51-GFP, representative of n = 4 mice/group imaged over 2 independent experiments. Scale bars are 100 µm. d Overall survival of tumour-bearing mice treated with infectious or UV-irradiated VSV∆M51 ± CD8 neutralizing antibodies (αCD8, n = 4–25 mice/group, compiled from 2–3 independent experiments, log-rank Mantel–Cox test). e Infection in F7 tumours 24 h post VSV∆M51-GFP, representative of n = 6 mice imaged over 2 independent experiments. Scale bar is 300 µm. f Viral transgene expression in tumours post VSV∆M51-oFluc ± αCD8 (n = 6 mice/group (CT-26IFNmut + αCD8, F7 + αCD8), n = 7 mice/group (CT-26IFNmut), n = 10 mice/group (F7), n = 3 mice/group (NTB) measured repeatedly over time, representative of 2 independent experiments, two-way ANOVA with Dunnett’s post-test comparing F7 to CT-26IFNmut). g Overall survival of mice bearing F7 tumours post VSV∆M51 ± αCD8 (n = 13 mice/group (control), n = 17 mice/group (VSV), n = 6 mice/group (VSV + αCD8), compiled from 2 independent experiments, log-rank Mantel–Cox test of VSV∆M51 compared to control). h Overall survival of mice bearing infection-resistant M3-9-M tumours post VSV∆M51 (n = 5 mice (M3-9-MRes1 control), n = 4 mice (M3-9-MRes2 control), n = 7 mice (M3-9-MRes1 VSV, M3-9-MRes2 VSV), representative of 2 independent experiments, log-rank Mantel-Cox test). Unless otherwise indicated, VSV∆M51 was delivered i.v. at 5 × 108 PFU. Bars/points at mean ± SD. Source data are provided as a Source Data file. Occasionally n is given as a range as the number of mice in each group varies. Please see the Source Data file for the exact n in each group.
Fig. 2
Fig. 2. Cancer cell infections generate local tumour control and distant abscopal immunity.
a Overall survival of tumour-bearing mice treated with PBS or anti-PD-1 (n = 5 mice/group, except n = 7 mice/group (Female anti-PD-1), n = 6 mice/group (Male control), n = 4 mice/group (OVA+ control), representative of 2 independent experiments, log-rank Mantel-Cox test). b CD8+ T cell frequency in M3-9-M tumours 10 days post-implantation (n = 7 mice/group (Female, OVA + ), n = 9 mice/group (Male), compiled from 2 independent experiments, one-way ANOVA with Tukey’s post-test). c M3-9-M tumour virus titers post VSV∆M51-GFP (n = 3 mice/group, representative of 2 independent experiments). d Overall survival of M3-9-M tumour-bearing mice treated with PBS or VSV∆M51-GFP (n = 4–9 mice/group, compiled from 1 or 2 independent experiments, log-rank Mantel-Cox test). e Tumour infection 24 h post VSV∆M51-GFP, representative of n = 4 mice/group imaged over 2 independent experiments. Scale bars are 100 µm. f Viral transgene expression in tumours post VSV∆M51-oFluc (n = 8–12 mice/group measured repeatedly over time, except NTB, which had 3–6 mice, compiled from 2 independent experiments, two-way ANOVA with Dunnett’s post-test comparing indicated tumours to M3-9-M). gj Tumour growth (left) and overall survival (right) of tumour-bearing mice after treatment with PBS or VSV∆M51 ± αCD8 (left: n = 5 mice/group (except n = 4 mice/group for VSV + αCD8 condition in g), representative of 2 independent experiments; right: n = 5–13 mice/group, compiled from 1–2 independent experiments, log-rank Mantel–Cox test). k Schematic of experiment involving bilateral infection-modulated tumours. l, m Tumour growth of M3-9-MSens1 (l) or M3-9-MRes1 (m) tumours after PBS or VSV∆M51 treatment of mice bearing bilateral tumours (n = 5–16 tumours/group, representative of 2 independent experiments, two-way ANOVA with Tukey’s post-test). n Overall survival of mice bearing bilateral tumours treated with PBS or VSV∆M51 (n = 9–16 mice/group, compiled from 2 independent experiments, log-rank Mantel-Cox test). In all experiment, VSV∆M51 was delivered i.v. at 5 × 108 PFU. Points at mean ± SD. Schematics in Fig. 2k–m were created in BioRender. Lab, M (2024) BioRender.com/m62j741. Source data are provided as a Source Data file. Occasionally n is given as a range as the number of mice in each group varies. Please see the Source Data file for the exact n in each group.
Fig. 3
Fig. 3. Non-cancer cell infections promote DC activation and migration to the TdLN.
a OVA-specific CD8+ T cell count in M3-9-MRes1/OVA tumours 6 days post VSV∆M51 (n = 10 mice/group (control), n = 11 mice/group (VSV), compiled from 2 independent experiments, two-tailed, unpaired t test). b Overall survival of M3-9-MRes1-bearing mice treated with PBS/VSV∆M51 ± FTY-720 (n = 17-22 mice/group, compiled from 3 independent experiments, log-rank Mantel-Cox test). c Tumour growth of mice in b (n = 5 mice/group (control), n = 6 mice/group (VSV), representative of 3 independent experiments). d Frequency of total DCs (left) and CD103+ DCs (right) of CD45+ cells in the TdLN of M3-9-MRes1-bearing mice 24 h post PBS/VSV∆M51 (n = 14 mice/group (control), n = 23 mice/group (VSV), compiled from 4 independent experiments, two-tailed, unpaired t test). e Expression of CD80 (left) and CD86 (right) on TdLN DCs of mice treated as in d (n = 3–5 mice/group, representative of 4 independent experiments, multiple two-tailed unpaired t tests with Holm-Sidak post-test). fh Count (f) and expression of CD80 (g; left), CD86 (g; right) or CCR7 (h) on DCs in tumours of mice treated as in d (for f, h: n = 7–10 mice/group, compiled from 2 independent experiments; for g: n = 3–5 mice/group, representative of 2 independent experiments; two-tailed, unpaired t test). i, j Count of mCherry+ total DCs (left) and mCherry+CD103+ DCs (right) in TdLNs (i) or tumours (j) of M3-9-MRes1/mCherry-bearing mice 24 h post PBS/VSV∆M51 (n = 6–13 mice/group, compiled from 2 independent experiments, two-tailed, unpaired t test). k Tumour growth (left) and overall survival (right) of M3-9-MRes1-bearing C57BL/6 or Batf3−/− mice post VSV∆M51 (left: n = 3–6 mice/group, representative of 2 independent experiments; right: n = 6–12 mice/group, compiled from 2 independent experiments, log-rank Mantel-Cox test). In all experiment, VSV∆M51 was delivered i.v. at 5 × 108 PFU. Points/bars at mean ± SD. Occasionally n is given as a range as the number of mice in each group varies. Please see the Source Data file for the exact n in each group.
Fig. 4
Fig. 4. Non-cancer cell infections enhance activation of antitumour CD8+ T cells.
a Representative flow cytometry plots of CTV dilution (top) and OT-I frequency among CD45+ cells (bottom) in TdLNs of M3-9-MRes1- or M3-9-MRes1/OVA-bearing mice after transfer of OT-I cells ± VSV∆M51. b Count of OT-I cells in TdLNs of mice treated as in a (n = 7–10 mice/group, compiled from three independent experiments, one-way ANOVA with Tukey’s post-test). c Tumour growth (left) and overall survival (right) of M3-9-MRes1-bearing mice treated with anti-PD-1 (n = 4 mice/group except n = 5 mice/group (d10 (125 µg), d10 (62.5 µg)), representative of 2 independent experiments, log-rank Mantel-Cox test on overall survival). d OT-I cell count in TdLNs of M3-9-MRes1/OVA-bearing mice, post OT-I transfer and VSV∆M51 and/or anti-PD-1 treatment (62.5 µg on day 10) (n = 10–18 mice/group, compiled from 3 independent experiments, one-way ANOVA with Tukey’s post-test). e Tumour growth (left) and overall survival (right) of M3-9-MRes1-bearing mice treated as in d (left: n = 5 mice/group (control, αPD-1 (62.5 µg)), n = 7 mice/group (VSV, VSV + αPD-1 (62.5 µg)); right: n = 10–14 mice/group, compiled from 2 independent experiments, log-rank Mantel-Cox test). In all experiment, VSV∆M51 was delivered i.v. at 5 × 108 PFU. Points/bars at mean ± SD. Occasionally n is given as a range as the number of mice in each group varies. Please see the Source Data file for the exact n in each group.
Fig. 5
Fig. 5. VSVM51 infection of the TdLN promotes DC activation.
a Schematic of FITC painting technique. b Frequency of FITC+ DCs (left) and FITC+CD103+ DCs (right) in the iLN after FITC painting depicted in a (n = 7 mice/group, compiled from three independent experiments, two-tailed, unpaired t test). c, d Expression of CD80 (c) and CD86 (d) on FITC+ DCs (left) and FITC+CD103+ DCs (right) in the iLN after FITC painting depicted in a (n = 5 mice/group, compiled from 2 independent experiments, two-tailed, unpaired t test). e Schematic of afferent lymphatic suture experiment. f Representative ex vivo images (left) and virus titers (right) in the popliteal LN after lymphatic suture and VSV∆M51-GFP delivery (5 × 108−1 × 109 PFU delivered i.v.) (left: scale at 300 µm; right: n = 8 mice/group (sham), n = 9 mice/group (suture), compiled from 2 independent experiments, two-tailed, unpaired t test). g Frequency of total FITC+ DCs (left) and FITC+CD103+ DCs (right) in the iLN of FITC painted mice 24 h post VSV∆M51 (n = 6–9 mice/group, compiled from 3 independent experiments, one-way ANOVA with Dunnett’s post-test). h, i Expression of CD80 (h) or CD86 (i) on total FITC+ DCs (left) and FITC+CD103+ DCs (right) in the iLN of mice treated as in g (n = 4 mice/group except n = 3 mice/group (control, i.v.), representative of 3 independent experiments, one-way ANOVA with Dunnett’s post-test). j Overall survival of M3-9-MRes1-bearing mice post VSV∆M51 (n = 5 mice/group except n = 4 mice/group (control), log-rank Mantel–Cox test between treatment groups and control). Unless otherwise indicated, VSV∆M51 was delivered i.v. at 5 × 108 PFU. Bars at mean ± SD. For each subfigure showing data for both CD11c+ cells and CD103+ cells, the same samples were used to measure CD11c and CD103. Schematics in a and e were created in BioRender. Lab, M (2024) BioRender.com/m62j741. Source data are provided as a Source Data file. Occasionally n is given as a range as the number of mice in each group varies. Please see the Source Data file for the exact n in each group.
Fig. 6
Fig. 6. Serum factors produced by non-cancer cell infections promote DC migration, activation, and antigen cross-presentation.
ac Frequency (a) and expression of CD80 (b) and CD86 (c) on total FITC+ DCs (left) and FITC+CD103+ DCs (right) in the iLN of FITC painted mice 24 h post VSV∆M51 ± neutralizing antibodies against TNF (αTNF), IFNAR1 (αIFNAR1), or both (n = 5–9 mice/group, compiled from 2 independent experiments, one-way ANOVA with Tukey’s post-test). df Count (d) and expression of CD80 (e) and CD86 (f) on mCherry+ total DCs (left) and mCherry+CD103+ DCs (right) in the TdLN of M3-9-MRes1/mCherry-bearing mice 24 h post VSV∆M51 ± αTNF, αIFNAR1, or both (n = 8 mice/group except n = 7 mice/group (control), compiled from 2 independent experiments, one-way ANOVA with Tukey’s post-test). g, h Assay measuring ability of MuTuDCs to present soluble OVA (g) or OVA257-264 peptide (h) to B3Z cells after pre-treatment with control or VSV∆M51-conditioned serum (n = 3 wells/condition, representative of 2 (h) or 3 (g) independent experiments, two-way ANOVA with Sidak’s post-test on last data-point). i Representative images (left) and quantification (middle, right) of galectin-3 puncta in MuTuDCs treated for 24 h under indicated conditions (middle: n = 30 fields of view, compiled from 3 independent experiments, two-tailed, unpaired t test; right: n = 10 fields of view, one-way ANOVA with Dunnett’s post-test). j Frequency (left) and count (right) of OT-I cells in the TdLN of M3-9-MRes1/OVA-bearing mice, post OT-I cell transfer and treatment with VSV∆M51 ± αTNF, αIFNAR1, or both (n = 7 mice/group (control), n = 8 mice/group (VSV), n = 10 mice/group (VSV + αTNF, VSV + αIFNAR1, VSV + αTNF/αIFNAR1), compiled from 2 independent experiments, one-way ANOVA with Dunnett’s post-test). k (left) Merged overall survival of M3-9-MRes1-bearing mice treated with PBS or VSV∆M51 ± αTNF, αIFNAR1, or both (n = 15 mice/group (control, VSV + αTNF + αIFNAR1), n = 16 mice/group (VSV + αIFNAR1), n = 18 mice/group (VSV + αTNF), n = 19 mice/group (VSV), compiled from 3 independent experiments, log-rank Mantel-Cox test between indicated groups); (right) Graphs depicting same data but with only PBS, VSV∆M51 and indicated neutralizing antibody group. l Overall survival of M3-9-MRes1-bearing mice treated with mTNF, mIFNβ, or both (n = 5 mice/group, log-rank Mantel-Cox test between indicated groups). In all experiment, VSV∆M51 was delivered i.v. at 5 × 108 PFU. Points/bars at mean ± SD. For each subfigure showing data for both CD11c+ cells and CD103+ cells, the same samples were used to measure CD11c and CD103. Source data are provided as a Source Data file. Occasionally n is given as a range as the number of mice in each group varies. Please see the Source Data file for the exact n in each group.
Fig. 7
Fig. 7. Splenic infections produce type I IFNs and contribute to VSV∆M51-induced antitumour immunity.
a Ex vivo image of spleen 6 h post VSV∆M51-GFP, representative of n = 6 mice imaged over 2 independent experiments. Scale bars are 200 µm. b Virus titers in spleen or serum at indicated time points post VSV∆M51-GFP (n = 3 mice/group.) c Levels of TNF and IFNs in serum 6 h after mice received PBS or VSV∆M51-GFP, followed by sham or splenectomy surgery (n = 4 mice/group (ctl PBS, ctl VSV), n = 5 mice/group (splen. VSV), n = 6 mice/group (sham PBS, sham VSV, splen. PBS), compiled from 2 independent experiments, multiple two-tailed, unpaired t tests between sham VSV and splen. VSV groups, with Holm-Sidak post-test). d Schematic of FITC painting technique with PBS (P) or VSV∆M51 (V) treatment followed by sham or splenectomy surgeries. e, f Frequency (e) or expression of CD80 and CD86 (f) on FITC+ DCs (left) and FITC+CD103+ DCs (right) in the iLN of mice treated as in d (n = 4 mice/group (control P, control V), n = 7 mice/group (sham P), n = 8 mice/group (sham V, splen. P, splen. V), where the same samples were used to measure both FITC+CD11c+ DCs and FITC+CD103+ DCs, compiled from 2 independent experiments, one-way ANOVA with Tukey’s post-test). g Schematic to determine the contribution of splenic infections to tumour regression. h Tumour growth (left) and overall survival (right) of M3-9-MRes1-bearing mice treated with PBS or VSV∆M51, followed by no surgery (top), sham surgery (middle) or splenectomy surgery (bottom) (left: n = 5 mice/group except n = 6 mice/group (no surgery VSV), representative of 2 independent experiments; right: n = 10 mice/group (no surgery PBS, sham surgery PBS, splenectomy surgery PBS, splenectomy surgery VSV), n = 11 mice/group (sham surgery VSV), n = 12 mice/group (no surgery VSV), compiled from 2 independent experiments, log-rank Mantel-Cox test). In all experiment, VSV∆M51 was delivered i.v. at 5 × 108 PFU. Points/bars at mean ± SD. Schematics in d and g were created in BioRender. Lab, M (2024) BioRender.com/m62j741. Source data are provided as a Source Data file. Occasionally n is given as a range as the number of mice in each group varies. Please see the Source Data file for the exact n in each group.
Fig. 8
Fig. 8. Type I IFN and TNF induce costimulatory marker expression on DCs in human tumours.
a Schematic of experiment using human head and neck tumour samples. b Frequency of total DCs (left) and CD141+ DCs (right) in human tumors treated for 24 h ex vivo with media or hTNF/hIFNβ (20 ng/mL hTNF and 50 ng/mL hIFNβ) (n = 4 patient tumours per condition, compiled from 4 independent experiments, two-tailed, paired t test). ce Expression of HLA-ABC (c), CD80 (d) and CD86 (e) on total DCs and CD141+ DCs 24 h post treatment with media or hTNF/hIFNβ (n = 4 patient tumours per condition, compiled from 4 independent experiments, two-tailed, paired t test). For each treatment condition, the same four samples were used to measure frequency of DCs and expression of HLA-ABC, CD80 and CD86. Schematic in a was created in BioRender. Lab, M (2024) BioRender.com/m62j741. Source data are provided as a Source Data file.

References

    1. Lichty, B. D., Breitbach, C. J., Stojdl, D. F. & Bell, J. C. Going viral with cancer immunotherapy. Nat. Rev. Cancer14, 559–567 (2014). - PubMed
    1. Russell, S. J., Peng, K.-W. & Bell, J. C. Oncolytic virotherapy. Nat. Biotechnol.30, 658–670 (2012). - PMC - PubMed
    1. Liang, M. Oncorine, the world first oncolytic virus medicine and its update in China. Curr. Cancer Drug Targets18, 171–176 (2018). - PubMed
    1. Andtbacka, R. H. I. et al. Talimogene laherparepvec improves durable response rate in patients with advanced melanoma. J. Clin. Oncol.33, 2780–2788 (2015). - PubMed
    1. Todo, T. et al. Intratumoral oncolytic herpes virus G47∆ for residual or recurrent glioblastoma: a phase 2 trial. Nat. Med.28, 1630–1639 (2022). - PMC - PubMed

Publication types

MeSH terms

LinkOut - more resources