. 2024 Nov 15;15(1):9932.
doi: 10.1038/s41467-024-53971-2.

scPair: Boosting single cell multimodal analysis by leveraging implicit feature selection and single cell atlases

Affiliations

scPair: Boosting single cell multimodal analysis by leveraging implicit feature selection and single cell atlases

Hongru Hu et al. Nat Commun. .

Abstract

Multimodal single-cell assays profile multiple sets of features in the same cells and are widely used for identifying and mapping cell states between chromatin and mRNA and linking regulatory elements to target genes. However, the high dimensionality of input features and shallow sequencing depth compared to unimodal assays pose challenges in data analysis. Here we present scPair, a multimodal single-cell data framework that overcomes these challenges by employing an implicit feature selection approach. scPair uses dual encoder-decoder structures trained on paired data to align cell states across modalities and predict features from one modality to another. We demonstrate that scPair outperforms existing methods in accuracy and execution time, and facilitates downstream tasks such as trajectory inference. We further show scPair can augment smaller multimodal datasets with larger unimodal atlases to increase statistical power to identify groups of transcription factors active during different stages of neural differentiation.


Conflict of interest statement

Competing interests The authors declare no competing interests.

Figures

Fig. 1
Fig. 1. Overview of the scPair framework for single cell multimodal analysis.
a scPair uses dual feedforward neural networks to predict each modality from the other. The last hidden layer of each network encodes a modality-specific cell state space, and the bidirectional networks learn mappings between the modality-specific state spaces. (Cartoons of the single cell and assays were created with BioRender.com: Created in BioRender. Hu, H. (2024) BioRender.com/r97r180). b We use UMAP to visualize modality-specific cell state spaces learned by scPair. In this figure, the data is from the sci-CAR multimodal cell line dataset, where cells are colored by the cell type labels from the original study. Lines connect the modality-specific states of the same cell. c A visualization of the bidirectional map trained by scPair. Given a multimodal single cell sample, scPair is in part evaluated based on how well it can predict the ground truth (measured) ATAC cell state (bottom), given only the RNA profile to predict the ATAC state of a cell (top). Lines connect each cell’s predicted ATAC cell state to its ground truth ATAC cell state; vertical lines indicate high prediction accuracy. d Same as (c), but visualizing the ground truth (measured) RNA cell state (bottom) and the predicted RNA state from ATAC (top). Source data are provided as a Source Data file.
Fig. 2
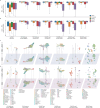
Fig. 2. scPair robustly aligns single cell multiomic data modalities.
a Benchmark of RNA→ATAC mapping performance of scPair and other single cell multiomic methods. All methods were provided with the same training and held-out data sets for evaluation. Box plots compare the mapping performance as measured by the Fraction Of Samples Closer Than the True Match metric (1-FOSCTTM), where larger values indicate better performance. In the box plots, the minima, maxima, centerline, bounds of box, and whiskers represent the minimum value in the data, maximum, median, upper and lower quartiles, and 1.5x interquartile range, respectively. b Same as (a), except measuring ATAC→RNA performance of all methods. c UMAP visualizations of the ATAC (ground truth) and RNA→ATAC (predicted) cell state spaces learned by scPair on single cell multiomic datasets. Each point represents a single cell, and lines connect each cell’s measured ATAC and predicted ATAC (via mapping RNA→ATAC) cell states. Colors correspond to cell type labels from the original studies,,– (datasets from left to right: 10X Genomics scMultiome human PBMCs, 10X Genomics scMultiome mouse brain, SHARE-seq mouse skin, and multi-species SNARE-seq cortex datasets). d Same as (a), but visualizing the RNA (ground truth) and ATAC→RNA (predicted) cell states learned by scPair. Source data are provided as a Source Data file.
Fig. 3
Fig. 3. Prediction of individual data features from the other data modality.
a The ranking of RNA expression prediction accuracy, measured as Pearson correlation, across held-out data from seven datasets. Yellow stars indicate the best performing methods. b Same as (a), except the ranking of ATAC opening prediction accuracy, measured as area under the Receiver Operating Characteristic curve (auROC). c Held-out ground truth RNA expression from each cell type from the SNARE-seq multimodal adult mouse cortex dataset. Rows are differentially expressed genes and columns are cells clustered by type. d Predicted RNA expression based on the held-out ATAC profiles from the SNARE-seq multimodal adult mouse cortex dataset. Rows are differentially expressed genes and columns are cells clustered by type, in the same order as (c). e UMAP of scPair’s predicted ATAC cell state space (based solely on the RNA measurement of held-out samples), where cells are colored by cell types that have been defined in the SNARE-seq multimodal adult mouse cortex dataset. f Aggregated held-out ground truth accessibility tracks for the example marker peaks, which are identified as those that differ between cortical layer 2-3 (E2Rasgrf2, E3Rorb) and layer 5-6 (E5Sulf1, E6Tie4) excitatory neurons, within each corresponding cell type shown in (e). g UMAPs showing the predicted accessibility of peaks in (f), based on held-out RNA profiles. Color indicates opening probability. Source data are provided as a Source Data file.
Fig. 4
Fig. 4. Inference of developmental trajectories in ATAC space.
a UMAP visualizations of cell state spaces learned from RNA (top) and ATAC (bottom) by various methods on the neonatal mouse cortex SNARE-seq data. Colors indicate cell types as defined in the original study. Below, a diagram indicating the expected linear developmental trajectory. b Swarm plots illustrate the individual pseudotimes assigned to each cell of each cell type, which are inferred using the cell state spaces learned by MultiVI (left) and scPair (right). The order of cell type on the y-axis (from top to bottom) follows the developmental path observed in the original study. * represents significance (p-value < 0.05) using a two-sided t-test, and n.s. represents non-significance. c Heatmaps of developmental state marker expression along pseudotime (x-axis) inferred from the MultiVI (left) and scPair (right) ATAC spaces. Gene order on the y-axis follows the expected order of expression according to maturation time from the original study. Source data are provided as a Source Data file.
Fig. 5
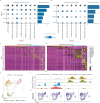
Fig. 5. Augmenting multiomic analysis with unimodal datasets enhances coverage of transient states in trajectory inference.
a-b UMAP visualizations of the ATAC cell state spaces learned by scPair, with 2,141 10x scMultiome cells used to train scPair (a), or with the 14,605 unimodal scATAC-seq cells (b). Cells are colored based on estimated pseudotime trajectories via Palantir, with labels (R, B1, B2, B3) indicating the trajectory root and branch terminals. Arrows mark the initial fork points. c UMAP visualizations of unimodal scATAC-seq cell state learned by scPair, each corresponding to the predicted expression pattern of specific marker genes: Fabp7 (starting pluripotent state), Maf, Zic1, and Ebf1 (markers of branch 1, 2 and 3, respectively). d Line plots show RNA expression predicted by scPair from the unimodal scATAC-seq data for the four markers from (c), as a function of pseudotime. Error bands represent one standard deviation. e Heatmaps compare chromatin accessibility patterns along inferred pseudotime (x-axis) for each branch in the trajectory, using the 2,141 10x scMultiome cells (top) versus the 14,605 unimodal scATAC-seq cells (bottom). Rows represent features (peaks), and columns represent 0.05 pseudotime intervals. In each heatmap, the order of rows from top to bottom is based on “feature pseudotime” (Methods) in ascending order. f Same as (d), except comparing measured RNA expression from the 10x scMultiome cells (top) and predicted RNA expression by scPair using the unimodal scATAC-seq cells (bottom). g Pseudotime-specific enrichments of transcription factor binding motifs along trajectory. Motifs found to be enriched in accessible regions of transient states were categorized as either (1) enriched in the trajectory trunk; (2) enriched in both trunk and projection neuron precursor branches; (3) mainly in branch 1 corresponding to interneuron precursors; and (4) projection neuron precursor branches only (branches 2 and 3). Example motifs were selected for visualization for each of the four categories. h Heatmap displays motif enrichment along trajectory, with vertical arrows marking the fork and branch terminals indicated in (b). Rows represent the enriched motifs and columns represent pseudotime. Source data are provided as a Source Data file.
Fig. 6
Fig. 6. Unimodal datasets help improve cell state inference in multimodal datasets by refining feature covariance estimation.
a UMAP visualizations comparing the accuracy of RNA→ATAC cell state space mapping by scPair, trained with (i) only the multimodal data, and (ii) after updating the scPair RNA encoding networks using a unimodal scRNA-seq atlas dataset. Each point represents a single cell, with lines connecting each cell’s learned ATAC cell state and mapped RNA→ATAC cell state. Colors correspond to cell type labels from the original study. More vertical lines indicate better mapping performance. b Box plots quantifying the improvement in cross-modality cell state mapping (left: RNA→ATAC mapping; right: ATAC→RNA mapping) after incorporating unimodal datasets into the scPair (blue) and StabMap (orange) frameworks. Higher (1- FOSCTTM) values indicate improved mapping performance. P-values from two-sided paired Wilcoxon tests indicate the significance of the improvements in cell state mapping/alignment for each method. In the box plots, the minima, maxima, centerline, bounds of box, and whiskers represent the minimum value in the data, maximum, median, upper and lower quartiles, and 1.5x interquartile range, respectively. c Bar plot indicating the difference in prediction performance (Pearson correlation coefficient) between the scPairstandard framework using only bimodal Patch-seq data (blue) and the updated scPairaugment framework incorporating a unimodal scRNA-seq atlas dataset (orange). Higher correlation demonstrates improved prediction performance. Source data are provided as a Source Data file.

References

    1. Kolodziejczyk, A. A., Kim, J. K., Svensson, V., Marioni, J. C. & Teichmann, S. A. The technology and biology of single-cell RNA sequencing. Mol. Cell58, 610–620 (2015). - PubMed
    1. Ziegenhain, C. et al. Comparative analysis of single-cell RNA sequencing methods. Mol. Cell65, 631–643.e4 (2017). - PubMed
    1. Pott, S. & Lieb, J. D. Single-cell ATAC-seq: strength in numbers. Genome Biol.16, 172 (2015). - PMC - PubMed
    1. Karemaker, I. D. & Vermeulen, M. Single-cell DNA methylation profiling: technologies and biological applications. Trends Biotechnol.36, 952–965 (2018). - PubMed
    1. Clark, S. J. et al. Genome-wide base-resolution mapping of DNA methylation in single cells using single-cell bisulfite sequencing (scBS-seq). Nat. Protoc.12, 534–547 (2017). - PubMed

Publication types

Associated data