. 2024 Nov 15;15(1):9909.
doi: 10.1038/s41467-024-54400-0.

High mobility group A1 (HMGA1) promotes the tumorigenesis of colorectal cancer by increasing lipid synthesis

Affiliations

High mobility group A1 (HMGA1) promotes the tumorigenesis of colorectal cancer by increasing lipid synthesis

Yuan Zhao et al. Nat Commun. .

Abstract

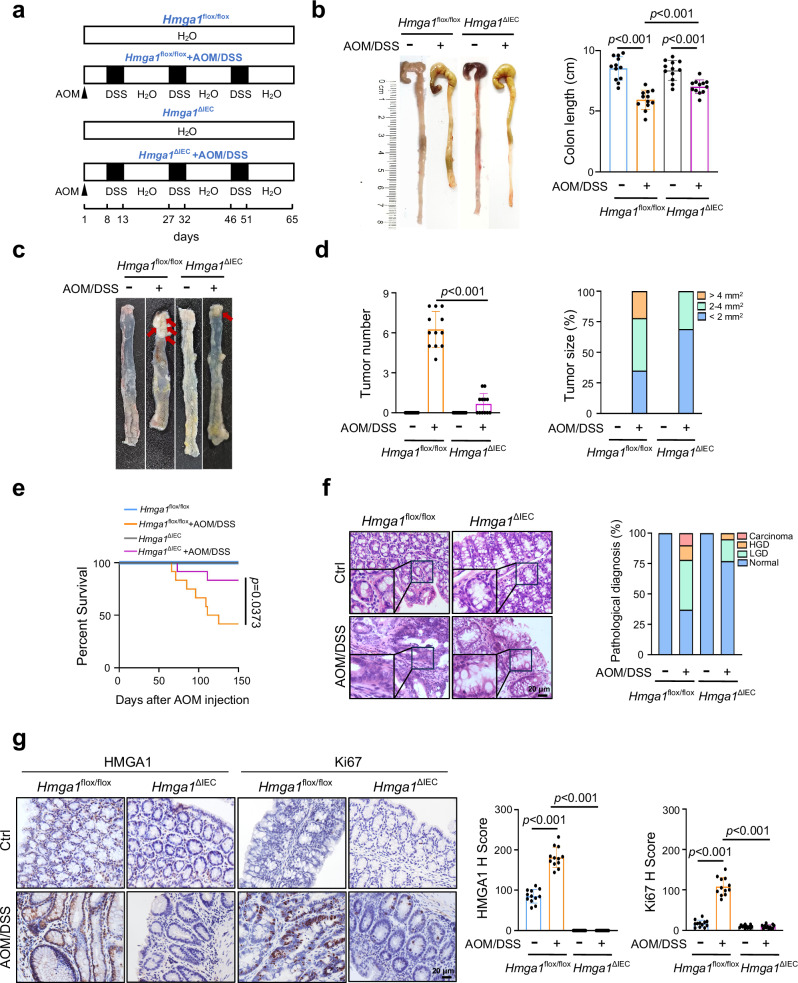
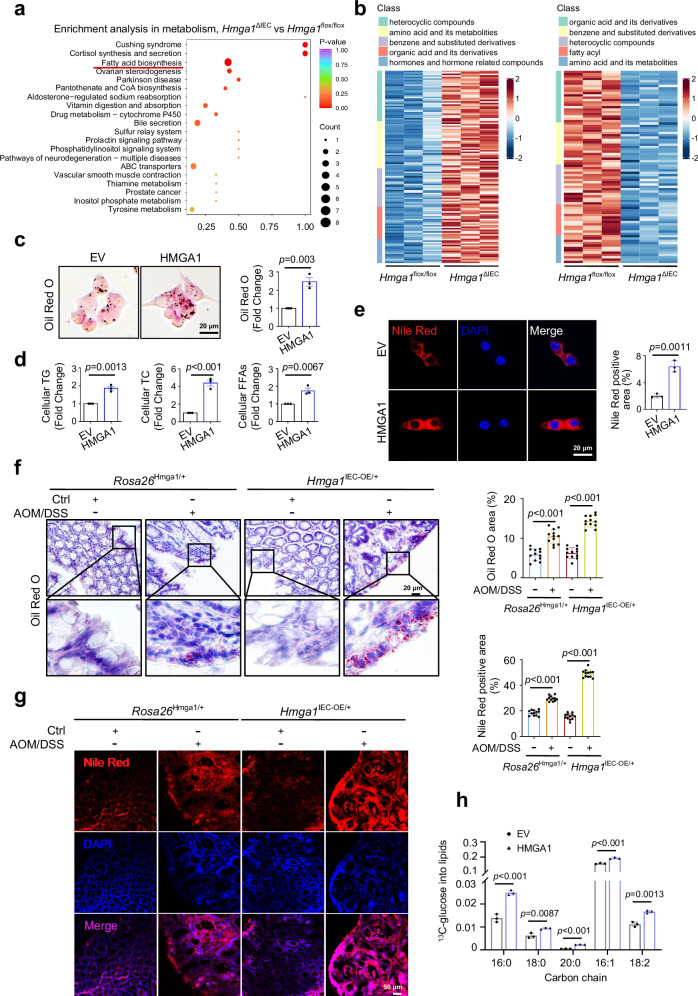
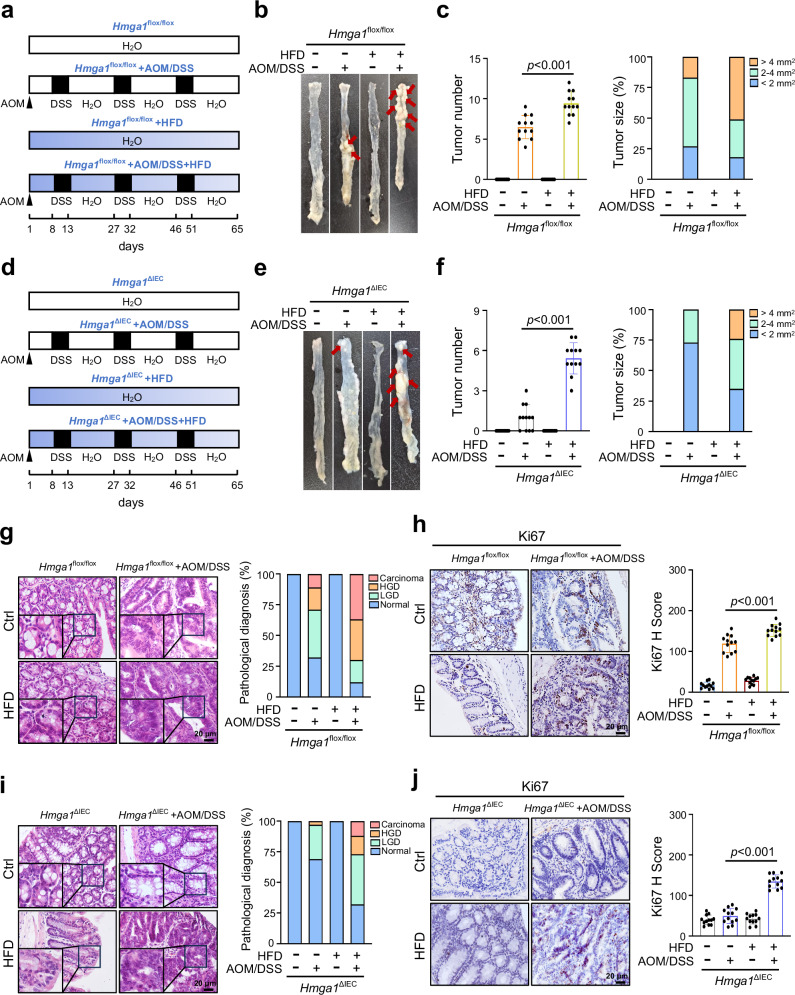
Metabolic reprogramming is a hallmark of cancer, enabling tumor cells to meet the high energy and biosynthetic demands required for their proliferation. High mobility group A1 (HMGA1) is a structural transcription factor and frequently overexpressed in human colorectal cancer (CRC). Here, we show that HMGA1 promotes CRC progression by driving lipid synthesis in a AOM/DSS-induced CRC mouse model. Using conditional knockout (Hmga1△IEC) and knock-in (Hmga1IEC-OE/+) mouse models, we demonstrate that HMGA1 enhances CRC cell proliferation and accelerates tumor development by upregulating fatty acid synthase (FASN). Mechanistically, HMGA1 increases the transcriptional activity of sterol regulatory element-binding protein 1 (SREBP1) on the FASN promoter, leading to increased lipid accumulation in intestinal epithelial cells. Moreover, a high-fat diet exacerbates CRC progression in Hmga1△IEC mice, while pharmacological inhibition of FASN by orlistat reduces tumor growth in Hmga1IEC-OE/+ mice. Our findings suggest that targeting lipid metabolism could offer a promising therapeutic strategy for CRC.


Conflict of interest statement

Competing interests The authors declare no conflict of interest.

Figures

Fig. 1
Fig. 1. HMGA1 is highly expressed in CRC.
a Relative expression of HMGA1 in various cancers from GEPIA database. N, Normal; T, Tumor. b, c Relative expression of HMGA1 in human CRC from GEPIA and GEO database. N = 349, T = 275 in (b) and N = 98, T = 98 in (c). (c) In normal group, the box plots showed minima (2.4625), maxima (5.2734), center (3.26415), lower bound (3.1050), upper bound (3.9518). Whiskers showed minima to maxima. d Relative expression of HMGA1 in different stages of carcinogenesis of human colorectum from GEO database. Normal (n = 12), low-grade dyplasia (n = 21), high-grade dyplasia (n = 30) and adenocarcinoma (n = 25). e Survival curve of patients with or without HMGA1 elevation. Patients’ data from the Study of Colorectal Adenocarcinoma (TCGA, PanCancer Atlas) with 594 patients were analyzed. The level of HMGA1 mRNA above the average + S.D. was defined as ‘high HMGA1’ (HMGA1: EXP > 1 as a search definition). p = 0.0221 with the log-rank test for the survival rate. f, g The analysis of HMGA1 level in CRC scRNA-seq dataset #GSE201348 from GEO database. T-distributed stochastic neighbor embedding (t-SNE) plot of ten main cell types identified in 5 CRC lesions and 5 normal control tissues (f). Dotplot represented the average level and the percentage of HMGA1 expression in different cell types in tumor and normal colorectal tissues of CRC patients (g). h, i Representative IHC staining of HMGA1 (h) and quantitative analysis of HMGA1 positive cells per crypt (i) in human colorectal (CRC) tissues. Data are presented as mean ± SD (c, d, i). Statistical significance was determined by two-tailed unpaired t-test (d) or two-tailed paired t-test (c, i). GEPIA: Gene Expression Profiling Interactive Analysis; GEO: Gene Expression Omnibus; scRNA-seq: single cell RNA-seq. Source data are provided as a Source Data file.
Fig. 2
Fig. 2. HMGA1 promotes the occurrence and development of CRC.
a Schematic diagram of AOM/DSS induction in Rosa26Hmga1/+ and Hmga1IEC-OE/+ mice. b Representative macroscopic views of colorectum from control and CRC mice. The colorectal length of mouse was measured. c Representative images of CRC. d The number and size of tumors in the entire colorectum per mouse were measured. e Survival curve of the Rosa26Hmga1/+ (control) mice and the Hmga1IEC-OE/+ mice with the induction of CRC. f HE staining of murine colorectum from AOM/DSS-induced Rosa26Hmga1/+ and Hmga1IEC-OE/+ mice (Scale bar = 20 μm. Representative images from 3 independent experiments). Percentages of LGD, HGD, and carcinoma in the tissues were determined. g Representative images of IHC staining for HMGA1 and Ki67 in normal colorectum and CRC (Scale bar =  20 μm). Data are presented as mean ± SD. Statistical significance was determined by two-tailed unpaired t-test (b, d, g) or log-rank test (e). n = 12. LGD: low-grade dysplasia; HGD: high-grade dysplasia; AOM: azoxymethane; DSS: dextran sulfate sodium. Source data are provided as a Source Data file.
Fig. 3
Fig. 3. Deletion of HMGA1 inhibits the occurrence and development of CRC.
a Schematic diagram of AOM/DSS induction in Hmga1flox/flox and Hmga1△IEC mice. b Representative macroscopic views of colorectum from control and CRC mice. The colorectal length of mouse was measured. c Representative images of CRC. d The number and size of tumors in the entire colorectum per mouse were measured. e Survival curve of the Hmga1flox/flox (control) and Hmga1△IEC mice with the induction of CRC. f HE staining of colorectum from control and AOM/DSS-induced Hmga1flox/flox and Hmga1△IEC mice (Scale bar = 20 μm. Representative images from 3 independent experiments). Percentages of LGD, HGD, and carcinoma in the tissues were determined. g Representative images of IHC staining for HMGA1 and Ki67 in normal colorectum and CRC (Scale bar = 20 μm). Data are presented as mean ± SD. Statistical significance was determined by two-tailed unpaired t-test (b, d, g) or log-rank test (e). n = 12. LGD: low-grade dysplasia; HGD: high-grade dysplasia. Source data are provided as a Source Data file.
Fig. 4
Fig. 4. HMGA1 promotes lipid accumulation.
a Pathway analysis of differentially enriched metabolites in IECs from Hmga1flox/flox mice as compared with those in IECs from Hmga1△IEC mice. b Untargeted metabolomics was used to identify metabolites in IECs from Hmga1△IEC and Hmga1flox/flox mice. The heatmaps showed significantly up-regulated metabolites (left panel) and down-regulated metabolites (right panel) in IECs from Hmga1△IEC mice. c Neutral lipids was assessed by oil red O staining in HMGA1-overexpressed HT-29 cells (Scale bar = 20 μm). d The relative levels of triglycerides, total cholesterol, and free fatty acids in HMGA1-overexpressed HT-29 cells. e Nile red staining of HMGA1-overexpressed HT-29 cells (Scale bar = 20 μm). n = 3. f, g Lipogenesis in the colorectum (CRC) from control and AOM/DSS-induced Rosa26Hmga1/+ and Hmga1IEC-OE/+ mice was determined by oil red O staining (f) (Scale bar = 20 μm) and nile red staining (g) (Scale bar = 50 μm) using frozen sections. n = 12. h HMGA1 overexpression and control HT-29 cells were cultured in glucose free DMEM in the presence of [U-13C] glucose (2 g/L) for 6 h. Saturated and monounsaturated FFAs labeled by 13C were analyzed using UHPLC-QTOF-MS-based nontargeted metabolomics. Data are presented as mean ± SD. Statistical significance was determined by two-tailed unpaired t-test (d, e, f, h) or hypergeometric test (a). Representative data from 3 independent experiments. IECs: intestinal epithelial cells. Source data are provided as a Source Data file.
Fig. 5
Fig. 5. HMGA1 upregulates FASN in CRC.
a Differentially expressed genes in lipid metabolism in HMGA1-knockdown CRC cells compared with control CRC cells from RNA-seq. b GSEA plot of fatty acid synthesis genes identified in RNA-seq in HMGA1-silenced HT-29 cells. NES, normalized enrichment score. c Saturated and monounsaturated FFAs with 13C-labeled in control and HMGA1-overexpressed cells treated with orlistat. Control and HMGA1-overexpressed HT29 cells were treated with 20 µM orlistat for 18 h. Cell culture medium was then replaced with glucose free DMEM in the presence of [U-13C] glucose (2 g/L) and orlistat for 6 h. Each dot represents a sample (n  =  3). d The samples derive from the same experiment but different gels for HMGA1, FASN, another for CPT1A and another for β-actin were processed in parallel. β-actin served as loading control (The quantification provided under the blots is for the representative blot from 3 independent experiments). e The correlation between HMGA1 and FASN in CRC patients from the TCGA database. f Representative IHC staining of HMGA1 and FASN in human colorectal and CRC tissues (Scale bar = 20 μm). g Representative images of IHC staining for FASN in the coloretum (CRC) from Rosa26Hmga1/+ and Hmga1IEC-OE/+ mice induced with or without AOM/DSS (Scale bar = 20 μm) (n = 12 mice per group). h Representative images of IHC staining for FASN in the colorectum (CRC) from Hmga1flox/flox and Hmga1△IEC mice induced with or without AOM/DSS (Scale bar = 20 μm) (n = 12 mice per group). Data are presented as mean ± SD. Statistical significance was determined by two-tailed unpaired t-test (c, d, g, h), two-tailed paired t-test (f), permutation test (b), or Pearson correlation coefficient (e). GSEA: gene set enrichment analysis, TCGA: The Cancer Genome Atlas. Source data are provided as a Source Data file.
Fig. 6
Fig. 6. HMGA1 promotes the transcription of FASN by enhancing the activity of SREBP1.
a Co-IP assay to detect the interaction between HMGA1 and FASN. b IGV plots of ATAC-seq peaks at the FASN locus in HMGA1 silencing and control CRC cells. Boxed is the TSS site. c, d Luciferase reporter assay to detect the effect of HMGA1 silencing (c) or overexpression (d) on the luciferase activity of the FASN promoter in CRC cells. e Correlation between FASN and SREBP1 in CRC patients from the TCGA database. f The samples derive from the same experiment but different gels for HMGA1, SREBP1, and another for β-actin were processed in parallel. β-actin served as loading control (The quantification provided under the blots is for the representative blot from 3 independent experiments). g Co-IP assay to detect the interaction between HMGA1 and SREBP1. The samples derive from the same experiment but different gels for HMGA1, and another for SREBP1 were processed in parallel (The quantification provided under the blots is for the representative blot from 3 independent experiments). h Immunofluorescence detection of HMGA1 and SREBP1 in CRC cells (Scale bar = 10 μm). i Luciferase reporter assay to detect the effect of SREBP1- overexpression or silencing on FASN transcription in HT-29 cells with or without HMGA1 knockdown. j Luciferase reporter assay to detect the effect of SREBP1 silencing or overexpression on HMGA1-activated FASN transcription in HT-29 cells. k Schematic illustration of the mutated promoter sites in pGL3-Basic-FASN reporter. Potential binding sites of SREBP1 in FASN promoter targeted by HMGA1 were mutated. l, m Luciferase reporter assay to detect the effect of SREBP1 binding sites mutated on HMGA1-activated FASN transcription in HMGA1-knocked down (l) or HMGA1-overexpressed (m) HT-29 cells. n Chromatin immunoprecipitation-qPCR assay (ChIP-qPCR) to verify that HMGA1 facilitated the binding of SREBP1 to the promoter of FASN in HT-29 cells. Data are presented as mean ± SD from 3 independent experiments. Statistical significance was determined by two-tailed unpaired t-test (c, d, i, j, l, m, n) or Pearson correlation coefficient (e). Ns, no statistical difference. IGV: integrative genomics viewer; ATAC-seq: assay for transposase accessible chromatin using sequencing; Co-IP: co-immunoprecipitation. Source data are provided as a Source Data file.
Fig. 7
Fig. 7. HFD abrogates the protection of HMGA1 depletion on Hmga1△IEC mice from CRC tumorigenesis.
Hmga1flox/flox and Hmga1△IEC mice were treated with high fat diet (HFD) and AOM/DSS for the induction of CRC. a, d Schematic diagram of the induction. b, e Representative images of colorectum in the mice. c, f The number and size of tumors in the entire colorectum in each mouse were measured. g, i HE staining of the colorectum (CRC) from mice treated with control diet (CD), CD and AOM/DSS, HFD, and HFD and AOM/DSS (Scale bar = 20 μm. Representative images from 3 independent experiments). The percentage of LGD, HGD, and carcinoma was determined. LGD: low-grade dysplasia; HGD: high-grade dysplasia. h, j Representative images of IHC staining of Ki67 in murine colorectum (Scale bar = 20 μm). Data are presented as mean ± SD. Statistical significance was determined by two-tailed unpaired t-test (c, f, h, j). n = 12. Source data are provided as a Source Data file.
Fig. 8
Fig. 8. Inhibition of FASN-mediated lipid synthesis mitigates HMGA1-promoted CRC tumorigenesis.
Rosa26Hmga1/+ and Hmga1IEC-OE/+ mice were treated with AOM/DSS for the induction of CRC. Orlistat (50 mg/kg) was applied to the mice by gavage every other day for the entire duration in the CRC induction. a, d Schematic diagram of the induction and orlistat treatment. b, e Representative images of colorectum in the mice. c, f The number and size of tumors in the entire colorectum of each mouse were measured. g, i HE staining of colorectum (CRC) from mice treated with control (water), AOM/DSS, orlistat, and AOM/DSS and orlistat (Scale bar = 20 μm. Representative images from 3 independent experiments). The percentage of LGD, HGD, and carcinoma was determined. LGD, low-grade dysplasia; HGD, high-grade dysplasia. h, j Representative images of IHC staining of Ki67 in colorectum (CRC) from the mice (Scale bar = 20 μm). Data are presented as mean ± SD. Statistical significance was determined by two-tailed unpaired t-test (c, f, h, j). n = 12. Source data are provided as a Source Data file.

References

    1. Xia, L. et al. The cancer metabolic reprogramming and immune response. Mol. Cancer20, 28 (2021). - PMC - PubMed
    1. Li, C. et al. Association between abnormal lipid metabolism and tumor. Front. Endocrinol. (Lausanne)14, 1134154 (2023). - PMC - PubMed
    1. Shuvalov, O., Daks, A., Fedorova, O., Petukhov, A. & Barlev, N. Linking metabolic reprogramming, plasticity and tumor progression. Cancers (Basel)13, 762 (2021). - PMC - PubMed
    1. Ye, L., Li, Y., Zhang, S., Wang, J. & Lei, B. Exosomes-regulated lipid metabolism in tumorigenesis and cancer progression. Cytokine Growth Factor Rev.73, 27–39 (2023). - PubMed
    1. Wang, W., Bai, L., Li, W. & Cui, J. The lipid metabolic landscape of cancers and new therapeutic perspectives. Front Oncol.10, 605154 (2020). - PMC - PubMed

Publication types

MeSH terms

Substances

Associated data