. 2024 Nov 15;15(1):9934.
doi: 10.1038/s41467-024-54293-z.

Urease-powered nanomotor containing STING agonist for bladder cancer immunotherapy

Affiliations

Urease-powered nanomotor containing STING agonist for bladder cancer immunotherapy

Hyunsik Choi et al. Nat Commun. .

Abstract

Most non-muscle invasive bladder cancers have been treated by transurethral resection and following intravesical injection of immunotherapeutic agents. However, the delivery efficiency of therapeutic agents into bladder wall is low due to frequent urination, which leads to the failure of treatment with side effects. Here, we report a urease-powered nanomotor containing the agonist of stimulator of interferon genes (STING) for the efficient activation of immune cells in the bladder wall. After characterization, we perform in vitro motion analysis and assess in vivo swarming behaviors of nanomotors. The intravesical instillation results in the effective penetration and retention of nanomotors in the bladder. In addition, we confirm the anti-tumor effect of nanomotor containing the STING agonist (94.2% of inhibition), with recruitment of CD8+ T cells (11.2-fold compared with PBS) and enhanced anti-tumor immune responses in bladder cancer model in female mice. Furthermore, we demonstrate the better anti-tumor effect of nanomotor containing the STING agonist than those of the gold standard Bacille Calmette-Guerin therapy and the anti-PD-1 inhibitor pembrolizumab in bladder cancer model. Taken together, the urease-powered nanomotor would provide a paradigm as a next-generation platform for bladder cancer immunotherapy.


Conflict of interest statement

Competing interests The authors declare no competing interests.

Figures

Fig. 1
Fig. 1. Schematic illustration of urease-powered nanomotor.
a The intravesical delivery of urease-powered nanomotors for bladder cancer immunotherapy and (b) the preparation procedure of urease-powered nanomotors containing STING agonist (STING@nanomotor, size = ca. 600 nm) by the electrostatic interaction of chitosan and heparin. a created in BioRender. Choi, H. (2024) https://BioRender.com/u13b061.
Fig. 2
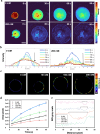
Fig. 2. In vitro motion analysis of nanomotors.
a Density maps of swarming in the presence (upper panel) and in the absence of urea (lower panel) for 90 s (scale bar = 2 mm) and (b) the corresponding X axis projection with time (0, 5, 10, 30, 60, and 90 s). c Particle image velocity (PIV) analysis of swarm according to the urea concentration for 2 s (45 s−47 s). The density maps and PIV images are representative of 3 independent experiments. d Expanding area according to the urea concentration for 90 s. Data are presented as mean values and error bars represent the S.D. (n = 3 per group, biological replicates). e The gray scale of ROI region indicated in supplementary Fig. 4c at 30 s. The gray scale of ROI region is representative of 3 independent experiments. Black dot lines indicate the width of ring patten in swarm. Source data are provided as a Source Data file.
Fig. 3
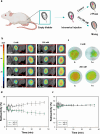
Fig. 3. PET-CT analysis of 18F-nanomotors after intravesical instillation.
a Schematic illustration for the administration to analyze in vivo swarming behavior of nanomotors. b PET-CT images for 45 min after the intravesical instillation of 18F-nanomotors in the presence and in the absence of 200 mM urea, and (c) the corresponding 3D reconstructed images at 0 and 45 min. The PET-CT images are representative of 3 independent experiments. Quantitative analysis of the VOIs (d) without and (e) with urea for 45 min. Data are presented as mean values and error bars represent the S.D. (n = 3 mice per group). Source data are provided as a Source Data file. a created in BioRender. Choi, H. (2024) https://BioRender.com/u13b061.
Fig. 4
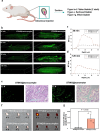
Fig. 4. In vivo penetration and retention of STING@nanomotor after intravesical instillation.
a Schematic illustration for the penetration and retention tests of nanomotors after intravesical instillation by using 3 different ways. b 3D fluorescence images after injecting fluorescence dye labeled STING@nanomotors and STING@nanocomplex in the bladder for 120 min and the corresponding mean fluorescence intensity (MFI) at (c) 30 min and (d) 120 min. e Bladder section after 12 h post-intravesical injection of STING@nanomotors and STING@nanocomplex in mice (scale bar = 100 μm). The fluorescence images and corresponding MFI are representative of 3 independent experiments. f Photograph (left) and IVIS imaging (right) of bladders after 12 h post-intravesical injection of samples and (g) the corresponding total radiant efficiency of bladders. Data are presented as mean values and error bars represent the S.D., and statistical analysis was performed via two-sided t-test (n = 3 mice per group). Source data are provided as a Source Data file. a created in BioRender. Choi, H. (2024) https://BioRender.com/u13b061.
Fig. 5
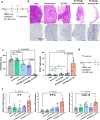
Fig. 5. STING@nanomotor to inhibit bladder cancer growth by inducing antitumor immunity.
a Diagram depicting the generation of MB49 bladder cancer in B6 mice and the treatment schedule. b Representative images for the comparison of tumor growth by H&E staining of bladder cancers (upper panel) and the CD8 T cell infiltration (lower panel) after each treatment. The H&E staining images are representative of 6 independent experiments and CD8 T cell immunohistochemical images are representative of 5 independent experiments. c Quantitative analysis for the tumor thickness and the CD8 T cell infiltration. Data are presented as mean values and error bars represent the S.D. and statistical analysis was performed via two-sided t-test (n = 6 mice per group). d Diagram depicting the generation of MB49 bladder cancer and the treatment schedule to measure mRNA expression in the bladder. e mRNA expression of indicated genes following each treatment. Data are presented as mean values and error bars represent the S.D., and statistical analysis was performed via two-sided t-test (n = 5 mice per group). Source data are provided as a Source Data file.
Fig. 6
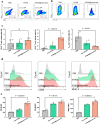
Fig. 6. Immune response and pro-tumor response of STING@nanomotor.
The representative flow cytometry plots of (a) CD4+ and CD8+ T cells, and (b) regulatory T cells. c The corresponding percentage of CD4+, CD8+ T cells (n = 4 mice per group) and regulatory T cells in whole bladder cells. Data are presented as mean values and error bars represent the S.D. and statistical analysis was performed via two-sided t-test (n = 3 mice per group). d The flow cytometry comparison of CD80, CD86, and MHC-II expression on dendritic cells from each bladder tumor and (e) the corresponding mean fluorescent intensity of expressed CD80, CD86, and MHC-II. CD8+ T cells were identified as DAPI/CD45+/CD3ε+/CD4/CD8a+ cells, CD4+ T cells as DAPI/CD45+/CD3ε+/CD8a/CD4+ cells, Treg cells as FVS450/CD45+/CD4+/CD25+ cells and dendritic cells as DAPI/CD45+/CD11c+ cells. Data are presented as mean values and error bars represent the S.D., and statistical analysis was performed via two-sided t-test (n = 3 mice per group). Source data are provided as a Source Data file.
Fig. 7
Fig. 7. The anti-tumor effect of BCG treatment and anti-PD-L1 combination therapy with nanomotors.
a The treatment schedule and the representative images of sectioned urinary bladder from the bladder cancer model prepared by using MB-49 cells after each treatment (control, BCG, STING and STING@nanomotor) (left) and the corresponding thickness of bladder wall. Data are presented as mean values and error bars represent the S.D. and statistical analysis was performed via two-sided t-test (n = 6 mice per group). b The treatment schedule and the representative images of sectioned urinary bladder from the bladder cancer model after each treatment (control, anti-PD-1, STING@nanomotor and combination) (left) and the corresponding thickness of bladder wall. Data are presented as mean values and error bars represent the S.D. and statistical analysis was performed via two-sided t-test (n = 5 mice per group). c Schematic illustration for the overall mechanism of anti-PD-L1 combination therapy with STING@nanomotor for bladder cancer immunotherapy. Source data are provided as a Source Data file. c created in BioRender. Choi, H. (2024) https://BioRender.com/u13b061.

References

    1. Cumberbatch, M. G. et al. Repeat transurethral resection in non-muscle-invasive bladder cancer: a systematic review. Eur. Urol.73, 925–933 (2018). - PubMed
    1. Kamat, M. et al. Bladder cancer. Lancet388, 2796–2810 (2016). - PubMed
    1. Tan, W. S., Rodney, S., Lamb, B., Feneley, M. & Kelly, J. Management of non-muscle invasive bladder cancer: a comprehensive analysis of guidelines from the United States, Europe and Asia. Cancer Treat. Rev.47, 22–31 (2016). - PubMed
    1. Pettenati, C. & Ingersoll, M. A. Mechanisms of BCG immunotherapy and its outlook for bladder cancer. Nat. Rev. Urol.15, 615–625 (2018). - PubMed
    1. Wołącewicz, M. et al. Immunotherapy in bladder cancer: current methods and future perspectives. Cancers12, 1181 (2020). - PMC - PubMed

Publication types

MeSH terms