. 2024 Nov 15;14(1):28132.
doi: 10.1038/s41598-024-78301-w.

Persistence diagrams for exploring the shape variability of abdominal aortic aneurysms

Affiliations

Persistence diagrams for exploring the shape variability of abdominal aortic aneurysms

Dario Arnaldo Domanin et al. Sci Rep. .

Abstract

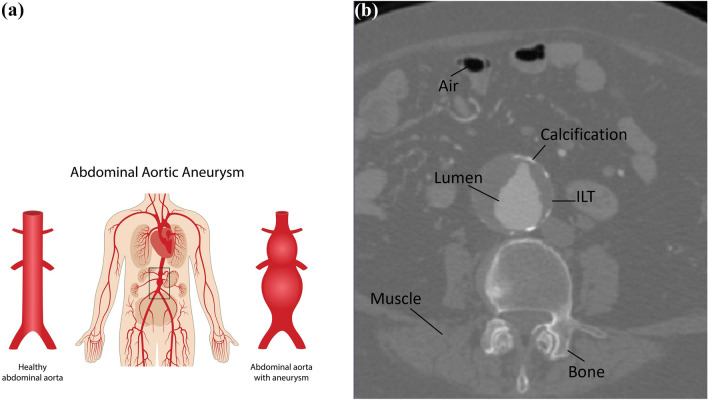
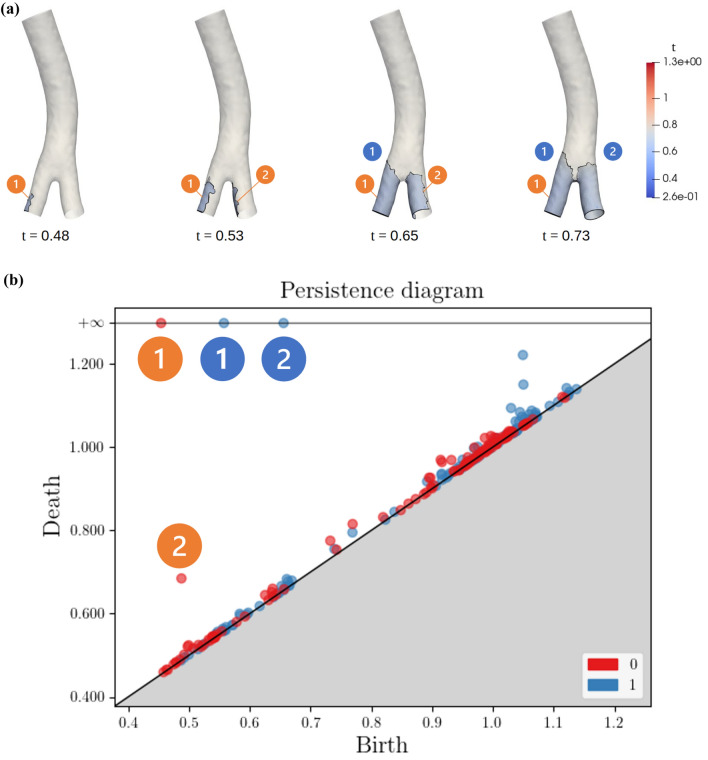
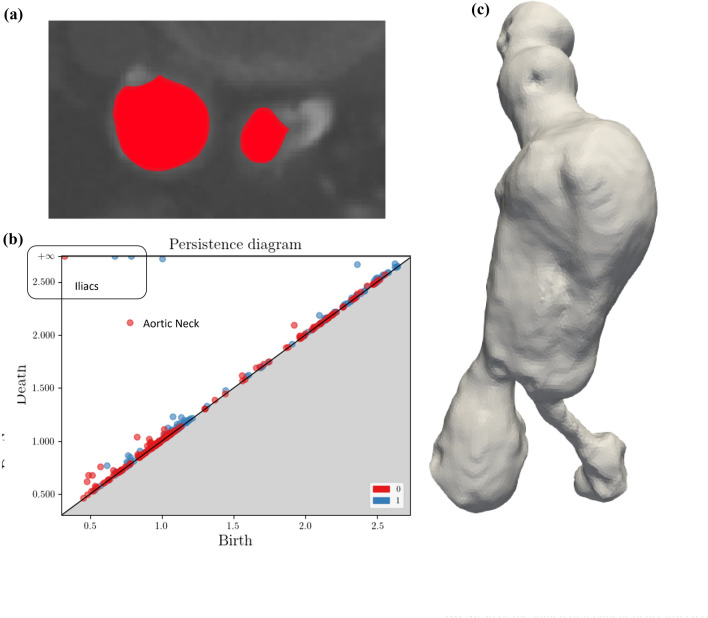
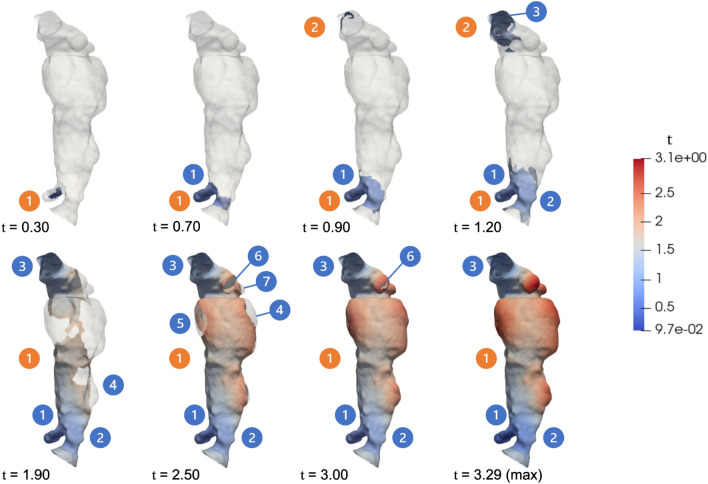
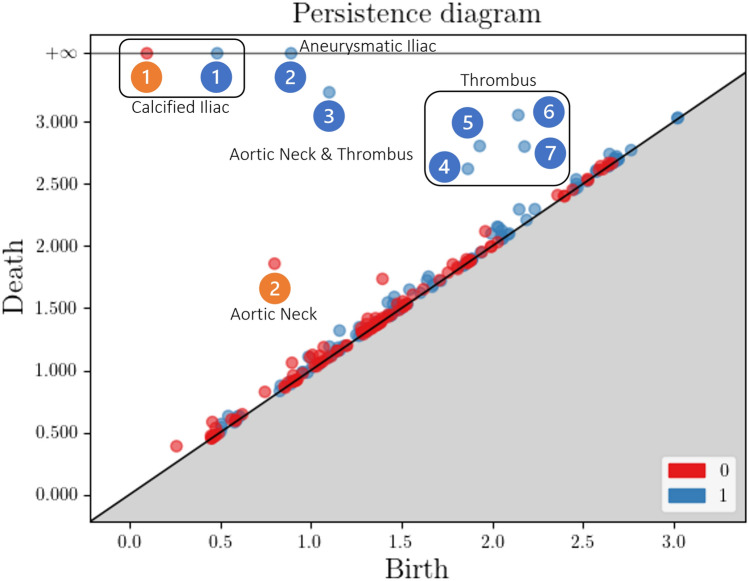
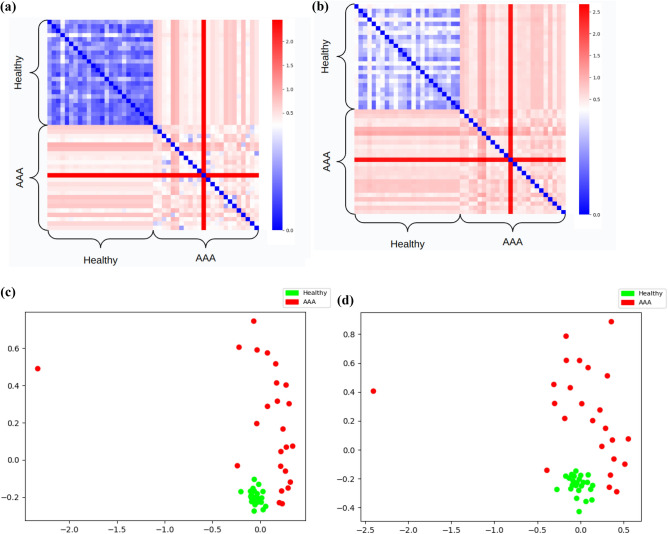
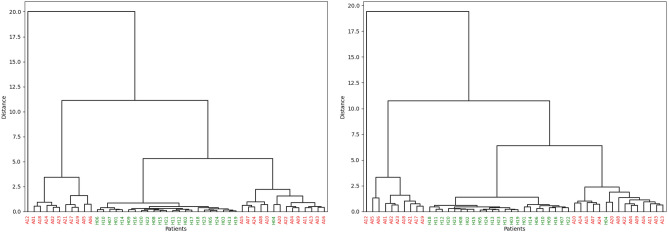
Abdominal aortic aneurysm consists of a permanent dilation in the abdominal portion of the aorta and, along with its associated pathologies like calcifications and intraluminal thrombi, is one of the most important pathologies of the circulatory system. The shape of the aorta is among the primary drivers for these health issues, with particular reference to all the characteristics which affect the hemodynamics. Starting from the computed tomography angiography of a patient, we propose to summarize such information using tools derived from Topological Data Analysis, obtaining persistence diagrams which describe the irregularities of the lumen of the aorta. We showcase the effectiveness of such shape-related descriptors with a series of supervised and unsupervised case studies.


Conflict of interest statement

Competing Interests The authors declare no competing interests. Ethical statement The study has been conducted in accordance with the Declaration of Helsinki and subsequent modifications. It was approved by the ethics committee Comitato Etico Milano Area 2 at the Fondazione IRCCS Ca’ Granda Ospedale Maggiore Policlinico di Milan, with protocol number 3457/2023. The need for a signature of a specific informed consent was waived by the same committee as the study was observational and retrospective. No further requirements of clinical trials was necessary for the same reason.

Figures

Figure 1
Figure 1
(a) A schematic view of the circulatory system with highlighted the abdominal portion of the aorta, with both an healthy and aneurysmatic example. Image from https://www.vascularcures.org/abdominal-aortic-aneurysms; (b) A coronal slice of a CTA scan. Different shades of grey differentiate between different organs and tissues. This allows both the clinicians to see the entire anatomy of the patient and the algorithm to execute the segmentation process.
Figure 2
Figure 2
A schematic view of the segmentation process, starting from the CTA scan and obtaining the final mesh representing the portion of interest of the Aorta and the iliacs.
Figure 3
Figure 3
(a) A path connected component created by an inward bump, in the sublevel set filtration defined in “Filtrations and homology”. Path connected components created by other inward bumps merge with each other at saddle points or local maxima. The color map of the sublevel set refers to the value of t: the radial distance from each point in the mesh to the centerline; (b) a loop created by an outward bump, in the sublevel set filtration defined in “Filtrations and homology”. When the whole bulge is contained in the filtration, the loop disappears. The color map of the sublevel set refers to the value of t: the radial distance from each point in the mesh to the centerline; (c) loops generated by the tubular structure of the mesh. The color map refers to the value of $t$: the radial distance from each point in the mesh to the centerline; (d) two persistence diagrams and the optimal matching between them giving the bottleneck distance.
Figure 4
Figure 4
A schematic view of the aorta, with the normalized distances from the centerline made explicit. Image modified from https://prescrivere.blogspot.com/
Figure 5
Figure 5
All the objects in this figure are homotopy equivalent.
Figure 6
Figure 6
(a) Initial steps of the sublevel set filtration of a patient with healthy iliacs, showing the births of the iliacs-related persistence pairs: first appear the two local minima of the radial distance located on the two iliacs - orange (1) and (2) - and then the two loops going around the tubular structure of the iliacs - blue (1) and (2). The color map of the sublevel sets refers to the value of t: the radial distance from each point in the mesh to the centerline; (b) the persistence diagram, in dimension 0 and 1, of an healthy patient, with highlighted the persistence pairs related to the iliacs, whose labels are coherent with the ones in (a).
Figure 7
Figure 7
(a) CTA scan slice of iliacs presenting calcification in the right iliac and aneurysm in the left. The red portion shows the lumen restriction created by calcifications and the bulge created by the aneurysm; (b) the persistence diagram of a patient with an aortic aneurysm and an iliac aneurysm. The lack of an early 0-cycle with high persistence is visible. As is the presence of one class of high persistence 1-cycles created by the AAA; (c) mesh of the lumen of a patient being affected by calcifications and aneurysm in the iliacs: the left one presents a bulge created by the aneurysm, while the right one is severely occluded by calcifications.
Figure 8
Figure 8
(a) Two different steps of the sublevel set filtration of a patient affected by AAA: in the first step (t=1.15, with t being the radial distance from each point in the mesh to the centerline) we clearly see the two path connected components - orange (1) and orange (2) - which are separated by the AAA. At very high filtration values the AAA is added to the filtration and the path connected components merge. A similar phenomenon involves also 1-cycles: on the left, the loop going around the upper portion of the aorta cannot “slide” down on the mesh and be equivalent to the loop going around the lower portion of the aorta - made by (1)+(2). This is instead possible on the right, causing the eventual death of loop (3). The colormap illustrates the distance of each mesh point from the centerline; (b) the persistence diagram of the filtration in (a). We have highlighted the high persistence path connected component and loop caused by the AAA splitting in two parts the aorta.
Figure 9
Figure 9
(a) A CTA slice of a non-aneurysmal aorta with presence of calcifications which creates bump in the lumen of the blood vessel; (b) the persistence diagram of the filtration in (c): we see a number of persistence pairs with medium persistence, being born in the main body of the aorta - i.e. with birth value higher than the aortic neck, as a consequence of the irregularities due to calcifications; (c) different time steps of the sublevel set filtration of an aorta without AAA but with calcifications: calcifications create many medium-sized irregularities and bumps in the lumen which are picked up by the filtration, creating a number of path connected components arising and persisting for some time. The color map of the sublevel set refers to the value of t: the radial distance from each point in the mesh to the centerline.
Figure 10
Figure 10
CTA slices of an AAA with thrombus occluding the lumen.
Figure 11
Figure 11
A patient affected by AAA, iliac aneurysm and thrombus. The filtration function values are reported in black on the bottom left corner of the aorta. The sublevel sets are represented by the higlighted portions of the mesh. The numbered features identify 0-dimensional (red) and 1-dimensional cycles associated to points in the diagram appearing in Fig. 12. The color map of the sublevel set refers to the value of t: the radial distance from each point in the mesh to the centerline.
Figure 12
Figure 12
The persistence Diagram associated with the mesh shown in Fig. 11. Features labelled as (1) both in dimension 0 and 1 are the structural pairs associated to the iliac which does not present an aneurysm. In particular, path connected component (1) is born very early along the filtration and that is because of some inwards bumps due to some calcifications. Persistence pairs (2) - both in dimension 0 and 1 -, instead, are born very late, almost at the filtration value of the neck. This is a clear consequence of the iliac aneurysm. The 1-cycles’ class (3) is generated because of the AAA splitting the blood vessel in two parts. An in fact it dies at the latest value of the filtration. Then we have a group of 1-cycles - from (4) to (7) - with medium persistence, which reflect the irregularities in the lumen caused by some heterogeneous thrombus.
Figure 13
Figure 13
(a) The matrix of pairwise formula image-Wasserstein distances between the persistence diagrams computed in “Clustering”. Patients are ordered so that healthy patients come before non-healthy ones. (b) The matrix of pairwise 2-Wasserstein distances between the persistence diagrams computed in “Clustering”. Patients are ordered so that healthy patients come before the ones affected by AAA; (c) two dimensional MDS representation of the matrix in (a); (d) two dimensional MDS representation of the matrix in (b).
Figure 14
Figure 14
Hierarchical clustering dendrograms related to the clustering problem presented in  “Clustering”: for the formula image-Wasserstein distance (left) and for the 2-Wasserstein distance (right). Both with Ward linkage. Patients in red are affected by AAA, while healthy ones are drawn in green.
Figure 15
Figure 15
Confusion matrices for the classification case study presented in “Supervised classification-AAA”: for the Bottleneck distance (a) and for the 2-Wasserstein distance (b). Label A is for patients with AAA, H for the “healthy” ones.
Figure 16
Figure 16
Plot related to  “Supervised classification-calcifications”, representing the counts of the persistence pairs in dimension 0 with persistence greater than 0.1 to recognize patients with calcifications. Patients which present calcifications are plotted in orange, the others in blue. There is clearly correlation between the presence of calcifications and irregularities of the lumen captured by 0 dimensional homology. We highlight that this holds true also for healthy patients, which is arguably the more interesting situation, as most of the patients affected by AAA present also calcifications. Patients are labelled and ordered as in previous figures.
Figure 17
Figure 17
A partial view of the table showing the aortas with calcifications correctly classified through the grid search of the optimal values for the parameters τp and τc. The rows represent different values of τp, while the columns indicate values for τc. The greener a cell is the more patients are correctly identified.
Figure 18
Figure 18
(a) The scatterplot of the variables formula image and formula image used for classifying patients with iliac aneurysm in “Supervised classification-iliac aneurysm”; (b) L1out confusion matrix for Iliac Aneurysm classification. Label AI is for patients with iliac aneurysm, H for the others.
Figure 19
Figure 19
Plot related to  “Supervised classification-thrombus”, representing the counts of persistence pairs with medium persistence associated to irregularities of the lumen, trying to exclude bumps located on the iliacs and on the aortic neck. Patients which present thrombi are plotted in orange, the others in blue. Again we can see correlation between the presence of thrombi and irregularities of the lumen captured by the selected points in 0 and 1 dimensional homology.
Figure 20
Figure 20
A partial view of the table showing the aortas with thrombus correctly classified through the grid search of the optimal values for the parameters τp and τb. The rows represent different values of τp, while the columns indicate values for τb. The greener a cell is the more patients are correctly identified.
Figure 21
Figure 21
One of the patients (A10) missclassified by the analysis in “Supervised classification-thrombus”: a CTA slice (left) and the reconstructed mesh (right). The color map refers to the value of t: the radial distance from each point in the mesh to the centerline.

References

    1. Marron, J. S. & Dryden, I. L. Object Oriented Data Analysis (CRC Press, 2021).
    1. Sonesson, B., Länne, T., Hansen, F. & Sandgren, T. Infrarenal aortic diameter in the healthy person. Eur. J. Vasc. Endovasc. Surg.8, 89–95 (1994). - PubMed
    1. Wilson, K. A., Lindholt, J. S., Hoskins, P. R. & et al. The relationship between abdominal aortic aneurysm distensibility and serum markers of elastin and collagen metabolism. Eur. J. Vasc. Endovasc. Surg.21, 175–178 (2001). - PubMed
    1. Dua, M. M. & Dalman, R. L. Hemodynamic influences on abdominal aortic aneurysm disease: Application of biomechanics to aneurysm pathophysiology. Vasc. Pharmacol.53, 11–21 (2010). - PMC - PubMed
    1. Mealy, K. & Salman, A. The true incidence of ruptured abdominal aortic aneurysms. Med. Eng. Phys2, 405–408 (1988). - PubMed

MeSH terms