

Hippocampal exosomes from stroke aggravate post-stroke depression by regulating the expression of proBDNF and p75NTR and altering spine density
- PMID: 39548202
- PMCID: PMC11568158
- DOI: 10.1038/s41598-024-79558-x
Hippocampal exosomes from stroke aggravate post-stroke depression by regulating the expression of proBDNF and p75NTR and altering spine density
Abstract
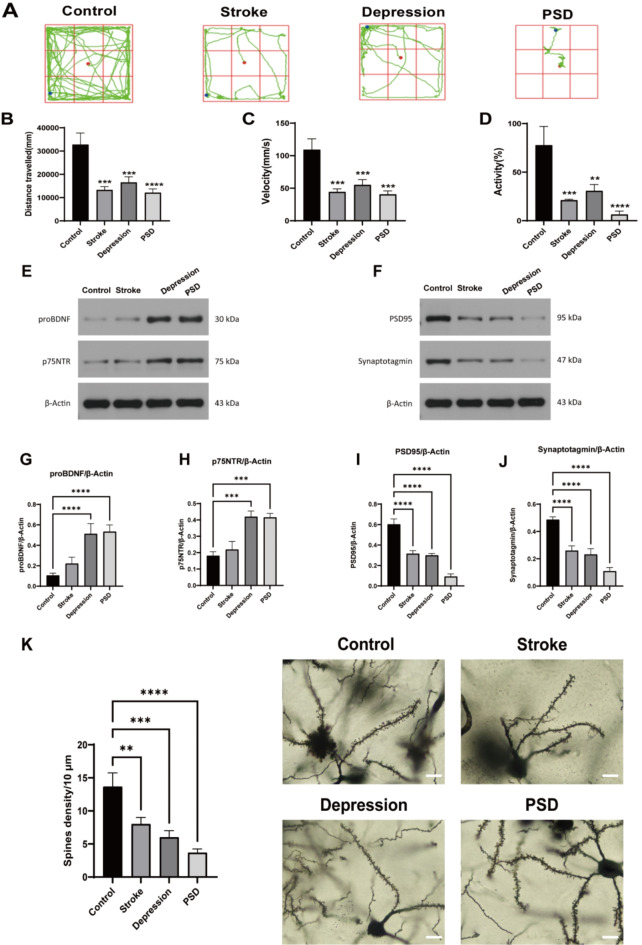
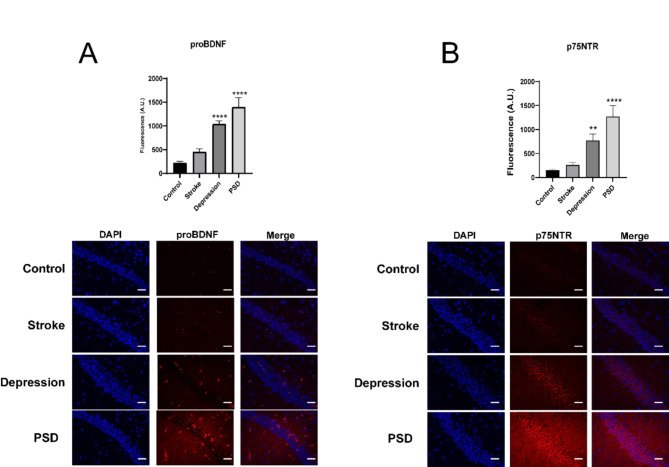
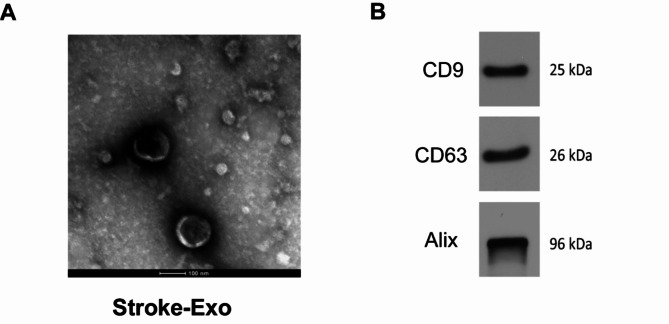
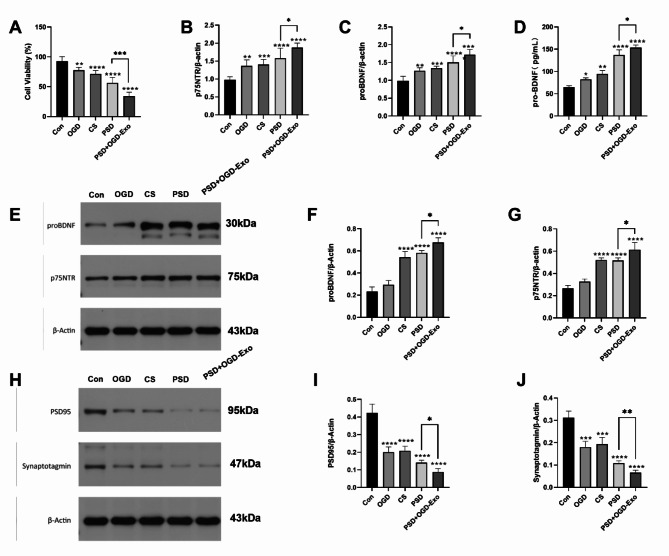
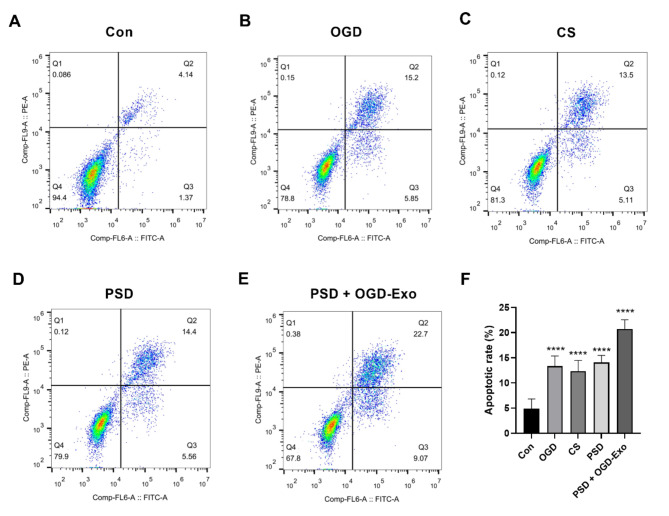
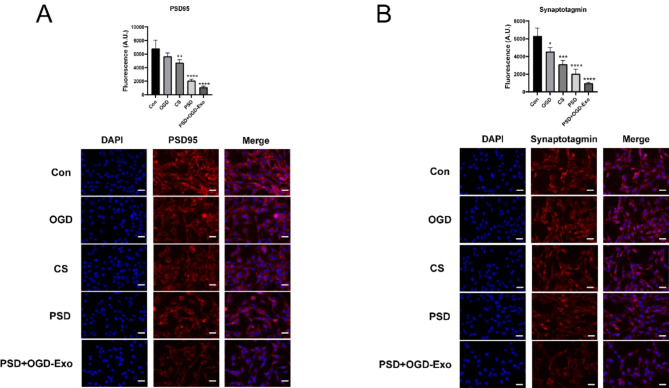
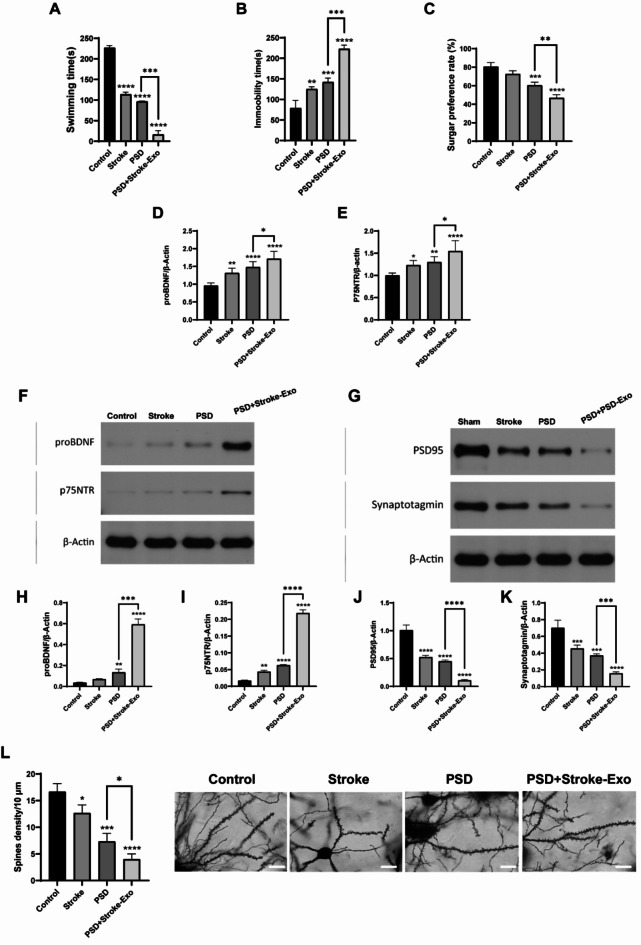
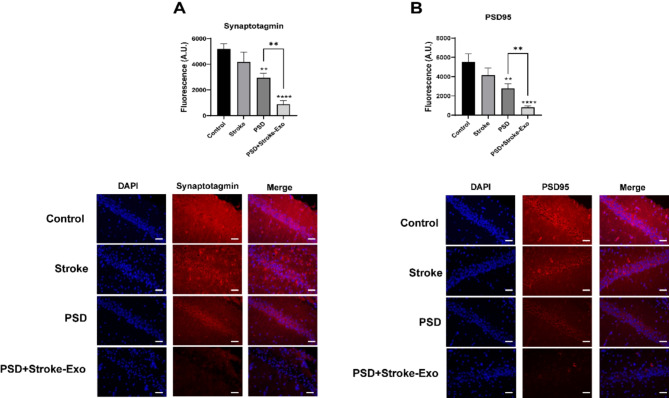
Post-stroke depression (PSD) affects millions of patients who suffer cerebral stroke. However, the molecular mechanisms and pathophysiology are poorly understood. Previous studies have shown that exosomes have been proven to be involved in neuropsychiatric disorders such as stroke and post-stroke depression in neurotransmitter release, neuronal remodeling, and neuron angiogenesis. Here we extracted and purified hippocampal exosomes from stroke mouse model to investigate mechanisms of hippocampal exocytosis in PSD assessed by using behavioral tests and biochemical methods. Aiming at the effect of hippocampal exosomes from stroke on the development of PSD, behavioral test was compared including sugar water preference experiment, open fields, forced swimming test, to explore it in depth. Further, the expression of depression-related protein (proBDNF and p75NTR) and synapse-associated proteins (Synaptotagmin and PSD95) was evaluated by Western blotting, RT-qPCR or immunofluorescence staining. Density of dendritic protrusions of neurons was assessed by Golgi staining to measure changes in spine density after the treatment of hippocampal exosomes from stroke. Our results revealed that injection of exosomes from stroke models significantly aggravated depressive-like behaviors, increase of depression-related protein (proBDNF and p75NTR) expression and deficiency of synapse-associated proteins (Synaptotagmin and PSD95) expression, and the decreased number of spin density. Our findings together suggest that hippocampal exosomes from stroke cause exacerbation of depressive-like behavior in mice, possibly resulting from the regulation of neurogenesis by its depression-associated proteins (proBDNF and p75NTR). Therefore, hippocampal exosomes from stroke are promising targets for the diagnosis and treatment of PSD.
Keywords: Hippocampal exosomes; PSD95; Post-stroke depression; Synaptotagmin; p75NTR; proBDNF.
© 2024. The Author(s).
Conflict of interest statement
Figures
Similar articles
-
Function and application of brain‑derived neurotrophic factor precursors (Review).Int J Mol Med. 2025 Jul;56(1):105. doi: 10.3892/ijmm.2025.5546. Epub 2025 May 9. Int J Mol Med. 2025. PMID: 40341415 Free PMC article. Review.
-
The expression of ProBDNF and its high affinity receptor P75NTR in the neurons of emotion-related brain regions of post-stroke depression rats.Brain Res. 2024 May 15;1831:148829. doi: 10.1016/j.brainres.2024.148829. Epub 2024 Feb 27. Brain Res. 2024. PMID: 38423239
-
Effect of aerobic exercise on BDNF/proBDNF expression in the ischemic hippocampus and depression recovery of rats after stroke.Behav Brain Res. 2019 Apr 19;362:323-331. doi: 10.1016/j.bbr.2018.11.037. Epub 2018 Nov 27. Behav Brain Res. 2019. PMID: 30500428
-
High-Intensity Interval Training on Neuroplasticity, Balance between Brain-Derived Neurotrophic Factor and Precursor Brain-Derived Neurotrophic Factor in Poststroke Depression Rats.J Stroke Cerebrovasc Dis. 2019 Mar;28(3):672-682. doi: 10.1016/j.jstrokecerebrovasdis.2018.11.009. Epub 2018 Nov 30. J Stroke Cerebrovasc Dis. 2019. PMID: 30503681
-
BDNF effects on dendritic spine morphology and hippocampal function.Cell Tissue Res. 2018 Sep;373(3):729-741. doi: 10.1007/s00441-017-2782-x. Epub 2018 Feb 15. Cell Tissue Res. 2018. PMID: 29450725 Review.
Cited by
-
Exosome-powered neuropharmaceutics: unlocking the blood-brain barrier for next-gen therapies.J Nanobiotechnology. 2025 May 3;23(1):329. doi: 10.1186/s12951-025-03352-8. J Nanobiotechnology. 2025. PMID: 40319325 Free PMC article. Review.
-
Function and application of brain‑derived neurotrophic factor precursors (Review).Int J Mol Med. 2025 Jul;56(1):105. doi: 10.3892/ijmm.2025.5546. Epub 2025 May 9. Int J Mol Med. 2025. PMID: 40341415 Free PMC article. Review.
References
-
- Robinson, R. G. & Jorge, R. E. Post-stroke depression: A review. Am. J. Psychiatry173 (3), 221–231. 10.1176/appi.ajp.2015.15030363 (2016). - PubMed
-
- Hackett, M. L., Pickles, K. & Part, I. Frequency of depression after stroke: An updated systematic review and meta-analysis of observational studies. Int. J. Stroke9 (8), 1017–1025. 10.1111/ijs.12357 (2014). - PubMed
-
- Sun, W., Li, X. & An, L. Distinct roles of prelimbic and infralimbic proBDNF in extinction of conditioned fear. Neuropharmacology131, 11–19. 10.1016/j.neuropharm.2017.12.018 (2018). - PubMed
MeSH terms
Substances
LinkOut - more resources
Full Text Sources
Medical
