. 2024 Nov 15;14(1):28150.
doi: 10.1038/s41598-024-79136-1.

Sirtuin inhibitors reduce intracellular growth of M. tuberculosis in human macrophages via modulation of host cell immunity

Affiliations

Sirtuin inhibitors reduce intracellular growth of M. tuberculosis in human macrophages via modulation of host cell immunity

Sadaf Kalsum et al. Sci Rep. .

Abstract

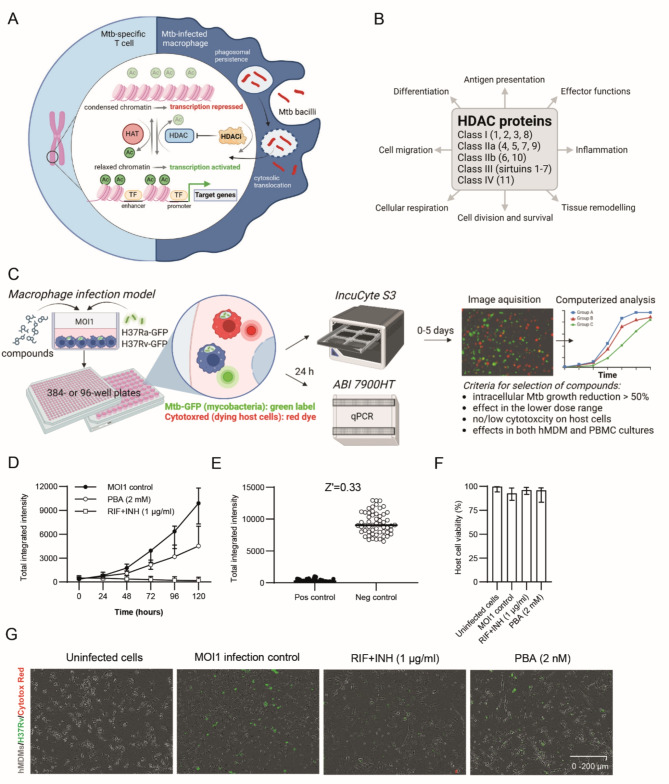
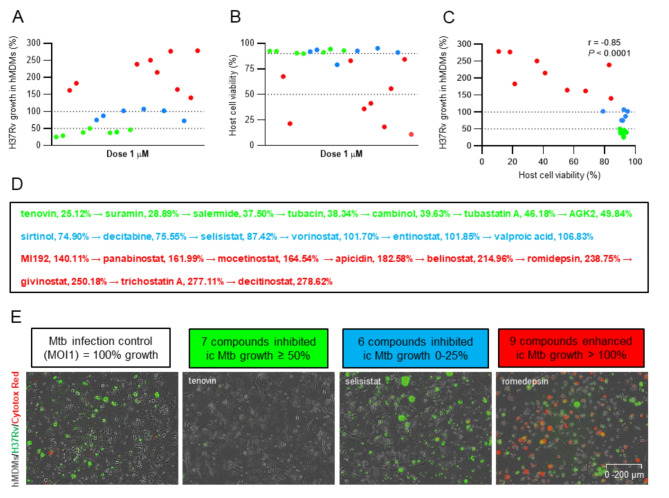
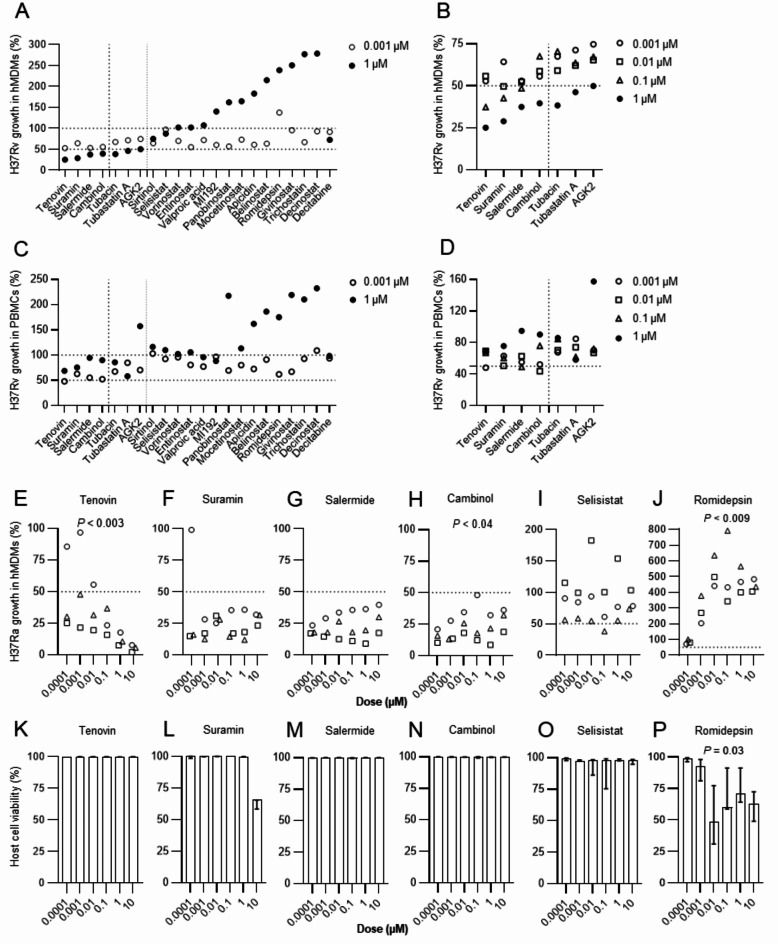
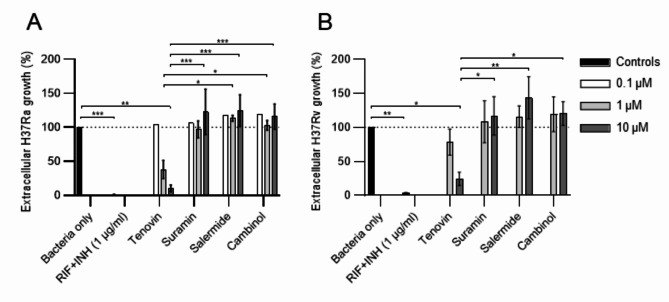
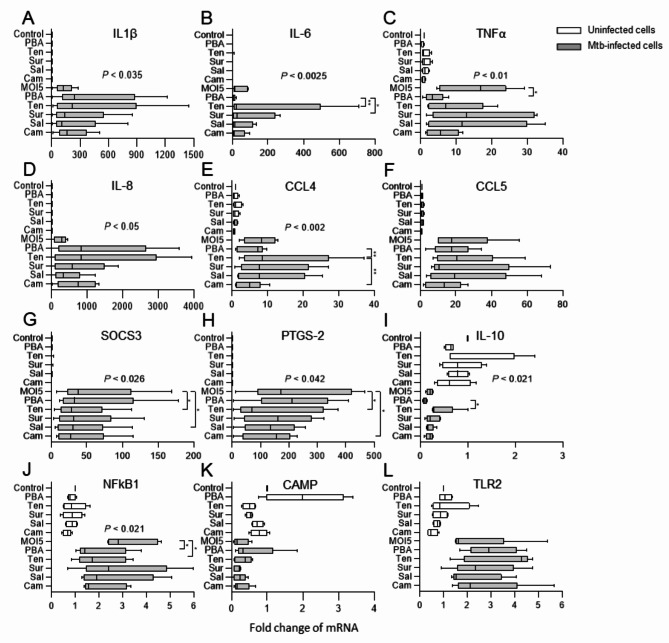
Host-directed therapies aiming to strengthen the body's immune system, represent an underexplored opportunity to improve treatment of tuberculosis (TB). We have previously shown in Mycobacterium tuberculosis (Mtb)-infection models and clinical trials that treatment with the histone deacetylase (HDAC) inhibitor, phenylbutyrate (PBA), can restore Mtb-induced impairment of antimicrobial responses and improve clinical outcomes in pulmonary TB. In this study, we evaluated the efficacy of different groups of HDAC inhibitors to reduce Mtb growth in human immune cells. A panel of 21 selected HDAC inhibitors with different specificities that are known to modulate infection or inflammation was tested using high-content live-cell imaging and analysis. Monocyte-derived macrophages or bulk peripheral blood cells (PBMCs) were infected with the green fluorescent protein (GFP)-expressing Mtb strains H37Ra or H37Rv and treated with HDAC inhibitors in the micromolar range in parallel with a combination of the first-line antibiotics, rifampicin, and isoniazid. Host cell viability in HDAC inhibitor treated cell cultures was monitored with Cytotox-red. Seven HDAC inhibitors were identified that reduced Mtb growth in macrophages > 45-75% compared to average 40% for PBA. The most effective compounds were inhibitors of the class III HDAC proteins, the sirtuins. While these compounds may exhibit their effects by improving macrophage function, one of the sirtuin inhibitors, tenovin, was also highly effective in extracellular killing of Mtb bacilli. Antimicrobial synergy testing using checkerboard assays revealed additive effects between selected sirtuin inhibitors and subinhibitory concentrations of rifampicin or isoniazid. A customized macrophage RNA array including 23 genes associated with cytokines, chemokines and inflammation, suggested that Mtb-infected macrophages are differentially modulated by the sirtuin inhibitors as compared to PBA. Altogether, these results demonstrated that sirtuin inhibitors may be further explored as promising host-directed compounds to support immune functions and reduce intracellular growth of Mtb in human cells.

Keywords: Mycobacterium tuberculosis; Histone deacetylase (HDAC) inhibitors; Host-directed therapy; Immunity; Macrophage; Sirtuins; Tuberculosis.


Conflict of interest statement

Declarations Competing interests The authors declare no competing interests.This study was supported by the Swedish Heart and Lung Foundation (HLF) (2019 − 0302 and512022 − 0484 to S.B.), the Swedish Research Council (VR) (2019 − 01744 and 2022 − 00970 to S.B.), Karolinska Institutet KID funding (2018 − 00830 to S.B.) and the Foundation to Prevent Antibiotic Resistance. The funders had no role in study design, experimental works, data analysis, decision to publish, or preparation of the manuscript.

Figures

Fig. 1
Fig. 1
High-content imaging with IncuCyte to assess intracellular Mtb growth in human host cells. (A) The role of histone acetylation in transcriptional regulation of T cells (left) and Mtb-infected macrophages (right). Virulent Mtb typically induces deacetylation, chromatin compaction and inhibition of gene expression. Histone acetyltransferases (HAT), HDAC inhibitors (HDACi), acetyl group (Ac), transcription factors (TF). (B) Five classes containing 18 different HDAC proteins and their potential effects on cellular functions and immune cell responses. (C) Schematic illustration of the macrophage infection model, mycobacterial strains and experimental setup as well as data acquisition and analyses. (D) Longitudinal response of the Mtb infection control (MOI1), antibiotics control (RIF + INH) and internal HDAC inhibitor (PBA) control. Intracellular growth of H37Rv-GFP in hMDMs (Total integrated intensity expressed as GCU x µm2/image) was monitored in real-time (day 0–5) using IncuCyte (median +/- error). (E) The assay Z’ factor was determined using the mean +/- standard deviation of the negative (MOI1 infection) and positive (RIF + INH) controls. Representative data from one donor out of n = 3 is shown. (F) Viability of uninfected or H37Rv-infected hMDMs treated with RIF + INH or PBA. Data from n = 6 donors are presented in the bar graph (median +/- range). Host cell viability was monitored with Cytotox-red. (G) Representative microscopy images illustrating hMDMs (grey color) infected with H37Rv-GFP (green color) and treated with RIF + INH or PBA. Magnification x20. Illustrations in (A-B) were created with Biorender.com.
Fig. 2
Fig. 2
Pre-screening of HDAC inhibitor compounds on Mtb-infected macrophages. (A) Efficacy of the compounds to reduce intracellular growth of H37Rv inside hMDMs (%) and (B) assessment of macrophage viability (%). Green symbols: high efficacy (and low cytotoxicity), blue symbols: no or moderate efficacy (and low cytotoxicity, except entinostat with 79% host cell viability), and red symbols: low efficacy (and high cytotoxicity). (C) Correlation analysis of intracellular Mtb growth and cell viability as determined using Pearson correlation test. ****P < 0.0001. (D) Ranking the efficacy of the HDAC inhibitors (median Mtb growth in hMDM (%)) from the most effective (green label) to the least effective (blue and red labels) compounds. (E) Representative microscopy images of each condition including the MOI1 infection control, and the three different compound categories, high efficacy ≥ 50% Mtb growth inhibition (green label), moderate or low efficacy 0–25% Mtb growth inhibition (blue label), and no efficacy > 100% Mtb growth (red label). hMDMs (grey color), H37Rv bacteria (green color) and dying cells (red color) were visualized in the microscopy images. Magnification x20. Data assessed with IncuCyte at day 3 is presented in individual dot plot graphs showing the median values from n = 3 donors. The dotted lines in (A and C) indicate 100% and 50% intracellular Mtb growth in hMDM, respectively, and in (B) 90% and 50% host cell viability, respectively.
Fig. 3
Fig. 3
Dose-response of HDAC inhibitors assessed in Mtb-infected host cells. Intracellular growth of H37Rv-GFP inside (A-B) macrophages or, (C-D) bulk PBMCs at the indicated concentrations of HDAC inhibitor compounds. Efficacy of selected compounds to reduce intracellular growth of H37Ra-GFP inside hMDMs (%) including (E) tenovin, (F) suramin, (G) salermide, (H) cambinol, (I) selisistat, (J) romidepsin, and assessment of macrophage viability (%) including (K) tenovin, (L) suramin, (M) salermide, (N) cambinol, (O) selisistat, (P) romidepsin. Data assessed with IncuCyte at day 3 is presented in individual dot plot graphs or bar graphs (median or, median and range) from n = 12 (A-D), or n = 3 (E-P) donors. Data in (E-P) was analyzed using a paired Friedman test and one out of three similar experiments are shown. The horizontal dotted lines indicate 100% and 50% intracellular Mtb growth in hMDM or PBMCs, respectively, while the vertical dotted lines (A-D) distinguish the selected sirtuin inhibitors (thick line) as well as the seven compounds (fade line) that inhibited intracellular Mtb growth in hMDMs ≥ 50% at a concentration of 1 µM. *P < 0.05, **P < 0.01, ***P < 0.001.
Fig. 4
Fig. 4
Efficacy of selected sirtuin inhibitors to reduce intracellular Mtb growth in macrophages or PBMCs. Control conditions of H37Rv-GFP growth inside (A) fully differentiated hMDMs, or (B) bulk PBMC cultures. Uninfected host cells and the MOI1 infection control was compared to the positive controls with antibiotics (RIF + INH) or PBA (internal HDAC inhibitor control) for intracellular Mtb growth (%). (C) Representative microscopy images of the MOI1 infection control at day 0 and 3, in hMDM (upper panel) or PBMC cultures (lower panel). Immune cells (grey color) and H37Rv bacteria (green color) were visualized in the microscopy images. Arrows indicate H37Rv-GFP infected cells. Magnification x20. Note the smaller size of the lymphocytes compared to hMDMs. Efficacy of the selected compounds, tenovin, suramin, salermide and cambinol, to reduce intracellular growth of H37Rv-GFP inside hMDMs (D-G) or PBMC cultures (I-L), including comparison of intracellular Mtb growth reduction by treatment with PBA or the sirtuin inhibitors in (H) hMDMs or (M) PBMCs. In Fig. 4H and M, respectively, individual data from n = 12 donors present the µM-doses for each selected sirtuin inhibitor that were most effective (0.001, 0.01, 0.1 or 1 µM) in reducing intracellular Mtb growth as compared to 2mM of PBA. (N) Efficacy of the selected compounds to reduce intracellular growth of H37Rv-GFP inside hMDMs assessed using CFU counts at day 3. Data assessed with IncuCyte at day 3 is presented in individual dot plot graphs or bar graphs (median and range) from n = 12 donors (n = 4 donors for CFU counts in (N)) and was analyzed using a paired Friedman test (A-B), Kruskal-Wallis and Dunn´s multiple comparisons test (D-G and I-L) and repeated measures ANOVA with uncorrected Fisher’s LSD (H, M). The dotted lines indicate 50% intracellular Mtb growth and the MOI1 control was set to 100%. *P < 0.05, **P < 0.01, ****P ≤ 0.0001.
Fig. 5
Fig. 5
Efficacy of selected sirtuin inhibitors to reduce extracellular mycobacterial growth. (A) H37Ra-GFP, and (B) H37Rv-GFP planktonic bacterial cultures were untreated (bacteria only) or treated with the positive control (RIF + INH) or tenovin, suramin, salermide or cambinol at the indicated concentrations. Data assessed with IncuCyte at day 3 is presented in bar graphs (mean and standard error) from n = 3 different bacterial batches and was analyzed using a two-way RM ANOVA and Tukey´s multiple comparisons test. Selected statistical differences are shown. The dotted lines indicate 100% Mtb growth control. *P < 0.05, **P < 0.01, ***P < 0.001.
Fig. 6
Fig. 6
Checkerboard assay to study interactions between primary antibiotics and selected sirtuin inhibitors. hMDMs infected with H37Rv-GFP were treated with (A) RIF or (B) INH using sub-inhibitory concentrations (0.001, 0.01 and 0.1 µg/ml) in combination with a fixed dose (1 µM) of tenovin, suramin, salermide or cambinol. Data assessed with IncuCyte at day 3 is presented in bar graphs (mean and standard error) from n = 4 donors and was analyzed using a two-way RM ANOVA and Tukey´s multiple comparisons test. The dotted lines indicate 50% intracellular Mtb growth. *P < 0.05, **P < 0.01.
Fig. 7
Fig. 7
Multiplex RNA profiling of Mtb-infected macrophages treated with PBA or selected sirtuin inhibitors. Uninfected (white bars) and H37Rv-infected hMDMs (MOI5) (grey bars) were treated with medium only (Control or MOI5), PBA, tenovin (Ten), suramin (Sur), salermide (Sal) or cambinol (Cam) and assessed for mRNA expression of (A) IL-1β, (B) IL-6, (C) TNFα, (D) IL-8 (CXCL8), (E) CCL4, (F) CCL5, (G) SOCS-3, (H) PTGS-2 (COX2), (I) IL-10, (J) NFκB, (K) CAMP (LL-37), and (L) TLR2. Data assessed with Taqman array cards at 24 h is presented in box and whiskers graphs (median and min/max) from n = 5 donors (n = 3–4 donors for uninfected groups) and was analyzed using a Friedman and Dunn´s multiple comparisons test (Mtb-infected groups only). mRNA fold change in uninfected and untreated cells was set to 1. mRNA levels that are not visible in uninfected cells (A, B, D and H) due to a large fold induction in matched Mtb-infected cells, were in the range of 0-10-fold as compared to untreated and uninfected cells. *P < 0.05, **P < 0.01.

References

    1. Dartois, V. A. & Rubin, E. J. Anti-tuberculosis treatment strategies and drug development: challenges and priorities. Nat. Rev. Microbiol.20, 685–701. 10.1038/s41579-022-00731-y (2022). - PMC - PubMed
    1. Barilar, I. et al. Emergence of bedaquiline-resistant tuberculosis and of multidrug-resistant and extensively drug-resistant Mycobacterium tuberculosis strains with rpoB Ile491Phe mutation not detected by Xpert MTB/RIF in Mozambique: a retrospective observational study. Lancet Infect. Dis.24, 297–307. 10.1016/S1473-3099(23)00498-X (2024). - PubMed
    1. Rao, M. et al. Improving treatment outcomes for MDR-TB - Novel host-directed therapies and personalised medicine of the future. Int. J. Infect. Dis.80S, S62–S67. 10.1016/j.ijid.2019.01.039 (2019). - PubMed
    1. Young, C. & Walzl, G. Du Plessis, N. Therapeutic host-directed strategies to improve outcome in tuberculosis. Mucosal Immunol.13, 190–204. 10.1038/s41385-019-0226-5 (2020). - PMC - PubMed
    1. Yang, J., Zhang, L., Qiao, W. & Luo, Y. Mycobacterium tuberculosis: Pathogenesis and therapeutic targets. MedComm (2020). 4, e353. 10.1002/mco2.353 (2023). - PMC - PubMed

MeSH terms

LinkOut - more resources