. 2025 Jan;44(1):1-29.
doi: 10.1038/s44318-024-00298-9. Epub 2024 Nov 15.

Differentiation signals induce APOBEC3A expression via GRHL3 in squamous epithelia and squamous cell carcinoma

Affiliations

Differentiation signals induce APOBEC3A expression via GRHL3 in squamous epithelia and squamous cell carcinoma

Nicola J Smith et al. EMBO J. 2025 Jan.

Abstract

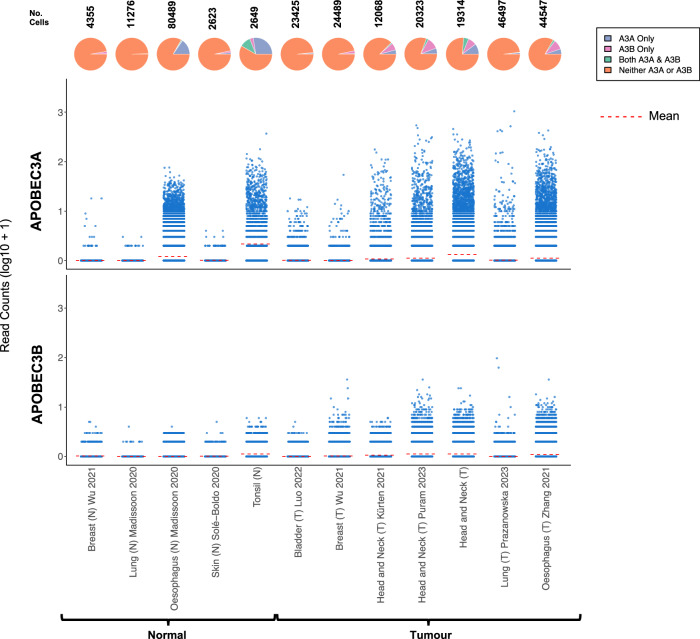
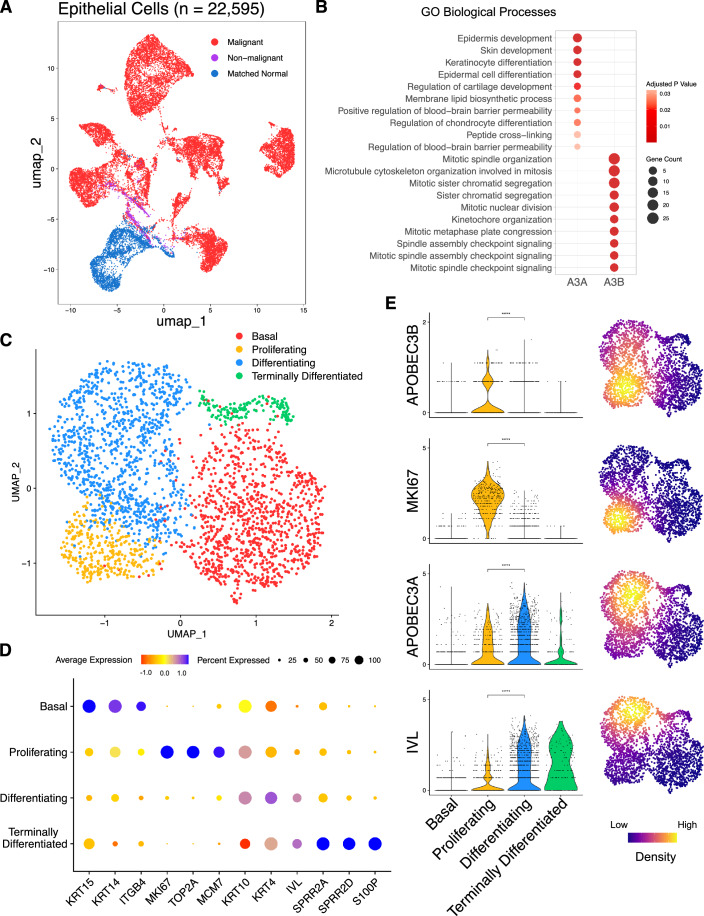
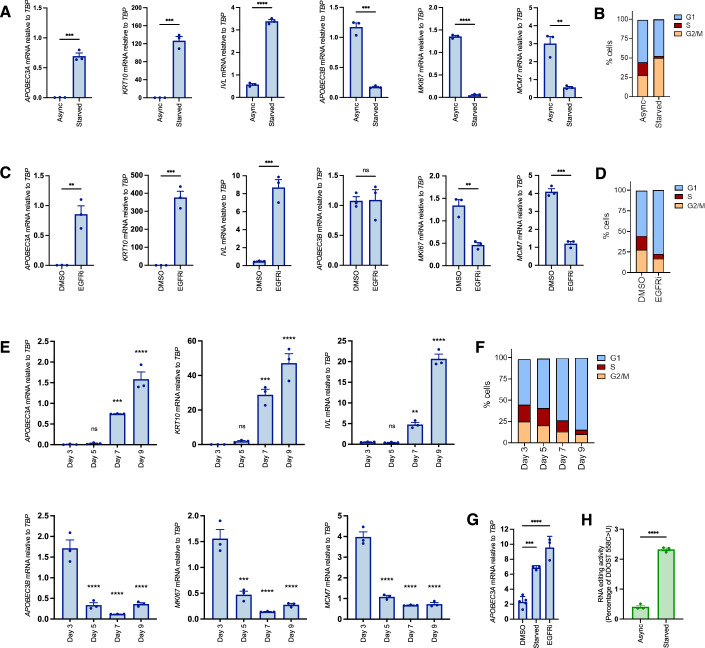
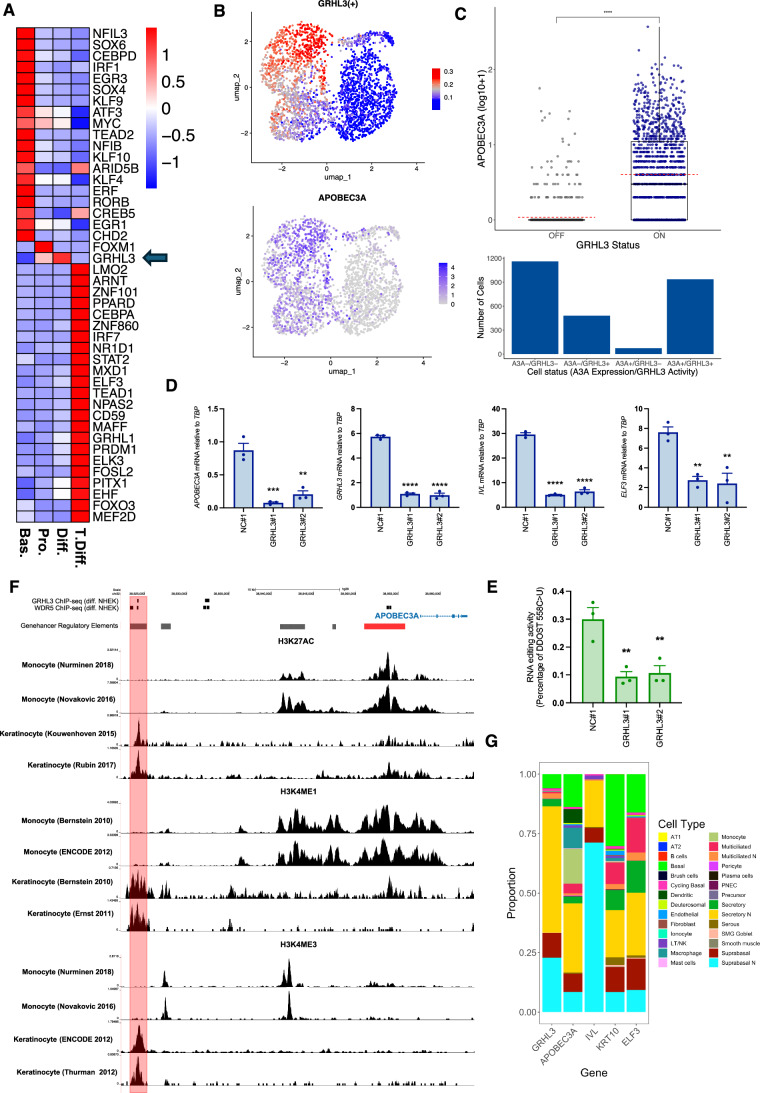
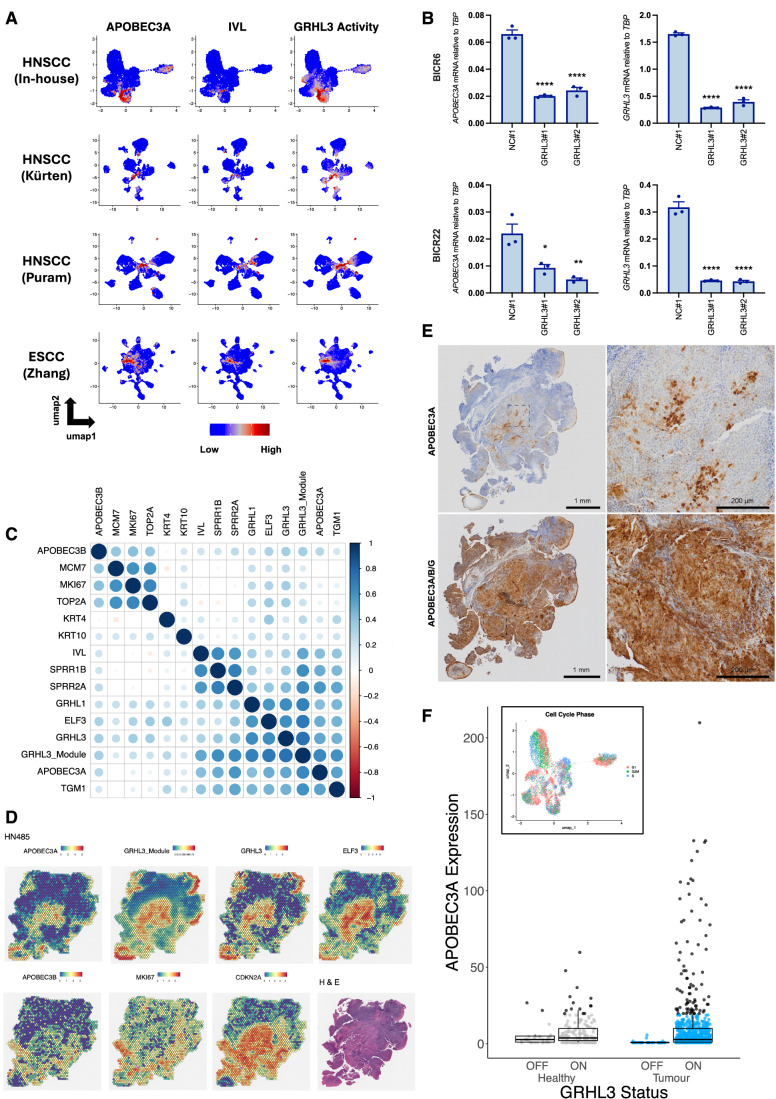
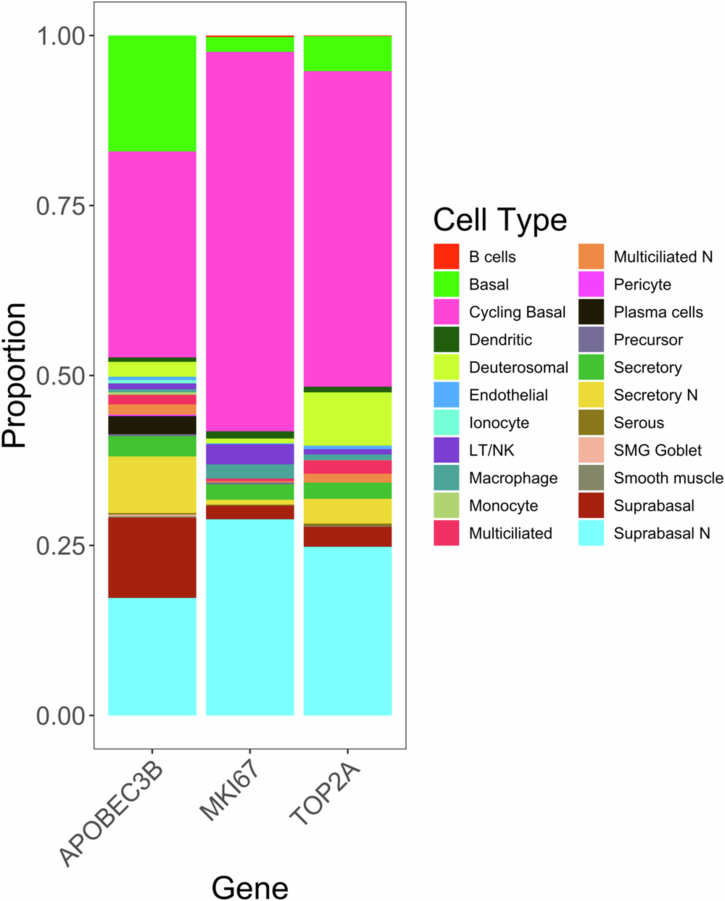
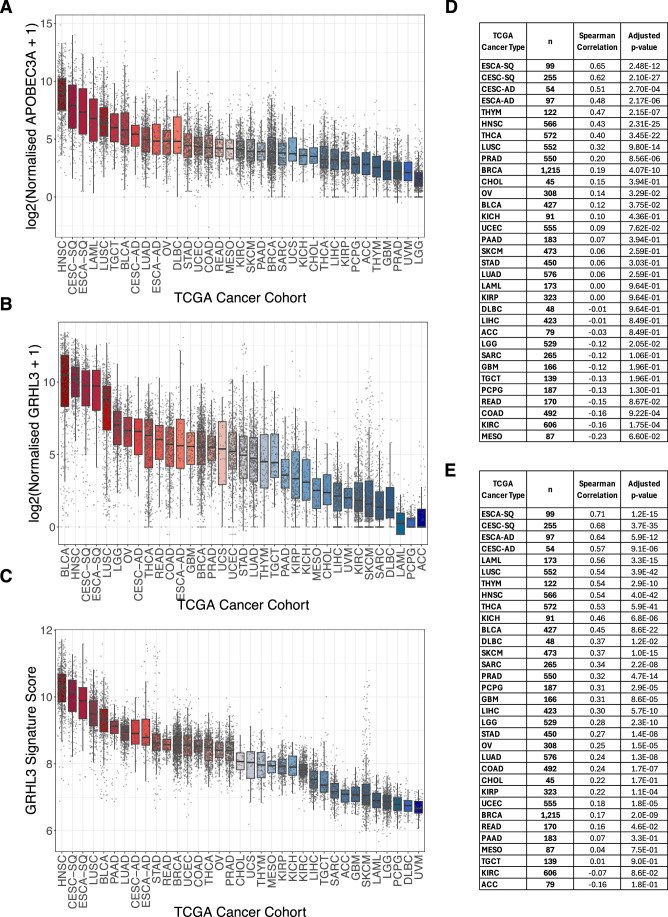
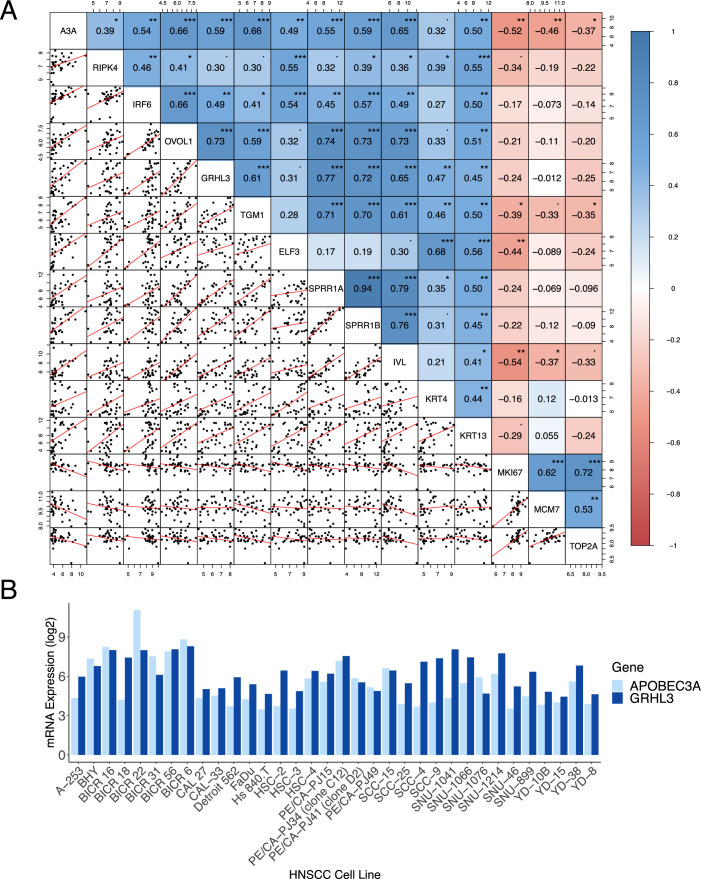
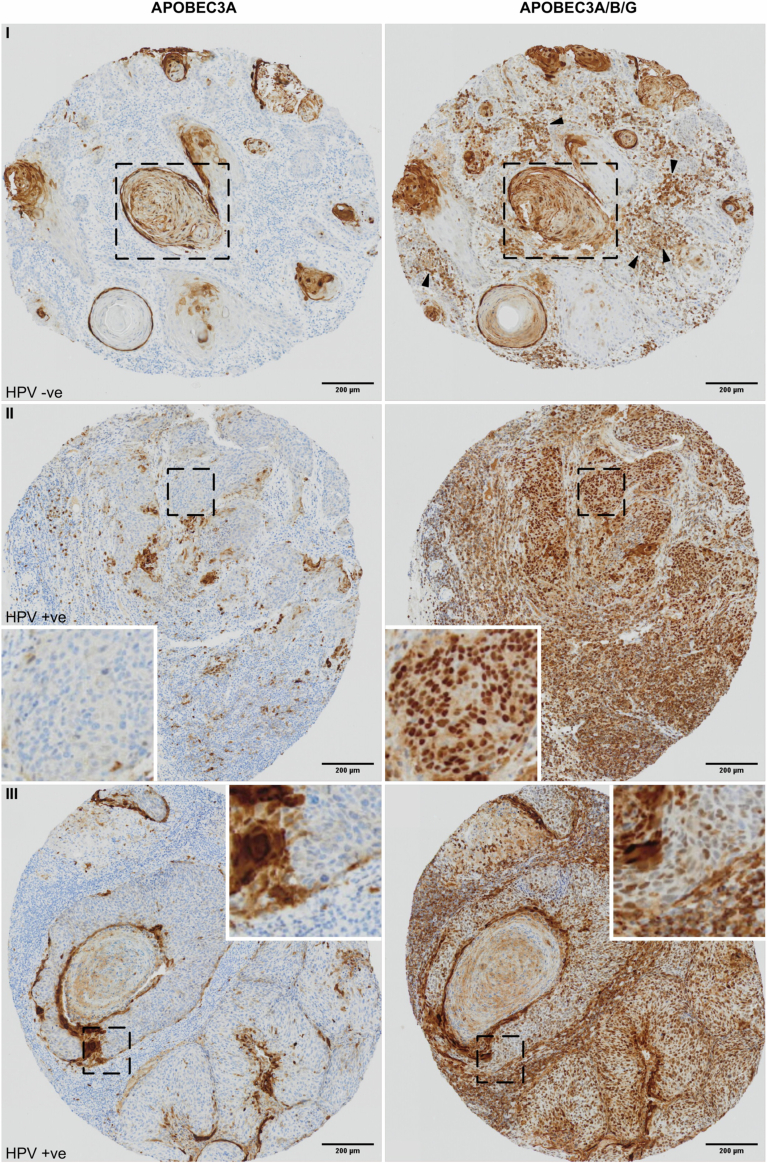
Two APOBEC DNA cytosine deaminase enzymes, APOBEC3A and APOBEC3B, generate somatic mutations in cancer, thereby driving tumour development and drug resistance. Here, we used single-cell RNA sequencing to study APOBEC3A and APOBEC3B expression in healthy and malignant mucosal epithelia, validating key observations with immunohistochemistry, spatial transcriptomics and functional experiments. Whereas APOBEC3B is expressed in keratinocytes entering mitosis, we show that APOBEC3A expression is confined largely to terminally differentiating cells and requires grainyhead-like transcription factor 3 (GRHL3). Thus, in normal tissue, neither deaminase appears to be expressed at high levels during DNA replication, the cell-cycle stage associated with APOBEC-mediated mutagenesis. In contrast, in squamous cell carcinoma we find that, there is expansion of GRHL3expression and activity to a subset of cells undergoing DNA replication and concomitant extension of APOBEC3A expression to proliferating cells. These findings suggest that APOBEC3A may play a functional role during keratinocyte differentiation, and offer a mechanism for acquisition of APOBEC3A mutagenic activity in tumours.

Keywords: APOBEC3A; Cancer Mutagenesis; GRHL3; HNSCC; Keratinocyte.


Conflict of interest statement

Disclosure and competing interests statement. TRF is an advisory board member of and holds stock options in APOBEC Discovery Ltd.

Figures

Figure 1
Figure 1. APOBEC3A and APOBEC3B expression in scRNA-seq datasets representing normal and tumour epithelial cells from tissues in which cancers that display prominent APOBEC mutational signatures arise.
The number above each pie chart represents the total number of epithelial cells in each dataset. The references for each dataset are provided in Table EV2.
Figure 2
Figure 2. APOBEC3A and APOBEC3B are expressed in different subsets of tonsillar epithelial cells.
(A) UMAP projection of 22,595 epithelial cells from oropharyngeal squamous cell carcinoma samples (n = 10; 18,619 malignant cells (red), 695 non-malignant cells (purple)), and matched normal tonsil (n = 7; 3281 cells (blue)). (B) GOBP terms enriched amongst the sets of 100 genes that were co-expressed with either APOBEC3A or APOBEC3B in 2649 (after QC) epithelial cells from normal tonsil. Terms ranked by P value calculated by EnrichR package (Fisher Exact test bias corrected using the z-score of the deviation from the expected rank). (C) UMAP projection depicting four phenotypes (basal, proliferating, differentiating, terminally differentiated) displayed by the normal tonsillar epithelial cells in our dataset. (D) Marker genes are used to identify the four epithelial phenotypes represented in (C). (E) Violin plots of gene expression in individual tonsillar epithelial cells, and UMAP projections of the density of gene expression in the tonsillar epithelial subtypes. (****P < 0.0001, Wilcoxon’s rank-sum test; Basal, n = 1047; Proliferating, n = 353; Differentiating, n = 1091; Terminally differentiated, n = 158).
Figure 3
Figure 3. Keratinocyte cell cycle exit and initiation of differentiation is marked by a switch from APOBEC3B to APOBEC3A expression.
(A) qRT-PCR-based gene expression measurements (n = 3) for APOBEC3A (P = 0.0002), KRT10 (P = 0.0002), IVL (P < 0.0001), APOBEC3B (P = 0.0001), MKI67 (P < 0.0001) and MCM7 (P = 0.0033) in proliferating NIKS (Async) or following 48 h of growth factor deprivation (Starved). (B) Representative cell cycle profiles of Async and starved NIKS measured by PI staining and flow cytometry. (C) qRT-PCR-based gene expression measurements (n = 3) for APOBEC3A (P = 0.0036), KRT10 (P = 0.0004), IVL (P = 0.0007), APOBEC3B (P = 0.9445), MKI67 (P = 0.0032) and MCM7 (P = 0.0001) following 24 h of vehicle control (DMSO) or 100 nM afatinib treatment (EGFRi). (D) Representative cell cycle profiles of DMSO and afatinib-treated NIKS measured by PI staining and flow cytometry. (E) qRT-PCR-based gene expression measurements (n = 3) for APOBEC3A (adjusted P values versus day 3 measurement: day 5 = 0.9960; day 7 = 0.0009; day 9 <0.0001), KRT10 (adjusted P values versus day 3 measurement: day 5 = 0.9518; day 7 = 0.0005; day 9 <0.0001), IVL (adjusted P values versus day 3 measurement: day 5 = 0.9983; day 7 = 0.0035; day 9 <0.0001), APOBEC3B (adjusted P values versus day 3 measurement: day 5 <0.0001; day 7 <0.0001; day 9 <0.0001), MKI67 (adjusted P values versus day 3 measurement: day 5 = 0.0001; day 7 <0.0001; day 9 <0.0001) and MCM7 (adjusted P values versus day 3 measurement: day 5 <0.0001; day 7 <0.0001; day 9 <0.0001) in NIKS collected 3, 5, 7, or 9 days after plating. (F) Representative cell cycle profiles of NIKS collected 3, 5, 7, or 9 days after plating were measured by PI staining and flow cytometry. (G) qRT-PCR measurements of APOBEC3A expression in primary human epidermal keratinocytes (NHEK) growing in FC medium and treated for 24 h with vehicle control (DMSO) or 100 nM afatinib (EGFRi, P < 0.0001) or following growth factor deprivation for 48 h (Starved, P = 0.0003). (H) Percentage of DDOST transcripts that were C > U edited at c558 in asynchronous growing NIKS (Async) and following 48 h of growth factor withdrawal (starved) measured by digital PCR assay (n = 3; P < 0.0001). Error bars = SEM. *P < 0.05; **P < 0.01; ***P < 0.001; ****P < 0.0001. Pairwise comparisons were performed using unpaired two-tailed t-tests in (A, C, H). Comparisons of mRNA levels on days 5, 7 and 9 to day 3 in (E), and of mRNA levels in starved and afatinib-treated cells to DMSO-treated cells in (G) were performed using one-way ANOVA with Dunnett’s multiple comparisons test. Source data are available online for this figure.
Figure 4
Figure 4. Grainyhead-like transcription factor 3 is required for APOBEC3A expression during keratinocyte differentiation.
(A) Heatmap showing those transcription factors (of the 363 with a SCENIC activity score in our scRNA-seq dataset from healthy tonsil epithelium) that were differentially active (fold change >1.1, adjusted P < 0.05, Wilcoxon rank-sum test) between the clusters defined in Fig. 2C (Bas. basal; Pro. proliferating; Diff. differentiating; T.Diff. terminally differentiated). (B) UMAPs showing GRHL3 transcription factor activity score from SCENIC (top) and APOBEC3A expression (bottom) in the Southampton scRNA-seq dataset from healthy tonsil epithelium. (C) Boxplot showing APOBEC3A expression stratified by SCENIC binary predictions of GRHL3 ‘off’ or GRHL3 ‘on’ (top; (****P < 0.0001, Wilcoxon’s rank-sum test)) and histogram showing the number of cells in each of four groups: GRHL3 ‘off’, no detectable APOBEC3A (A3A-/GRHL3-), n = 1,160; GRHL3 ‘on’, no detectable APOBEC3A (A3A-/GRHL3+), n = 480; GRHL3 ‘off’, APOBEC3A expressed (A3A + /GRHL−), n = 73, and GRHL3 ‘on’, APOBEC3A expressed (A3A + /GRHL3+), n = 936 (bottom). The top, middle and bottom lines of the boxplot represent the upper quartile (Q3), median, and lower quartile (Q1), respectively. The maximum value represented by the top whisker represents the highest observed data point within Q3 + (1.5 × (Q3 − Q1)), and the minimum value represented by the bottom whisker represents the lowest situated point within Q1 − (1.5 × (Q3 − Q1)). The dashed red line represents the mean. (D) qRT-PCR-based expression measurements (n = 3) of APOBEC3A, GRHL3, IVL and ELF3 in NIKS transfected with control (NC#1) or GRHL3-specific siRNAs as indicated. Adjusted P values for comparisons between NC#1 and GRHL3 siRNA #1: APOBEC3A = 0.0004; GRHL3 <0.0001; IVL <0.0001; ELF3 = 0.0072. Adjusted P values for comparisons between NC#1 and GRHL3 siRNA #2: APOBEC3A = 0.0012; GRHL3 <0.0001; IVL <0.0001; ELF3 = 0.0052. Cells were treated with 100 nM afatinib for 24 h prior to harvesting to induce differentiation. (E) Percentage of DDOST transcripts that were C > U edited at c558 in NIKS transfected with control (NC#1) or GRHL3-specific siRNAs as indicated (n = 3). Adjusted P values: NC#1 vs GRHL3 siRNA #1 = 0.0072; NC#1 vs GRHL3 siRNA #2 = 0.0099. Gene expression (D) and DDOST editing (E) in GRHL3 siRNA-transfected cells were compared with control siRNA-transfected cells using one-way ANOVA with Tukey’s multiple comparisons test (error bars represent SEM; **P < 0.01, ***P < 0.001 and ****P < 0.0001). (F) ChIP-seq data for GHRL3, WDR5, H3K27Ac, H3K4Me1 and H3K4Me3 from keratinocytes and or monocytes and GeneHancer predicted regulatory regions (grey = enhancer, red = promoter) as indicated, spanning the APOBEC3A gene and a 33 kb region upstream of the TSS (see main text for references to the datasets). (G) Stacked barplot showing the proportion of each cell type in the single-cell atlas of healthy human airways from Deprez et al that express each selected gene. Source data are available online for this figure.
Figure 5
Figure 5. GRHL3 regulates APOBEC3A expression in squamous cell carcinoma.
(A) UMAPs heatmap showing gene expression of APOBEC3A and IVL and predicted activity of GRHL3 in scRNA-seq data from four independent tumour cohorts (three HNSCC and one ESCC). (B) qRT-PCR-based gene expression measurements of APOBEC3A and GRHL3 in sub-confluent BICR6 (top row) and BICR22 (bottom row) HNSCC cells transfected with control (NC#1) or GRHL3-specific siRNAs as indicated. Adjusted P values: NC#1 vs GRHL3 siRNA #1 (APOBEC3A: BICR6 <0.0001; BICR22 = 0.0145; GRHL3: BICR6 <0.0001; BICR22 <0.0001); NC#1 vs GRHL3 siRNA #2 (APOBEC3A: BICR6 <0.0001; BICR22 = 0.0035; GRHL3: BICR6 <0.0001; BICR22 <0.0001). Gene expression in GRHL3 siRNA-transfected cells was compared with control siRNA-transfected cells using one-way ANOVA with Tukey’s multiple comparisons test (n = 3; error bars represent SEM; ****P < 0.0001; **P < 0.01 and *P < 0.05). (C) matrix showing the relationship between expression of the indicated genes in spatial transcriptomics data from the Southampton HNSCC cohort obtained using the Visium platform (10X Genomics). (D) Images displaying expression levels (Visium spot intensities) of selected genes in HN485, an HPV+ve HNSCC case from the Southampton cohort. (E) Immunohistochemistry with an antibody specific for APOBEC3A (left) and with an antibody that cross-reacts with APOBEC3A, APOBEC3B and APOBEC3G (right) in sections from the same tissue block from HN485 used for the Visium profiling displayed in part D. (F) Boxplot showing expression of APOBEC3A in those cells predicted to be in S-phase in normal tonsil and HNSCC, stratified by binary GRHL3 activity score (on/off). Cells shown in black are outliers relative to the distribution of expression in the cells from healthy tonsils. Inset: UMAP showing the predicted cell cycle phase for each cell in the Southampton HNSCC scRNA-seq dataset. The top, middle and bottom lines of the boxplot represent the upper quartile (Q3), median, and lower quartile (Q1), respectively. The maximum value represented by the top whisker represents the highest observed data point within Q3 + (1.5 × (Q3 − Q1)), and the minimum value represented by the bottom whisker represents the lowest situated point within Q1 − (1.5 × (Q3 − Q1)). Healthy GRHL3 ‘OFF’, n = 19; Healthy GRHL3 ‘ON’, n = 173; Tumour GRHL3 ‘OFF’, n = 98; Tumour GRHL3 ‘ON’, n = 620. Source data are available online for this figure.
Figure EV1
Figure EV1. APOBEC3B is predominantly co-expressed with proliferation markers MKI67 and MCM7 in cycling basal and suprabasal cells of the healthy human airway.
Stacked barplot showing the proportion of each cell type in the single cell atlas of healthy human airways from Deprez et al that express each selected gene.
Figure EV2
Figure EV2. APOBEC3A and GRHL3 expression by cancer type in TCGA bulk RNA-seq data.
(A) Boxplot ranked from highest median (left) to lowest median (right) for APOBEC3A gene expression. (B) Boxplot ranked from highest median (left) to lowest median (right) for GRHL3 gene expression. (C) Boxplot ranked from highest median (left) to lowest median (right) for GRHL3 signature score based on the mean expression of 127 GRHL3 target genes identified in scRNA-seq SCENIC analysis. Each dot represents an individual tumour sample. (D) Spearman correlation coefficients for APOBEC3A and GRHL3 expression in TCGA RNA-seq data. (E) Spearman correlation coefficients for APOBEC3A expression and GRHL3 signature score in TCGA RNA-seq data. ESCA and CESC were stratified into squamous cell (SQ) and adeno- (AD) carcinomas. For all boxplots, the top, middle and bottom lines of the boxplot represent the upper quartile (Q3), median, and lower quartile (Q1), respectively. The maximum value represented by the top whisker represents the highest observed data point within Q3 + (1.5 × (Q3 − Q1)), and the minimum value represented by the bottom whisker represents the lowest situated point within Q1 − (1.5 × (Q3 − Q1)).
Figure EV3
Figure EV3. APOBEC3A is positively correlated with differentiation marker genes and negatively correlated with proliferation marker genes in HNSCC cell lines.
(A) Spearman’s correlation of APOBEC3A expression with the expression of differentiation marker genes, proliferation marker genes, and genes of the RIPK4 pathway in 34 HNSCC cell lines from the CCLE. P values calculated by T-test: ***P < 0.0001; **P < 0.001; *P < 0.05; P < 0.1. (B) Log2 expression levels of APOBEC3A and GRHL3 in the 34 individual HNSCC cell lines from the CCLE. Accompanies Fig. 5.
Figure EV4
Figure EV4. Detection of APOBEC3A and APOBEC3B protein expression in HNSCC.
Representative images from an HNSCC tissue microarray stained with APOBEC3A-specific (left panels) or APOBEC3A/B/G-specific (right panels) antibodies. Accompanies Fig. 5.

Update of

References

    1. Aibar S, González-Blas CB, Moerman T, Huynh-Thu VA, Imrichova H, Hulselmans G, Rambow F, Marine JC, Geurts P, Aerts J et al (2017) SCENIC: single-cell regulatory network inference and clustering. Nat Methods 14:1083–1086 - PMC - PubMed
    1. Alexandrov LB, Nik-Zainal S, Wedge DC, Aparicio SAJR, Behjati S, Biankin AV, Bignell GR, Bolli N, Borg A, Børresen-Dale A-L et al (2013) Signatures of mutational processes in human cancer. Nature 500:415–421 - PMC - PubMed
    1. Allen-Hoffmann BL, Schlosser SJ, Ivarie CAR, Meisner LF, O’Connor SL, Sattler CA (2000) Normal growth and differentiation in a spontaneously immortalized near-diploid human keratinocyte cell line, NIKS. J Invest Dermatol 114:444–455 - PubMed
    1. Aynaud M-M, Suspène R, Vidalain P-O, Mussil B, Guétard D, Tangy F, Wain-Hobson S, Vartanian J-P (2012) Human tribbles 3 protects nuclear DNA from cytidine deamination by APOBEC3A. J Biol Chem 287:39182–39192 - PMC - PubMed
    1. Barretina J, Caponigro G, Stransky N, Venkatesan K, Margolin AA, Kim S, Wilson CJ, Lehár J, Kryukov GV, Sonkin D et al (2012) The Cancer Cell Line Encyclopedia enables predictive modelling of anticancer drug sensitivity. Nature 483:603–607 - PMC - PubMed

MeSH terms