. 2024 Nov 15;8(1):262.
doi: 10.1038/s41698-024-00752-1.

Single cell-spatial transcriptomics and bulk multi-omics analysis of heterogeneity and ecosystems in hepatocellular carcinoma

Affiliations

Single cell-spatial transcriptomics and bulk multi-omics analysis of heterogeneity and ecosystems in hepatocellular carcinoma

Jiazhou Ye et al. NPJ Precis Oncol. .

Abstract

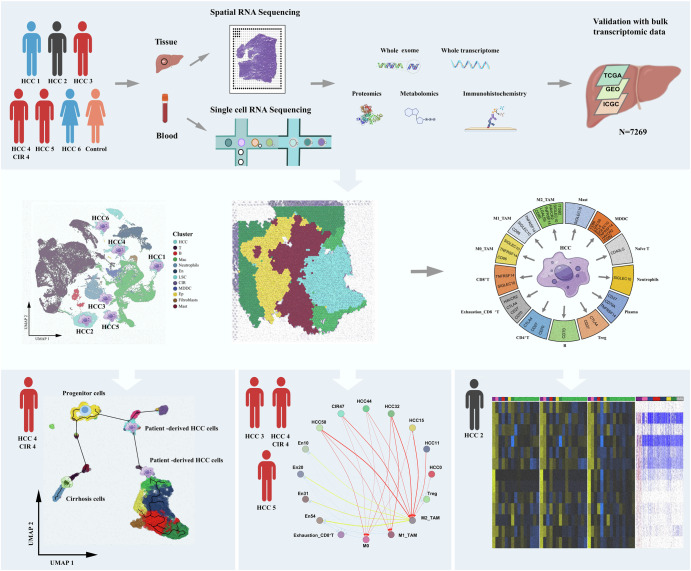
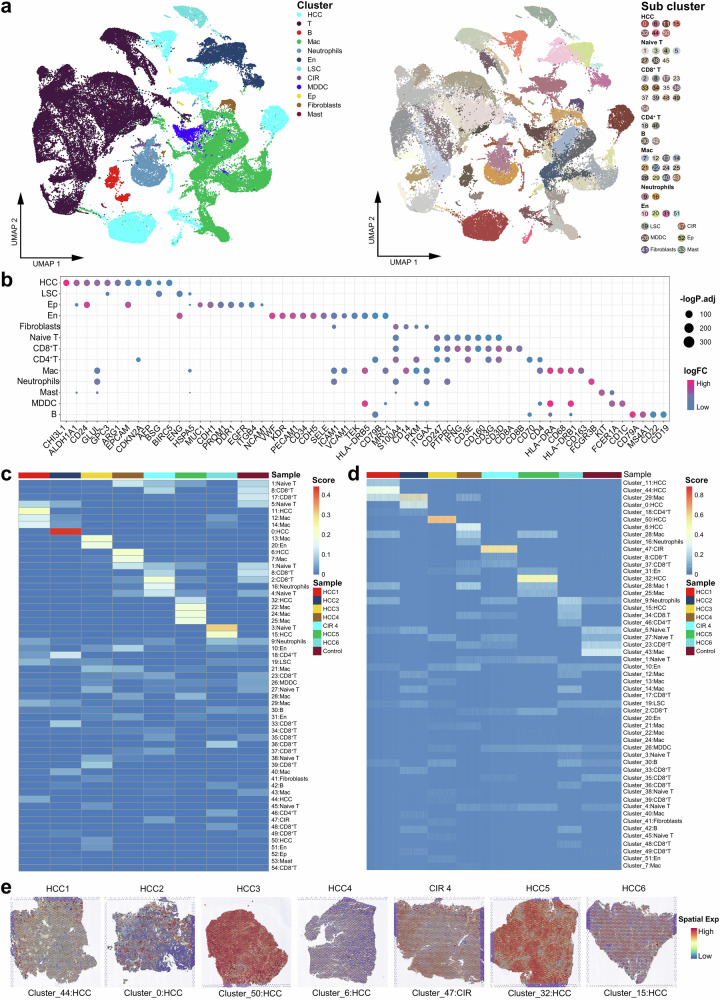
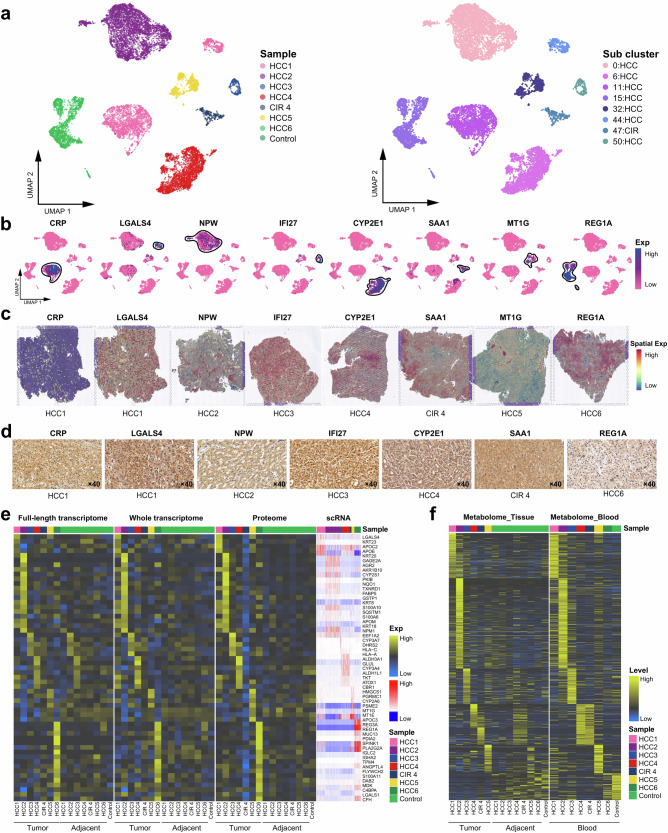
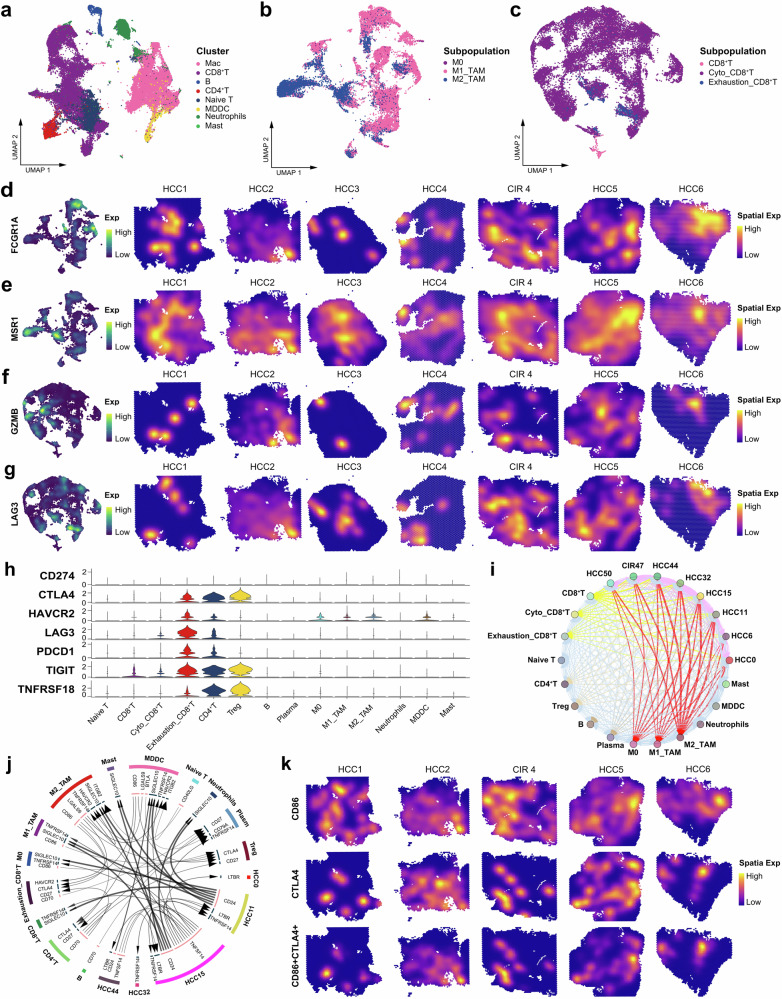
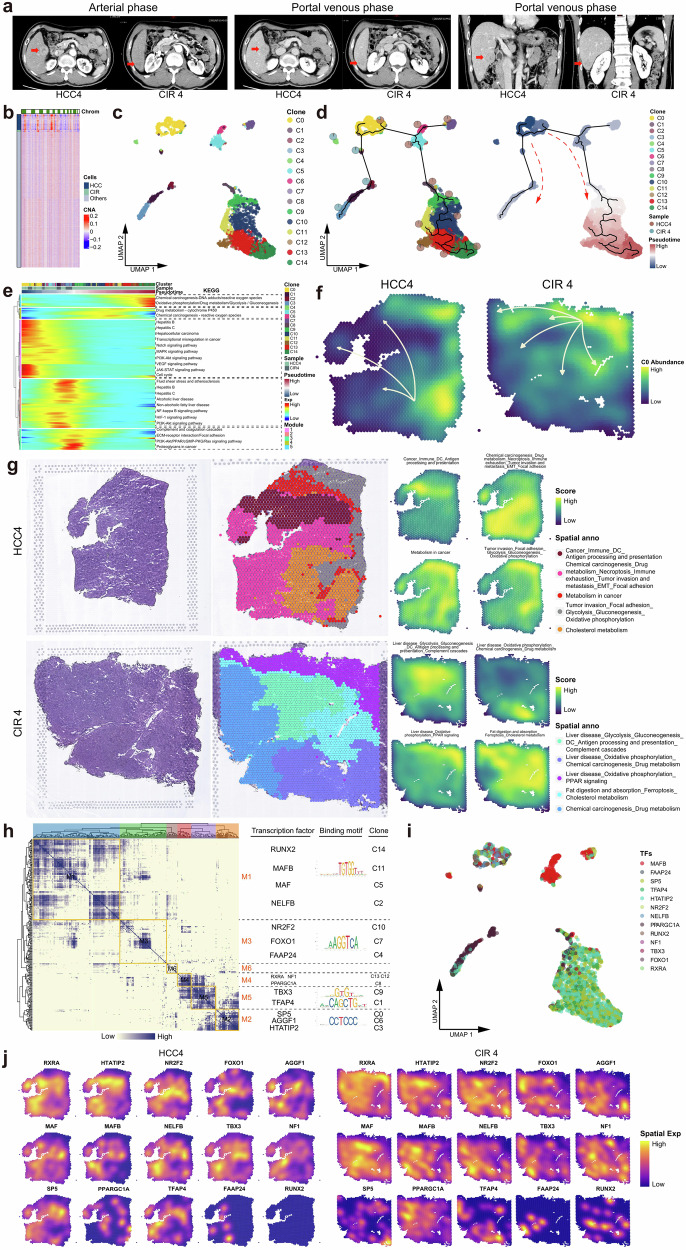
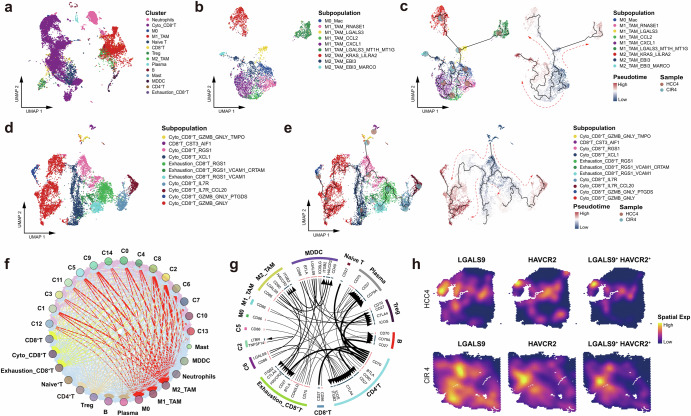
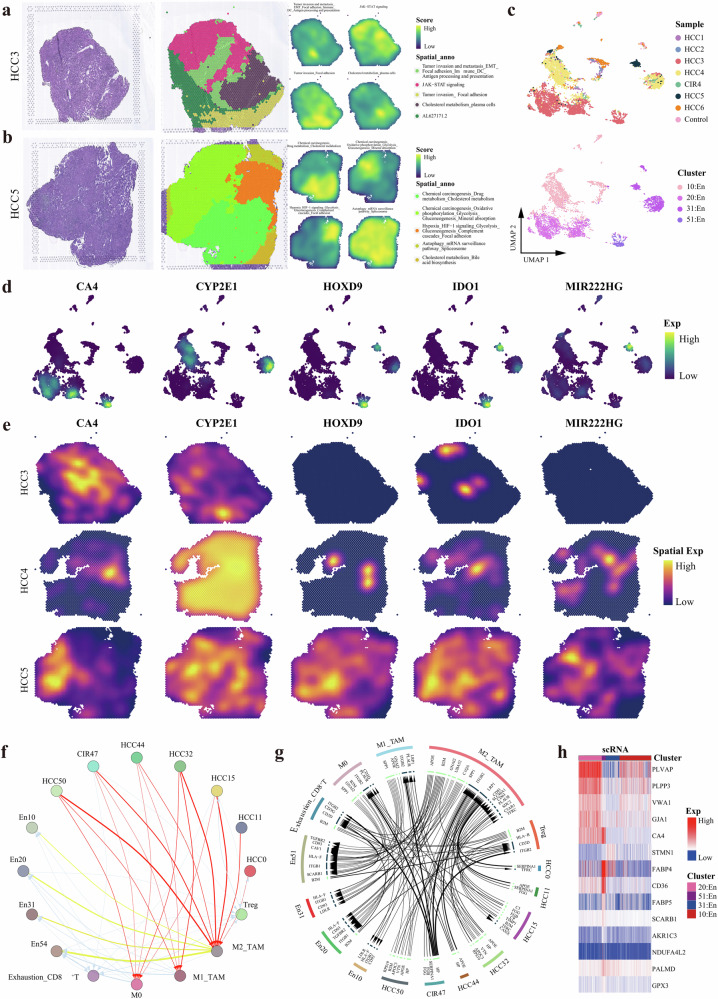
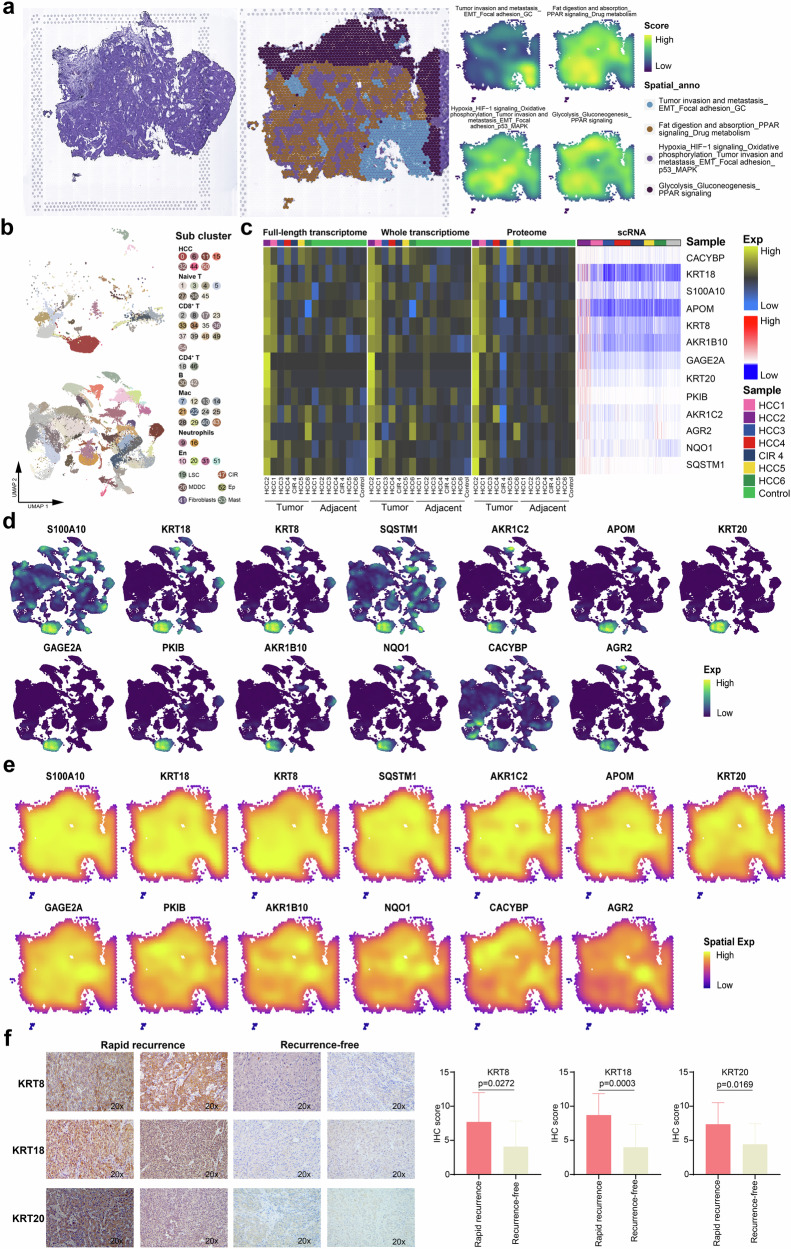
This study profiled global single cell-spatial-bulk transcriptome landscapes of hepatocellular carcinoma (HCC) ecosystem from six HCC cases and a non-carcinoma liver control donor. We discovered that intratumoral heterogeneity mainly derived from HCC cells diversity and pervaded the genome-transcriptome-proteome-metabolome network. HCC cells are the core driving force of taming tumor-associated macrophages (TAMs) with pro-tumorigenic phenotypes for favor its dominant growth. Remarkably, M1-types TAMs had been characterized by disturbance of metabolism, poor antigen-presentation and immune-killing abilities. Besides, we found simultaneous cirrhotic and HCC lesions in an individual patient shared common origin and displayed parallel clone evolution via driving disparate immune reprograms for better environmental adaptation. Moreover, endothelial cells exhibited phenotypically conserved but executed differential functions in a space-dependent manner. Further, the spatiotemporal traits of rapid recurrence niche genes were identified and validated by immunohistochemistry. Our data unravels the great significance of HCC cells in shaping vibrant tumor ecosystems corresponding to clinical scenarios.


Conflict of interest statement

Competing interests The authors declare no competing interests.

Figures

Fig. 1
Fig. 1
Single cell-spatial-bulk multi-omics analysis profiled the global heterogeneity landscapes and spatiotemporal dynamic evolution of the ecosystem in HCC.
Fig. 2
Fig. 2. Spatiotemporal globe landscapes of the ecosystem in HCC, cirrhosis, and non-carcinoma liver.
a Uniform Manifold Approximation and Projection (UMAP) plot showing the cell types in all the study samples, with different color codes denoting different cell clusters (left) and subclusters (right). b Bubble chart showing the specific markers of each cell cluster. c Heatmap representing the proportions of different cell types of each study sample at the single-cell level. d Heatmap representing the proportions of different cell types of each study sample on the spatial resolution. e Spatial feature plot showing the specific cell clusters of each HCC and CIR lesion. See also Supplementary Fig. 1.
Fig. 3
Fig. 3. Spatiotemporal intratumor heterogeneities in HCC and cirrhosis.
a UMAP plot showing the HCC and CIR cell types, with different color-codes denoting lesions origin (left) and cell subclusters (right). b, c UMAP plot and spatial feature plots showing the distribution of specific markers on the cell subclusters from Fig. 2A (right). d Immunohistochemical validation of the expression of specific markers, the scale bars represent 20 μm. e Heatmap representing the average expression of specific markers of each cell subcluster at the full-length transcriptome, whole transcriptome, proteome, and scRNA levels. f Heatmap representing the levels of metabolic changes in the tissues and blood of HCC patients and control donor. See also Supplementary Table 1.
Fig. 4
Fig. 4. Spatiotemporal characteristics of the immune microenvironment in HCC and cirrhosis.
a UMAP plot showing the immune cell clusters in all the study samples, labeling in different colors. UMAP plot showing the subpopulations of macrophages (b) and CD8+ T cells (c) in all the study samples, labeling in different colors. UMAP plot and spatial feature plot showing the visualized distribution of specific markers for M1-TAMs (d) and M2-TAMs (e). UMAP plot and spatial feature plot showing the visualized distribution of specific markers for cytotoxic CD8+ T cells (f) and exhausted CD8+ T cells (g). h Violin plot showing the expression of immune checkpoints molecules on each immune cells. i Bubble plot showing the intercellular communications among HCC cell, CIR cell, and immune cell subpopulations, with each bubble denoting the cell identity and line thickness denoting the strength of intercellular interactions. j Circos plot showing the Intercellular communication network of HCC cell, CIR cell, and immune cell subpopulations with a high confidence level, with each arrow denoting the interaction between the source cell ligand and target cell receptor, and the arrow thickness denoting the number of ligand-receptor interaction pairs. k Spatial feature plot showing the distribution of the co-expression of CD86, CTLA4, and CD86+CTLA4. See also Supplementary Fig. 2, Supplementary Table 2 and Supplementary Table 3.
Fig. 5
Fig. 5. Parallel patterns of the evolution between HCC and cirrhosis.
a Contrast-enhanced CT images of simultaneous HCC and CIR lesions in Patient #4. b Heatmap profiling the chromosome copy number variation (CNV) of HCC, CIR, and other cells of Patient #4. c UMAP plot showing the subclusters of HCC4 and CIR4 cells, labeling in different colors. d UMAP plot showing the pseudo-time series evolutionary patterns of the subclusters of HCC4 and CIR4. Pie chart showing the proportions of HCC4 and CIR4 cells in each subclusters. Pseudo-time values (low to high) indicating the direction of sub-clonal evolution. e Heatmap representing the pseudo-time series of changes of differentially expressed genes in HCC4 and CIR4 subclusters. These genes were clustered into five modules, with each module participating in significantly different pathways. f Spatial feature plot showing the evolution patterns of HCC4 and CIR4 subclusters, with arrows indicating the direction of evolution. g H&E staining (left), and spatial cluster distribution of section (middle) labeled by colors, and density plots of specific gene sets of spatial cluster (right) for the HCC4 and CIR4, defined into different spatial blocks. (h) Heatmap representing the gene regulatory networks (GRNs) of HCC4 and CIR4 subclusters. Left: Identification of regulon modules based on the connection specificity index (CSI) matrix of regulons; Middle: Representative transcription factors (TFs) of modules and their binding motifs; Right: Relationships of modules with the HCC4 and CIR4 subclusters. i UMAP plot identifying the TFs that regulate HCC4 and CIR4 cell subclusters. j Spatial feature plot showing the distribution of TFs that regulate the HCC4 and CIR4 subclusters. See also Supplementary Table 4 and Supplementary Table 5.
Fig. 6
Fig. 6. Dynamic reprogramming of the immune microenvironment accompanying the evolution of HCC and cirrhosis.
a UMAP plot showing the immune cell clusters of HCC4 and CIR4, labeling in different colors. b UMAP plot showing the subpopulations of macrophages of HCC4 and CIR4, labeling in different colors. c Pseudo-time series of macrophages polarization in HCC4 and CIR4, Macrophages subpopulations are labeled by colors. Pie chart showing the proportion of macrophage subpopulations. d UMAP plot showing the CD8+ T cell subpopulations of HCC4 and CIR4, labeling in different colors. e Pseudo-time series of CD8+ T cell states in HCC4 and CIR4. CD8+ T cell subpopulations are labeled by colors. Pie chart showing the proportion of CD8+ T cells subpopulations. f Bubble plot showing the intercellular communications among the HCC cell, CIR cell, and immune cell subpopulations, with each bubble denoting the cell identity and line thickness denoting the strength of intercellular interactions. g Circos plot showing intercellular communication network of each HCC cell, CIR cell, and immune cell subpopulations with a high confidence level, with each arrow denoting the interaction between the source cell ligand and the target cell receptor, and the arrow thickness denoting the number of ligand-receptor interaction pairs. h Spatial feature plot showing the distribution of the co-expression of LGALS9, HAVCR2, and LGALS9+HAVCR2 in HCC4 and CIR4. See also Supplementary Fig. 3, Supplementary Table 6 and Supplementary Table 7.
Fig. 7
Fig. 7. Ecological niche of angiogenesis in HCC.
H&E staining(left), and spatial cluster distribution of section (middle) labeled by colors, and density plots of specific gene sets of spatial cluster (right) for HCC3 (a) and HCC5 (b), defined into different spatial blocks. c UMAP plot showing the endothelial cells for HCC3, HCC4 and HCC5, with different colors-codes denoting lesions origin (upper) and cell clusters (down). d UMAP plot showing the distribution of specific markers of each endothelial cell subclusters. e Spatial feature plots showing the expression of selected markers of each endothelial cell subclusters for HCC3, HCC4, and HCC5. f Bubble plot showing the intercellular communications among HCC cell, endothelial cell, and immune cell subpopulations, with each bubble denoting the cell identity and line thickness denoting the strength of intercellular interactions. g Circos plot showing intercellular communication network of each HCC cell, endothelial cell, and immune cell subpopulations with a high confidence level, with each arrow denoting the interaction between the source cell ligand and target cell receptor, and the arrow thickness denoting the number of ligand-receptor interaction pairs. h Heatmap representing the average expression of ecological niche genes of angiogenesis at the single-cell level. See also Supplementary Fig. 4 and Supplementary Table 8.
Fig. 8
Fig. 8. Ecological niche of early HCC recurrence.
a H&E staining(left), and spatial cluster distribution of section (middle) labeled by colors, and density plots of specific gene sets of spatial cluster (right) for HCC2, defined into different spatial blocks. b UMAP plot showing the cell subclusters of HCC2 (top) and other tissues (bottom), labeling in different colors. c Heatmap representing the expression of ecological niche genes of HCC recurrence at the full-length transcriptome, whole transcriptome, proteome, and single-cell RNA levels. d UMAP plot showing the distribution of ecological niche genes of HCC recurrence. e Spatial feature plots showing the distribution of the ecological niche genes of HCC recurrence in HCC2. f Immunohistochemical staining showing increased KRT8, KRT18, and KRT20 expressions in the resected tumors originated from the rapid recurrence HCC patients compared to the recurrence-free HCC patients, original magnification, ×200. See also Supplementary Fig. 5.

References

    1. Craig, A. J., von Felden, J., Garcia-Lezana, T., Sarcognato, S. & Villanueva, A. Tumour evolution in hepatocellular carcinoma. Nat. Rev. Gastroenterol. Hepatol.17, 139–152 (2020). - PubMed
    1. Nguyen, P. H. D. et al. Intratumoural immune heterogeneity as a hallmark of tumour evolution and progression in hepatocellular carcinoma. Nat. Commun.12, 227 (2021). - PMC - PubMed
    1. Qi, F. et al. Comprehensive metabolic profiling and genome-wide analysis reveal therapeutic modalities for hepatocellular carcinoma. Res.6, 0036 (2023). - PMC - PubMed
    1. Liang, R. et al. Mechanism and molecular network of RBM8A-mediated regulation of oxaliplatin resistance in hepatocellular carcinoma. Front. Oncol.10, 585452 (2020). - PMC - PubMed
    1. Kalasekar, S. M., VanSant-Webb, C. H. & Evason, K. J. Intratumor heterogeneity in hepatocellular carcinoma: challenges and opportunities. Cancers13, 10.3390/cancers13215524 (2021). - PMC - PubMed

LinkOut - more resources