. 2024 Dec;20(12):1346-1371.
doi: 10.1038/s44320-024-00073-2. Epub 2024 Nov 15.

Subcellular mRNA kinetic modeling reveals nuclear retention as rate-limiting

Affiliations

Subcellular mRNA kinetic modeling reveals nuclear retention as rate-limiting

David Steinbrecht et al. Mol Syst Biol. 2024 Dec.

Abstract

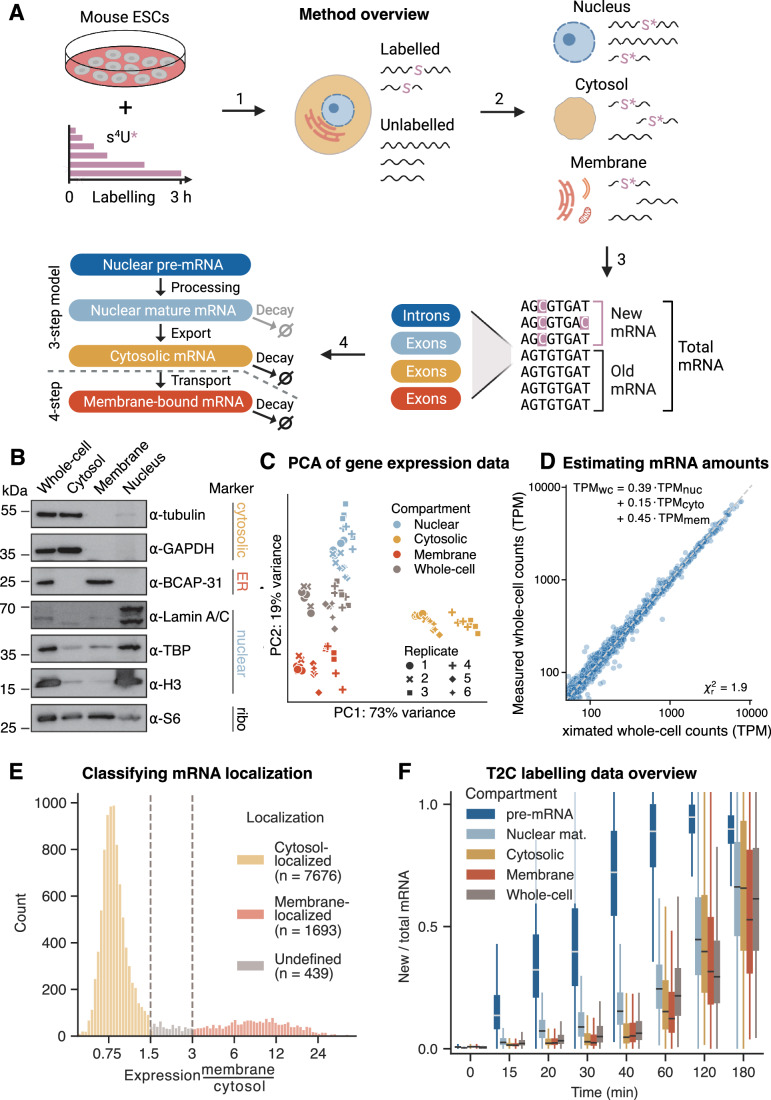
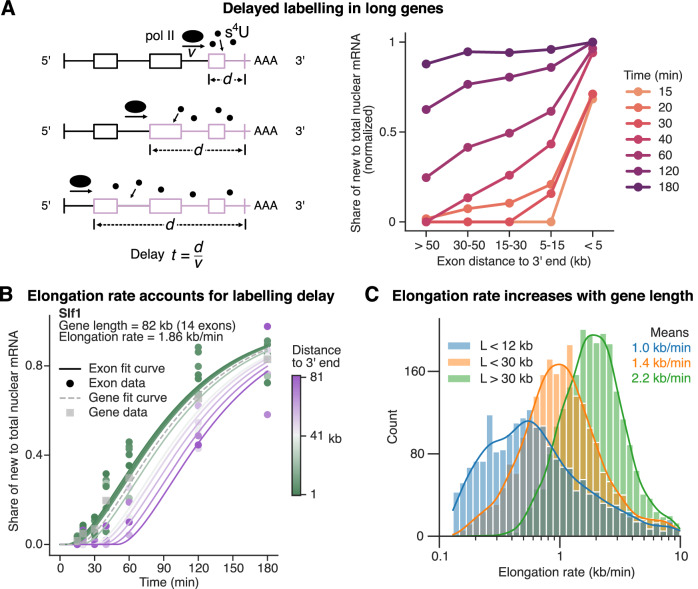
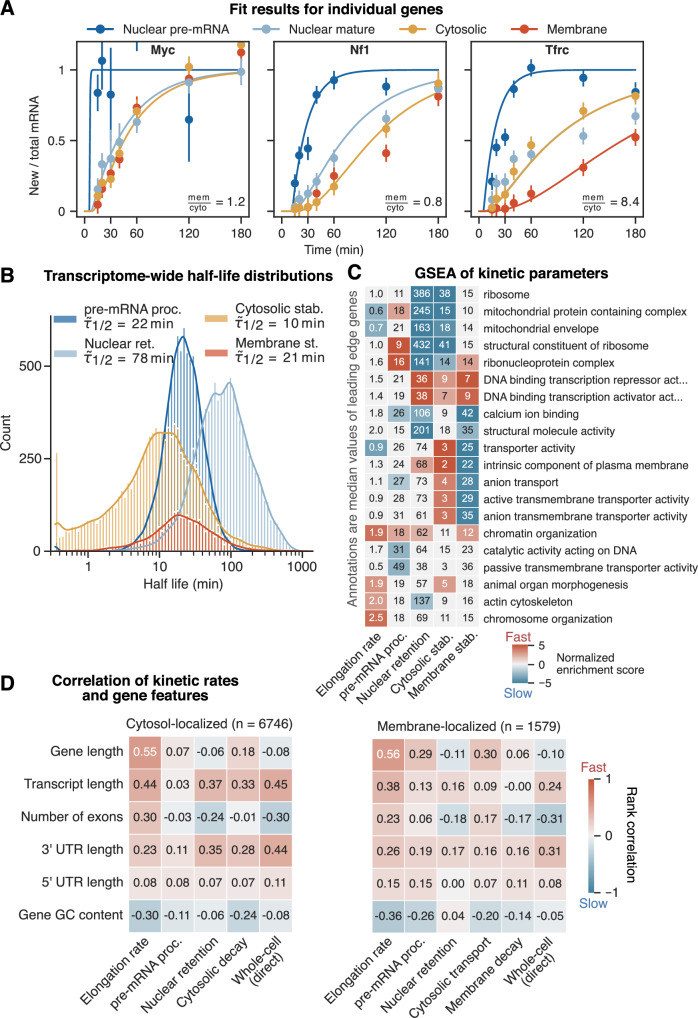
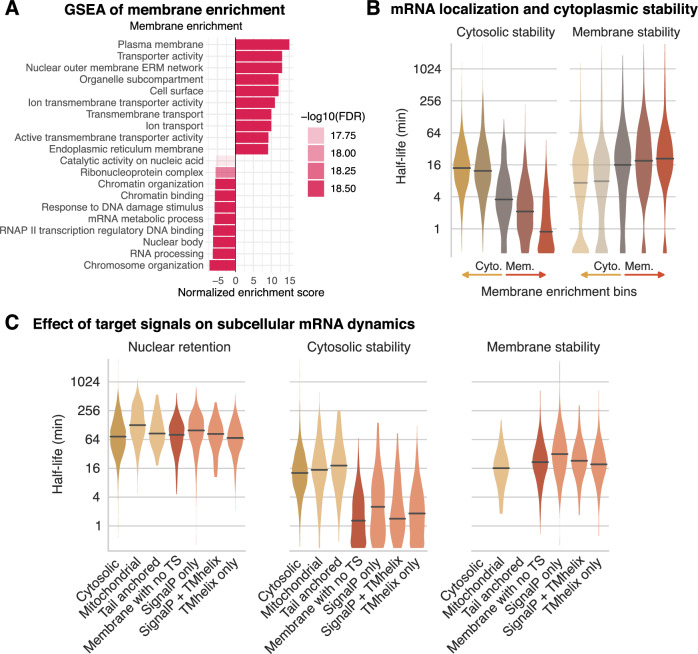
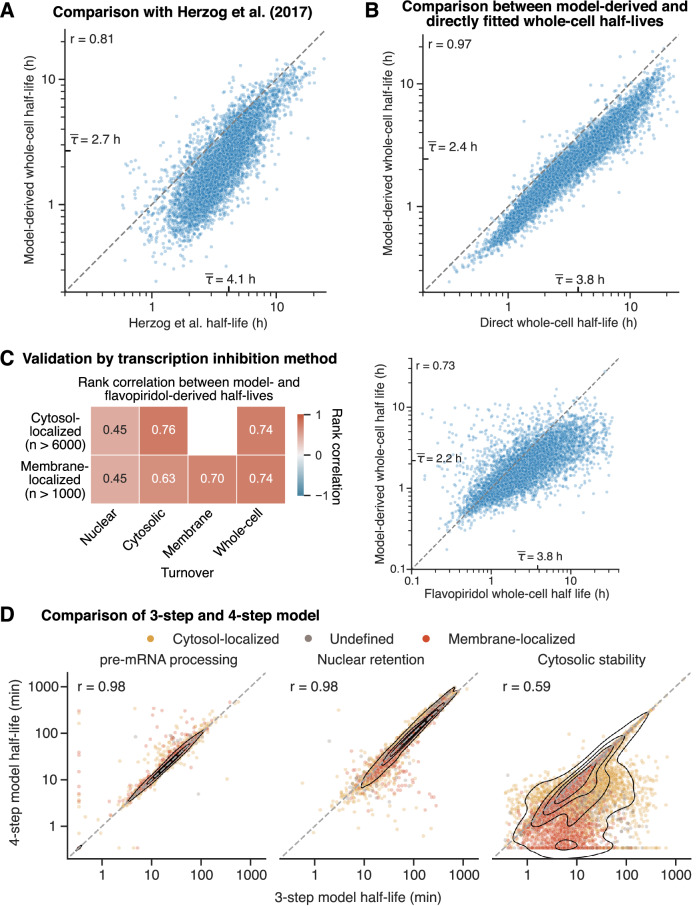
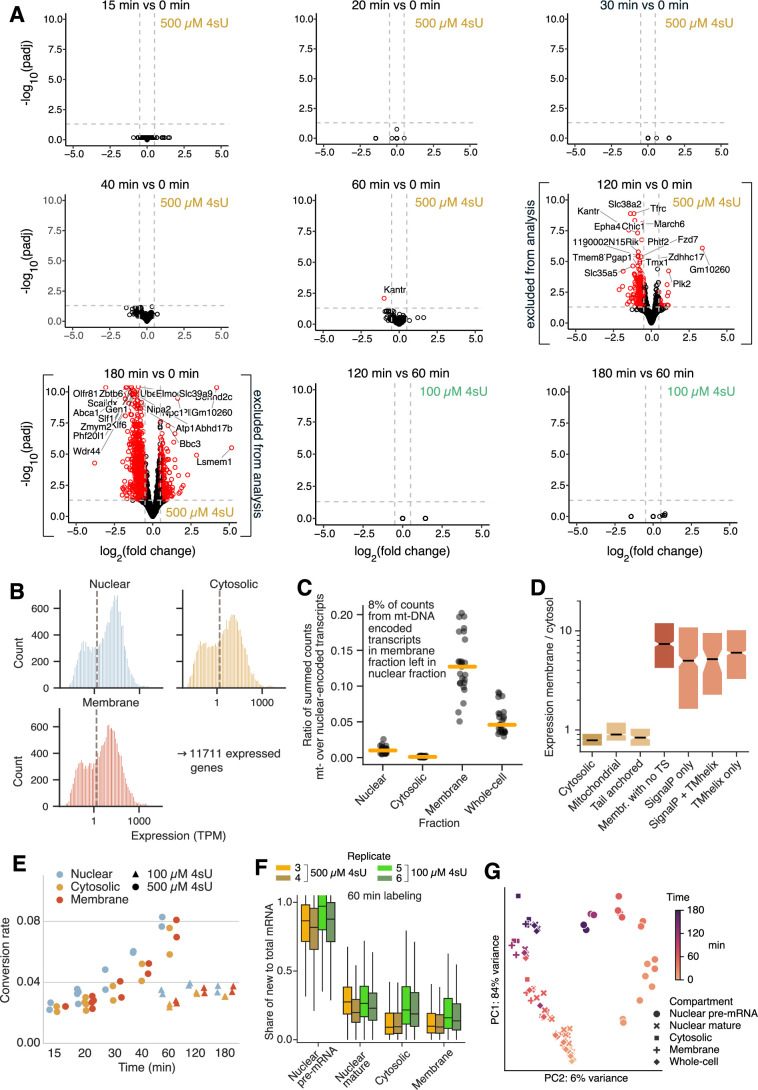
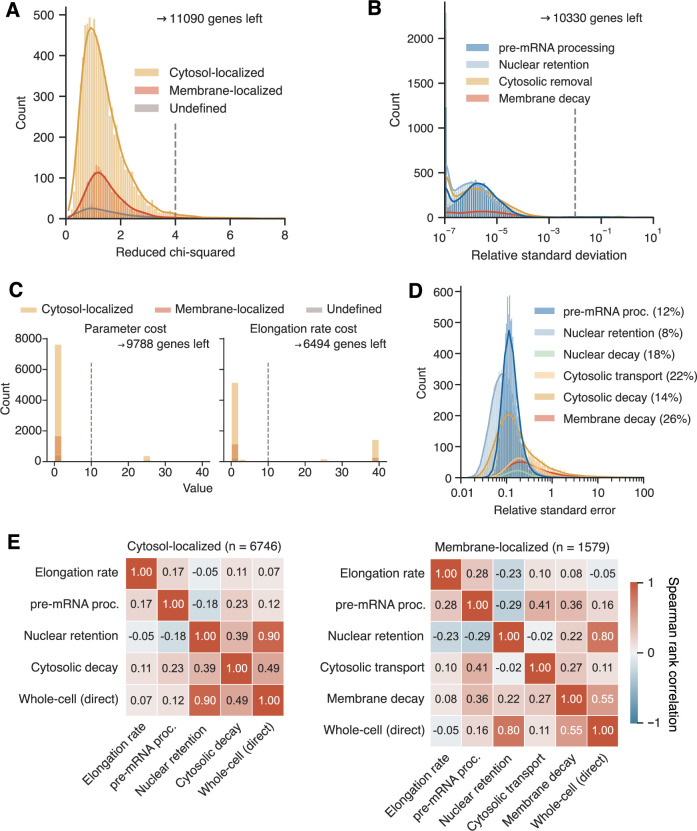
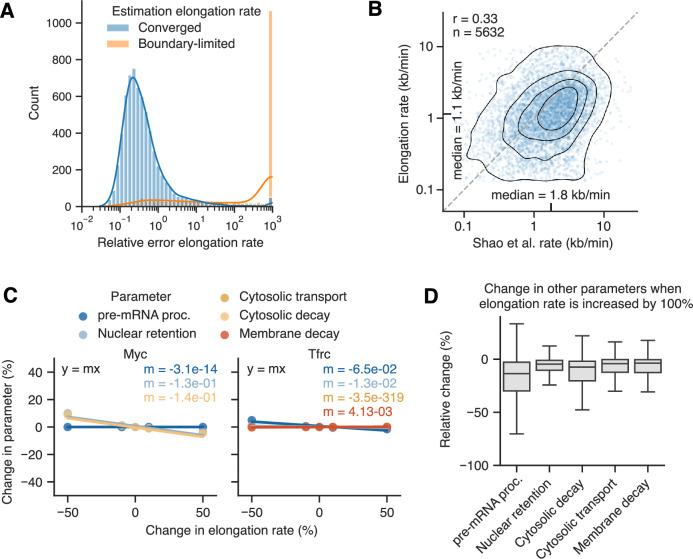
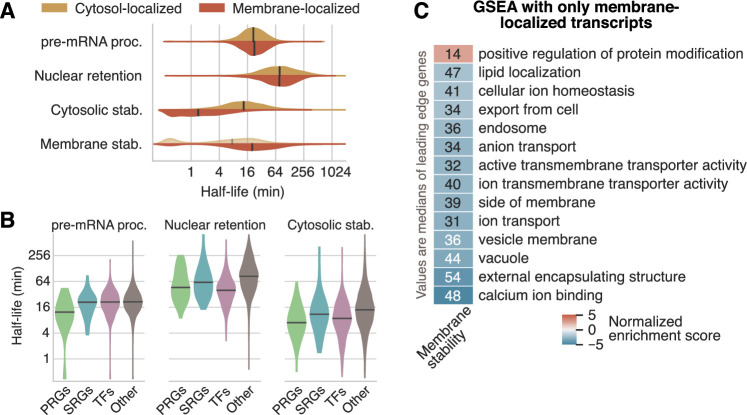
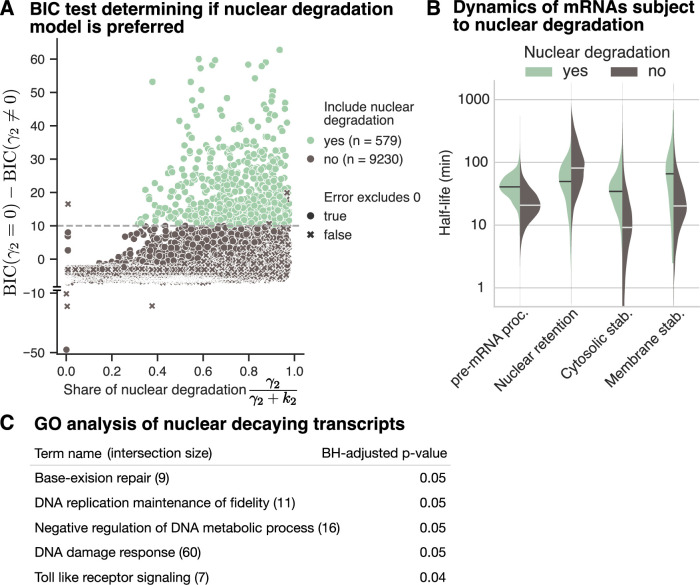
Eukaryotic mRNAs are transcribed, processed, translated, and degraded in different subcellular compartments. Here, we measured mRNA flow rates between subcellular compartments in mouse embryonic stem cells. By combining metabolic RNA labeling, biochemical fractionation, mRNA sequencing, and mathematical modeling, we determined the half-lives of nuclear pre-, nuclear mature, cytosolic, and membrane-associated mRNAs from over 9000 genes. In addition, we estimated transcript elongation rates. Many matured mRNAs have long nuclear half-lives, indicating nuclear retention as the rate-limiting step in the flow of mRNAs. In contrast, mRNA transcripts coding for transcription factors show fast kinetic rates, and in particular short nuclear half-lives. Differentially localized mRNAs have distinct rate constant combinations, implying modular regulation. Membrane stability is high for membrane-localized mRNA and cytosolic stability is high for cytosol-localized mRNA. mRNAs encoding target signals for membranes have low cytosolic and high membrane half-lives with minor differences between signals. Transcripts of nuclear-encoded mitochondrial proteins have long nuclear retention and cytoplasmic kinetics that do not reflect co-translational targeting. Our data and analyses provide a useful resource to study spatiotemporal gene expression regulation.

Keywords: Kinetic Modeling; Metabolic Labeling; Nuclear Retention; RNA Dynamics; Subcellular Fractionation.


Conflict of interest statement

Disclosure and competing interests statement. The authors declare no competing interests.

Figures

Figure 1
Figure 1. Newly transcribed mRNA is measured spatio-temporally using cell fractionation and metabolic labeling RNA sequencing.
(A) Schematic overview of experimental and computational steps. Mouse embryonic stem cells (mESCs) are labeled with 4sU for 15, 20, 30, 40, 60, 120, and 180 min, leading to T2C conversions in newly transcribed RNA (1). Cells are fractionated into nuclear, cytosolic and membrane-bound compartments (2). Ratios between new and total mRNA are estimated in a Bayesian framework for exons and whole intronic regions (3) and given as input to a kinetic model to fit subcellular kinetic rate parameters (4). See Methods for details on each individual step. (B) Results from Western blot analysis measuring nuclear, cytosolic, endoplasmic reticulum, and ribosomal protein markers in the subcellular fractions and the whole-cell extract. (C) Principal component analysis of log-transformed bulk mRNA-seq data in transcripts per million (TPM) using 500 most variable genes. Samples cluster by compartment. (D) Estimates of relative mRNA abundance in subcellular compartments. Subcellular TPM values are fitted to whole-cell TPM values, resulting in estimates for the relative abundance of mRNA in each compartment, see equation in top left. The reduced chi-squared value is shown in the bottom right. (E) Classification of membrane and cytosolic mRNA localization in mESCs through subcellular mRNA expression. Histogram of the ratio between steady-state gene expression (TPM, mean over all time points) in membrane over cytosolic fraction, from here on membrane enrichment, for 11,711 most expressed genes. Vertical gray lines indicate chosen cutoffs to classify mRNA localization. For membrane enrichment <1.5, <3, and >3: cytosol-localized, undefined, and membrane-localized, respectively. Numbers of successfully fitted genes in each localization category are shown in the legend. (F) Time- and compartment-resolved box plot of T2C labeling data (n = 9795). Center lines of box plots depict the median values. Medians of share of new to total mRNA increases with labeling time. Lower and upper hinges of box plots correspond to the 25th and 75th percentiles, respectively. Lower and upper whiskers extend from the hinge to the smallest or largest value no further than the 1.5× interquartile range from the hinge, respectively. Source data are available online for this figure.
Figure 2
Figure 2. Transcript elongation rate is estimated to account for labeling delay in long genes.
(A) Left: Sketch to illustrate how exons (in longer genes) are labeled with a time delay that increases linearly with distance to 3’ end. As poly(A)+ sequencing was used, transcripts close to being fully transcribed will contain T2C conversions first (close to the 3’ end), while it takes longer to observe conversions in the whole transcript. Right: Pointplot of new over total exonic, nuclear mRNA binned by distance to 3’ end. Points show medians across exons per bin and time and are normalized to the 15 min and <5 kb point. Lines connect points of equal time. Equal labeling efficiency is seen after 3 h. (B) Fit result of Slf1 (only nuclear mRNA) is shown to illustrate the fitting procedure. Share of new to total mRNA per exon is plotted over the 4sU labeling time until cell harvesting. All exons of a gene share the same kinetic parameters, but each exonic curve is time-delayed by t~=td/vδ, with d being the mean exonic distance to 3’ end, v the elongation rate and δ the overall delay of 5 min (straight lines). Typically, the closer an exon is to the 3’ end (indicated by color), the higher its ratio of new mRNA is (points). The time-delayed fit accounts for this bias. Gray squares show the gene-level T2C data. Gray, dashed line shows a fit curve delayed by mean 3’ end distance weighted by expression of exons. (C) Histogram with kernel-density estimation (KDE) of converged elongation rates (n = 6494) grouped by gene length (L). Mean rate per group is shown in the top right. Source data are available online for this figure.
Figure 3
Figure 3. Across the transcriptome, transcripts show a wide distribution and different combinations of subcellular kinetic parameters.
(A) Fit results of three exemplary genes. Ratio of new to total mRNA is shown over labeling time. Points with error bars depict means with standard errors of new to total ratio across replicates per (n = 2–4, all fractions shown). Lines are fit results, delayed as the gene-level curve in Fig. 2B (only fitted compartments shown). Ratio between steady-state expression in membrane and cytosolic compartments is shown in bottom right, indicating if 3-step or 4-step model was used (<1.5 or >1.5, respectively, see Fig. 1E). (B) Histogram of nuclear pre-mRNA processing (n = 8515), nuclear retention (n = 9809), cytosolic stability (n = 9809) and membrane stability (n = 2131) mRNA half-lives. Median half-life of each parameter is shown in legend. (C) Heatmap of results from five GSEAs based on the gene ontology (GO). Genes were ranked by log-scaled, z-scored parameter rates. For each parameter, the two most up- and downregulated terms are shown. In addition, five terms with the lowest adjusted P values and adjusted P values <0.05 in at least three columns are shown. P values were corrected using the Benjamini–Hochberg (BH) method. Gray indicates the term is not significant. Values in heatmap are median half-lives (rate in the first column) of the union of leading edge genes across each row. (D) Heatmaps of correlation between kinetic rates and gene features. Transcripts are split into cytosol- (left) and membrane-localized (right). Values in heatmap are spearman rank correlations. Transcript length is the length of the most expressed isoform based on RSEM results. 3’ and 5’ UTR lengths are isoform-specific. Gene GC content is taken from Biomart and includes both intronic and exonic regions. Source data are available online for this figure.
Figure 4
Figure 4. Differentially localized mRNAs exhibit distinct combinations of kinetic rate constants.
(A) Result of a GSEA ranking genes by the ratio of membrane over cytosolic RNA expression (membrane enrichment). False-discovery rates (FDR) are BH-corrected. (B) Violin plot of cytosolic and membrane half-lives with transcripts binned by membrane enrichment (see Fig. 1E with cytosol- and membrane-localized further split at 0.8 and 8.7, respectively; from bin 1 to 5: n = 4409, n = 3254, n = 437, n = 844, and n = 844). Yellow, gray and red colors indicate cytosol, undefined and membrane localization, respectively. Membrane half-lives of cytosol-localized transcripts from additional 4-step model fit are shown transparently. Center lines of violin plots depict the median values. (C) Violin plot of nuclear mature, cytosolic and membrane half-lives with transcripts classified by encoded targeting signals (TS) as in (Zinnall et al, 2022). Classification from left to right: cytosol-localized transcripts with no TS (n = 6262), nuclear DNA-encoded mitochondrial proteins (n = 763 with 661 being cytosol-localized), transcripts with tail-anchored transmembrane proteins (n = 78), membrane-localized transcripts with no known TS (n = 531), transcripts encoding signal peptides (n = 310) or transmembrane helices (n = 956) or both (n = 47). Center lines of violin plots depict the median values. Yellow and red colors indicate cytosol and membrane localization, respectively. Source data are available online for this figure.
Figure 5
Figure 5. Validation of subcellular parameter estimates with external datasets and independent approaches.
(A) Comparison with results from first SLAM-seq experiment (Herzog et al, 2017). Scatterplot of model-derived (y axis) and Herzog et al (x axis) whole-cell half-lives (n = 5475). Model-derived whole-cell half-lives are calculated from subcellular rates, see Appendix Fig. S2 and “Methods”. Mean half-life is annotated on the corresponding axis. Spearman rank correlation is shown on top left. The dashed, gray line is the identity line. (B) Scatterplot of model-derived and directly-fitted whole-cell half-lives (n = 9809). Model-derived whole-cell half-lives as in (A). Direct whole-cell half-lives obtained by fitting a simple “one minus exponential decay” model to the share of new to total mRNA from whole-cell extract data. Mean half-life is annotated on the corresponding axis. Spearman rank correlation is shown on top left. The dashed, gray line is the identity line. (C) Comparison of model- to flavopiridol-derived half-lives. Left: Correlation heatmap of model- with flavopiridol-derived subcellular half-lives split into cytosol- (upper row) and membrane-localized transcripts (lower row). Values in heatmap are spearman rank correlations, also indicated by color. For details on how half-lives using flavopiridol were derived, see “Methods” and Appendix Fig. S2. Right: Scatterplot of model-derived and flavopiridol whole-cell half-lives (n = 6316). Model-derived whole-cell half-lives as in (A). Mean half-life is annotated on the corresponding axis. Spearman rank correlation is shown on top left. Dashed, gray line is the identity line. (D) Comparison of 3-step and 4-step model, which model mRNA flow until cytosolic and membrane-bound compartments, respectively. Scatterplot of pre-mRNA processing, nuclear retention and cytosolic half-lives with values from 3-step and 4-step model on x and y axis, respectively (n = 9369, all genes were fit with both models). Black lines are 2-dimensional KDE to indicate density of points. For details on the models, see Model sections in “Results” and “Methods”. Spearman rank correlation is shown on top left. Dashed gray line is the identity line. Source data are available online for this figure.
Figure EV1
Figure EV1. Overview of mRNA expression and T2C labeling data.
(A) Differential expression analysis of whole-cell extract RNA sequencing data. Volcano plots showing BH-adjusted p values against fold changes logarithmized to base 2. Facets show subsequent 4sU labeling times tested against either t=0 min labeling for the high 4sU dosage (500 µM) or t = 60 min labeling for the low 4sU dosage (100 µM). Differentially expressed genes (padj < 0.05 & log2fc > 0.5, indicated by horizontal and vertical dashed lines) are shown as red dots and stable genes are shown as black dots. Brackets indicate that both subcellular and whole-cell samples of the time point and 4sU concentration tested in the facet were excluded from further analysis. Considering only data included in our main analysis, only one gene, Kantr, is differentially expressed and was removed from subsequent analyses. (B) Gene expression in subcellular fractions. Histograms show TPM values averaged over all time points and replicates for nuclear, cytosolic and membrane fractions. Vertical dashed lines indicate an average TPM of 1.5. If a gene has an average TPM >1.5 in at least one subcellular fraction, it is considered expressed. (C) Mitochondrial contamination of the nuclear fraction. The ratio of the summed counts from all mt-DNA-encoded over all nuclear-encoded transcripts is shown for all samples (black dots) split by fraction. Orange lines depict the median across samples. (D) Box plot of ratio between membrane and cytosolic expression (membrane enrichment) with transcripts classified by encoded TS as in Fig. 4C. Classification from left to right: cytosol-localized transcripts with no TS (n = 6262), nuclear DNA-encoded mitochondrial proteins (n = 763 with 661 being cytosol-localized), transcripts with tail-anchored transmembrane proteins (n = 78), membrane-localized transcripts with no known TS (n = 531), transcripts encoding signal peptides (n = 310) or transmembrane helices (n = 956) or both (n = 47). Center lines of box plots depict the median values. Notches show the 95% confidence interval of median values acquired through boot-strapping (n = 1000). Lower and upper hinges of box plots correspond to the 25th and 75th percentiles, respectively. (E) Estimates of T2C conversion rate. Conversion rates of individual samples are plotted over 4sU labeling time. Conversion rates were estimated fitting a Binomial mixture model to T and T2C count data of each sample. Color indicates compartment. Shape indicates 4sU concentration. Conversion rate increases for high dosage (roughly two-fold increase from 15 to 60 min), but stays constant for low dosage. (F) Comparison between samples labeled with 500 µM or 100µM 4sU for 60 min. Boxes show the share of new to total mRNA in subcellular compartments with colors indicating specific replicates. Center lines of box plots depict the median values. Lower and upper hinges of box plots correspond to the 25th and 75th percentiles, respectively. Although 4sU conversion rates are different between samples, see (D), the share of new mRNA is similar. (G) Principal component analysis of the T2C labeling data using 2,000 most variable genes. Samples cluster by exposure time to 4sU rather than replicate, with nuclear pre-mRNA being separated from other compartments. Source data are available online for this figure.
Figure EV2
Figure EV2. Quality control of fit results.
(A) First quality control step. Histograms of reduced chi-squared, which is minimized during fitting (optimal value is 1). Vertical dashed line shows cutoff of 4. If the best fit for a transcript has a value higher than the cutoff, the transcript is excluded. (B) Second quality control step. Histograms of relative standard deviation, calculated by dividing the standard deviation of the ten best-fit results by the value of the best fit. All values < 1e-07 were set to 1e-07. Vertical dashed line shows cutoff of 0.05. If the relative standard deviation for a transcript has a value higher than the cutoff, the gene is excluded. (C) Third quality control step. Histograms of the boundary cost for all kinetic parameters (left) and elongation rate (right). Boundary cost is near 0 if fit value is far away from upper and lower limits and increases drastically as the value approaches the allowed limits. A high boundary cost therefore indicates that the fit was stuck at maximum or minimum allowed value. Vertical dashed line shows cutoff of 10. If the best fit for a transcript has a parameter cost higher than the cutoff, the transcript is excluded. Transcripts with a elongation rate cost higher than the cutoff are only excluded for analyses specifically regarding the elongation rate. Colors indicate mRNA localization. (D) Accuracy of parameter estimations. Histograms of the relative standard error colored by parameter. Relative standard errors are the square root of the diagonal elements of the inverse Hessian matrix (1σ uncertainty output by lmfit) divided by the corresponding parameter value. Median relative standard errors of each parameter are shown in brackets as percentages in the figure legend. 75% of parameter estimates have a relative error smaller than 19%. (E) Heatmaps showing the Spearman rank correlation between kinetic parameters for cytosol- (left) and membrane-localized (right) transcripts. Source data are available online for this figure.
Figure EV3
Figure EV3. Quality control of the transcript elongation rate.
(A) Accuracy of elongation rate estimations. Histogram of the relative standard error of the elongation rate. Relative standard errors are the square root of the diagonal elements of the inverse Hessian matrix (1σ uncertainty output by lmfit) divided by the corresponding parameter value. 75% of the converged fits (n = 6496) have a relative error smaller than 63% with an overall median of 30%. For boundary-limited estimates (n = 2007) errors were high or could not be determined. For illustration purposes, here, relative standard errors containing infinities or NAs were set to 1000. (B) Comparison of estimated transcription elongation rate to published data (Shao et al, 2022). Scatterplot shows converged elongation rates and from Shao et al measured in serum-naive state mESCs. Spearman rank correlation is shown on top left. Black lines are 2-dimensional KDE to indicate density of points. Dashed, gray line is the identity line. (C) Sensitivity analysis for the elongation rate parameter. Regression plots for transcripts of two exemplary genes, Myc and Tfrc, are shown. For all multiple-exons transcripts that do not show nuclear decay, we repeated the fitting procedure fixing the elongation rate at -50%, -10%, +10% and +50% of its best-fit value and initializing with the best-fit values of the remaining parameters. Then, for each transcript and parameter, we fitted a linear regression y=mx, where y is the change in the fitted parameter and x is the fixed relative change of the elongation rate. The slope m gives a measure of how much a parameter is influenced by changes in the elongation rate. (D) Overview of the sensitivity analysis for the elongation rate parameter. Box plots show the distribution of the slopes from linear regression (see D) for all fitted parameters and across all transcripts with multiple exons (n = 7935). Slopes were multiplied by 100 to represent relative change in percent. When the elongation rate is increased by 100%, the median change in the other parameters ranges from 4% for the membrane decay to 14% for the pre-mRNA processing rate. Transcripts that show nuclear degradation (n = 566) were excluded here due to simplicity reasons. Source data are available online for this figure.
Figure EV4
Figure EV4. Kinetic differences between different gene groups.
(A) Violin plots of pre-mRNA processing, nuclear retention, cytosolic and membrane half-lives for cytosol- (n = 7677) and membrane-localized (n = 1693) transcripts. (B) Violin plots of pre-mRNA processing, nuclear retention and cytosolic half-lives for primary response genes (PRGs, n = 56), secondary response genes (SRGs, n = 37), transcription factors (TFs, n = 709) and all other (n = 6875) transcripts. Only cytosol-localized transcripts were included. Definitions of PRGs and SRGs are taken from (Uhlitz et al, 2017). For definition of TFs, see Methods. (C) GSEA based on the GO using only membrane-localized transcripts and ranking by membrane decay. All significant terms (BH-adjusted p values <0.05) are shown. Color indicates normalized enrichment score. Annotated values are the median half-lives of leading edge genes of each term. Source data are available online for this figure.
Figure EV5
Figure EV5. Nuclear degradation of polyadenylated mRNAs.
(A) Comparison between models excluding and including the nuclear degradation parameter γ2. Scatterplot shows the value difference between the Bayesian Information Criterion (BIC) from fit results of models excluding (γ2= 0) and including (γ20) a nuclear decay parameter over the share of nuclear degradation at overall nuclear dynamics from the γ20 model (n = 9809). For cytosol-localized transcripts, the BIC values from the 3-step models are compared. For undefined and membrane-localized transcripts, the BIC values from the 4-step models are compared. Based on (Raftery, 1995), the model including nuclear degradation is chosen if the BIC difference exceeds 10 (colored green), otherwise the model without nuclear degradation is chosen (colored black). Further selection is based on γ2sγ2> 0 with sγ2 being the standard error on the nuclear decay parameter. This test (true or false indicated by shape) checks that the 0 value is not included within the standard error and only if true the model with nuclear degradation is chosen. (B) Violin plots showing pre-mRNA processing, nuclear retention, cytosolic stability and membrane stability half-lives for transcripts modeled with (n = 579) and without (n = 9230) nuclear decay. Nuclear retention half-life is calculated as τ2=ln2k2+γ2. Center lines of violin plots depict the median values. (C) Results from a GO analysis of all transcripts modeled with nuclear decay. All significant results (BH-corrected p value <0.05) are shown. Source data are available online for this figure.

Similar articles

Cited by

References

    1. Bahar Halpern K, Caspi I, Lemze D, Levy M, Landen S, Elinav E, Ulitsky I, Itzkovitz S (2015) Nuclear retention of mRNA in mammalian tissues. Cell Rep 13:2653–2662 - PMC - PubMed
    1. Battich N, Stoeger T, Pelkmans L (2015) Control of transcript variability in single mammalian cells. Cell 163:1596–1610 - PubMed
    1. Berry S, Pelkmans L (2022) Mechanisms of cellular mRNA transcript homeostasis. Trends Cell Biol 32:655–668 - PubMed
    1. Chao SH, Price DH (2001) Flavopiridol inactivates P-TEFb and blocks most RNA polymerase II transcription in vivo. J Biol Chem 276:31793–31799 - PubMed
    1. Chen T, van Steensel B (2017) Comprehensive analysis of nucleocytoplasmic dynamics of mRNA in Drosophila cells. PLoS Genet 13:e1006929 - PMC - PubMed