. 2024 Nov 15;30(1):218.
doi: 10.1186/s10020-024-00981-x.

Tetrandrine induces muscle atrophy involving ROS-mediated inhibition of Akt and FoxO3

Affiliations

Tetrandrine induces muscle atrophy involving ROS-mediated inhibition of Akt and FoxO3

Xin-Qi Shan et al. Mol Med. .

Abstract

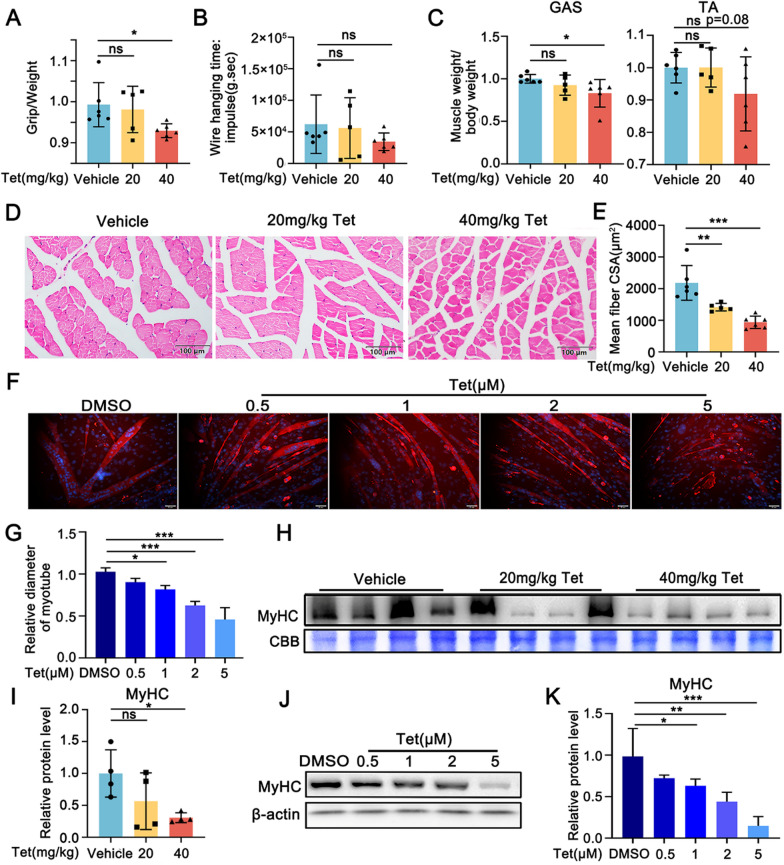
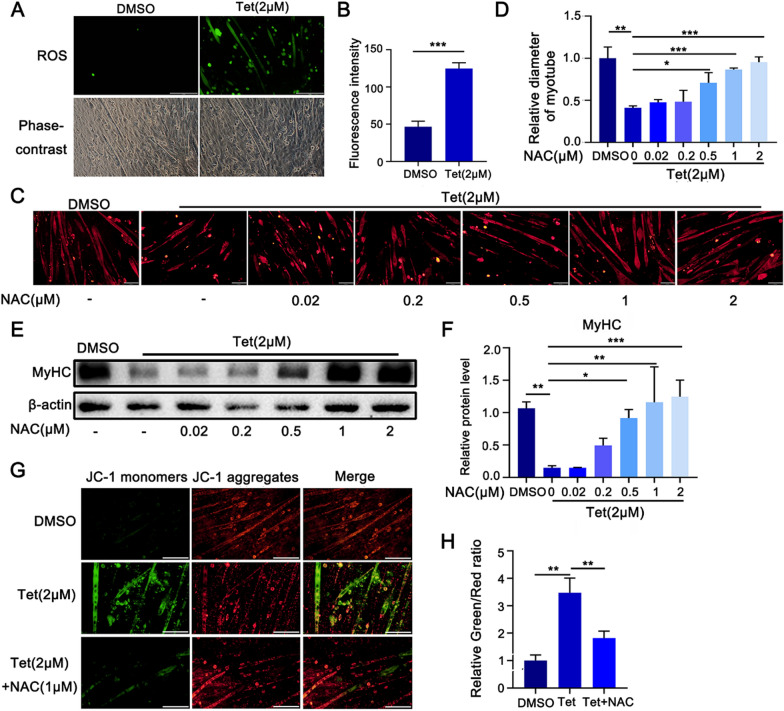
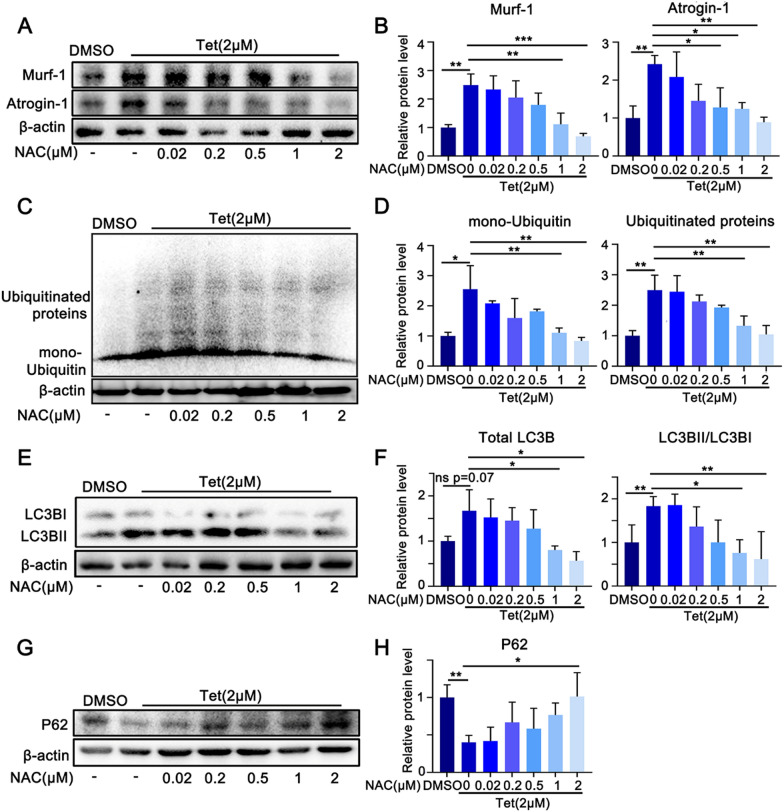
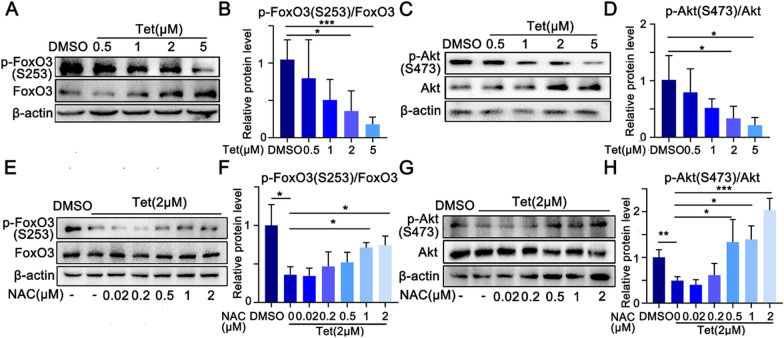
Tetrandrine (Tet), a well-known drug of calcium channel blocker, has been broadly applied for anti-inflammatory and anti-fibrogenetic therapy. However, due to the functional diversity of ubiquitous calcium channels, potential side-effects may be expected. Our previous report revealed an inhibitory effect of Tet on myogenesis of skeletal muscle. Here, we found that Tet induced protein degradation resulting in the myofibril atrophy. Upon administration with a relative high dose (40 mg/kg) of Tet for 28 days, the mice displayed significantly reduced muscle mass, strength force, and myosin heavy chain (MyHC) protein levels. The MyHC reduction was further detected in C2C12 myotubes after treating with Tet. Interestingly, the expression of Atrogin-1 and Murf-1, the skeletal muscle specific E3 ligases of protein ubiquitin-proteasome system (UPS), was accordingly up-regulated, and the reduced MyHC was significantly mitigated by MG132, a 26S proteasome inhibitor, indicating a key role of UPS in the protein degradation of muscle cells. Further study showed that Tet induced autophagy also participated in the protein degradation. Mechanistically, Tet treatment caused ROS production in myotubes that in turn targeted on FoxO3/AKT signaling, resulting in the activation of UPS and autophagy processes that were involved in the protein degradation. Our study reveals a potential side-effect of Tet on skeletal muscle atrophy, particularly when the drug dose is relatively high.

Keywords: Degradation; FoxO3/Akt; Myosin heavy chain; ROS; Tetrandrine.


Conflict of interest statement

Declarations Ethics approval and consent to participate All animal handling procedures in this study were approved by the Experimental Committee of Nanjing Normal University (No: IACYUC-20231001). Consent for publication Not applicable. Competing interests The authors declare no competing interests.

Figures

Fig. 1
Fig. 1
Tet induces muscle atrophy in vivo and vitro. A. The grip strength of Tet treated mice. n = 5–6 per group. B. Wire hanging time of Tet treated mice. C. The body weight to GAS or TA muscle tissues ratio of Tet treated mice. D. H/E staining of cross section of TA muscles. E. Quantification of muscle fiber cross-sectional area (CSA) in D. Scale bars: 100 μm. F. Immuno-staining of Tet treated C2C12 myotubes with MyHC antibody. Scale bars: 50 μm. G. Quantification of myotube diameters in F. H. Western blotting analysis of MyHC protein levels in the GAS muscles of Tet administrated mice. I. Quantification of the band intensities in H. J. Western blotting analysis of MyHC protein levels in Tet treated C2C12 myotubes. K. Quantification of the band intensities in J. A-E: Vehicle and 40 mg/kg: n = 6; 20 mg/kg: n = 5; F, G, J and K: n = 3; H&I: n = 4. Data are shown as mean ± SD. *p < 0.05. **p < 0.01. ***p < 0.001
Fig. 2
Fig. 2
Tet induces UPS activation in muscle cells. A. Western blotting analysis of MyHC protein levels in Tet treated C2C12 myotubes in the presence of MG-132. B. Quantification of the band intensities in A. C. Western blotting analysis of poly ubiquitin modified MyHC (MyHC-(Ub)n) protein levels in Tet treated C2C12 myotubes in the presence of MG-132. D. Quantification of the band intensities in C. E. Western blotting analysis of Murf-1 and Atrogin-1 protein levels in Tet treated C2C12 myotubes. F. Quantification of the band intensities in E. G. RT q-PCR analysis of mRNA expression levels of Atrogin-1 and Murf-1 in Tet treated C2C12 myotubes. H. Western blotting analysis of Ubiquitin proteins levels of Tet treated C2C12 myotubes. I. Quantification of the band intensities in H. J. Western blotting analysis of Murf-1 and Atrogin-1 protein levels in the GAS tissues of Tet administrated mice. K. Quantification of the band intensities in J. L. RT q-PCR analysis of mRNA expression levels of Atrogin-1 and Murf-1 in GAS muscles of Tet administrated mice. AI: n = 3; JK: n = 4; L: n = 5 or 6 as Fig. 1. Data are shown as mean ± SD. *p < 0.05. **p < 0.01. ***p < 0.001
Fig. 3
Fig. 3
Tet triggers autophagy activation. A. Western blotting analysis of LC3B-I and LC3B-II protein levels in Tet treated C2C12 myotubes. B. Quantification of the band intensities in A. n = 3 per group. C. Western blotting analysis of P62 protein levels in Tet treated C2C12 myotubes. D. Quantification of the band intensities in C. E. Western blotting analysis of LC3B-I and LC3B-II protein levels in GAS muscles of Tet administrated mice. F. Western blotting analysis of P62 protein levels in GAS muscles of Tet administrated mice. G. Quantification of the band intensities in E and F. H. Western blotting analysis of LC3B-I and LC3B-II protein levels in Tet treated C2C12 myotubes in the presence of 3-MA. I. Quantification of the band intensities in G. J. Immuno-staining of C2C12 myotubes with MyHC antibody. Scale bars: 200 μm. K. Quantification of myotube diameters in J. AD & HK: n = 3; EG: n = 4. Data are shown as mean ± SD. *p < 0.05. **p < 0.01. ***p < 0.001
Fig. 4
Fig. 4
Tet induced ROS production and the effects of ROS in muscle atrophy. A. Detection of ROS levels in Tet treated C2C12 myotubes by using of DCFH-DA. Scale bars: 200 μm. B. Quantification of the fluorescence intensities in A. C. Immuno-staining of Tet treated C2C12 myotubes in the presence of NAC. Scale bars: 100 μm. D. Quantification of the fluorescence intensities in C. E. Western blotting analysis of MyHC protein levels in Tet treated C2C12 myotubes in the presence of NAC. F. Quantification of the band intensities in E. G. JC-1 monomers (red) and JC-1 aggregates (green) in C2C12 myotubes. Scale bars: 100 μm. H. Quantification of the fluorescence intensities in G. n = 3. Data are shown as mean ± SD. *p < 0.05. **p < 0.01. ***p < 0.001
Fig. 5
Fig. 5
ROS mediates the up-regulation of UPS and autophagy. A. Western blotting analysis of Atrogin-1 and Murf-1 expression in Tet treated C2C12 myotubes in the presence of NAC. B. Quantification of the band intensities in A. C. Western blotting analysis of mono-Ubiquitin and Ubiquitinated proteins expression in Tet treated C2C12 myotubes in the presence of NAC. D. Quantification of the band intensities in C. E. Western blotting analysis of LC3B expression in Tet treated C2C12 myotubes in the presence of NAC. F. Quantification of the band intensities in E. G. Western blotting analysis of P62 expression in Tet treated C2C12 myotubes in the presence of NAC. H. Quantification of the band intensities in G. n = 3. Data are shown as mean ± SD. *p < 0.05. **p < 0.01. ***p < 0.001
Fig. 6
Fig. 6
Tet declines Akt and FoxO3 activities. A. Western blotting analysis of p-FoxO3(S253)/FoxO3 expression in Tet treated C2C12 myotubes. B. Quantification of the ratio of p-FoxO3/FoxO3 in A. C. Western blotting analysis of p-Akt(S473)/Akt expression in Tet treated C2C12 myotubes. D. Quantification of the ratio of p-Akt/Akt in C. E. Western blotting analysis of p-FoxO3(S253)/FoxO3 expression in Tet treated C2C12 myotubes in the presence of NAC. F. Quantification of the ratio of p-FoxO3/FoxO3 in E. G. Western blotting analysis of p-Akt(S473)/Akt expression in Tet treated C2C12 myotubes in the presence of NAC. H. Quantification of the ratio of p-Akt/Akt in G. n = 3. Data are shown as mean ± SD. *p < 0.05. **p < 0.01. ***p < 0.001

References

    1. Bodine SC, Latres E, Baumhueter S, Lai VK, Nunez L, Clarke BA, et al. Identification of ubiquitin ligases required for skeletal muscle atrophy. Science. 2001;294(5547):1704–8. - PubMed
    1. Brunet A, Bonni A, Zigmond MJ, Lin MZ, Juo P, Hu LS, et al. Akt promotes cell survival by phosphorylating and inhibiting a Forkhead transcription factor. Cell. 1999;96(6):857–68. - PubMed
    1. Cai Y, Qi XM, Gong LK, Liu LL, Chen FP, Xiao Y, et al. Tetrandrine-induced apoptosis in rat primary hepatocytes is initiated from mitochondria: caspases and endonuclease G (Endo G) pathway. Toxicology. 2006;218(1):1–12. - PubMed
    1. Chandrashekar KR, Bhagya N, Ashwini Prabhu PD, Rekha. Tetrandrine isolated from Cyclea peltata induces cytotoxicity and apoptosis through ROS and caspase pathways in breast and pancreatic cancer cells. In Vitro Cell Dev Biol Anim. 2019;55(5):331–40. - PubMed
    1. Clarke BA, Drujan D, Willis MS, Murphy LO, Corpina RA, Burova E, et al. The E3 Ligase MuRF1 degrades myosin heavy chain protein in dexamethasone-treated skeletal muscle. Cell Metab. 2007;6(5):376–85. - PubMed

MeSH terms

LinkOut - more resources