. 2024 Nov 15;25(1):1091.
doi: 10.1186/s12864-024-11016-4.

Multi-tissue metabolomic profiling reveals the crucial metabolites and pathways associated with scallop growth

Affiliations

Multi-tissue metabolomic profiling reveals the crucial metabolites and pathways associated with scallop growth

Yihan Zhang et al. BMC Genomics. .

Abstract

Background: Bivalves represent a vital economic resource in aquaculture for their high productivity and extensive market demand. Growth is one of the most important and desired aquaculture traits for bivalves, regulated by multiple levels, notably intricate metabolic processes. However, the understanding of the metabolic profiles that influence bivalve growth is limited, particularly from a multi-tissue perspective.

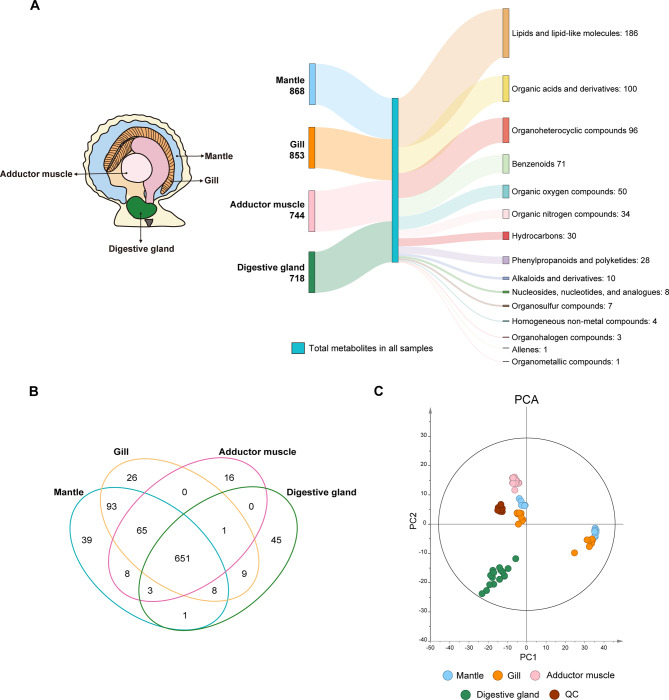
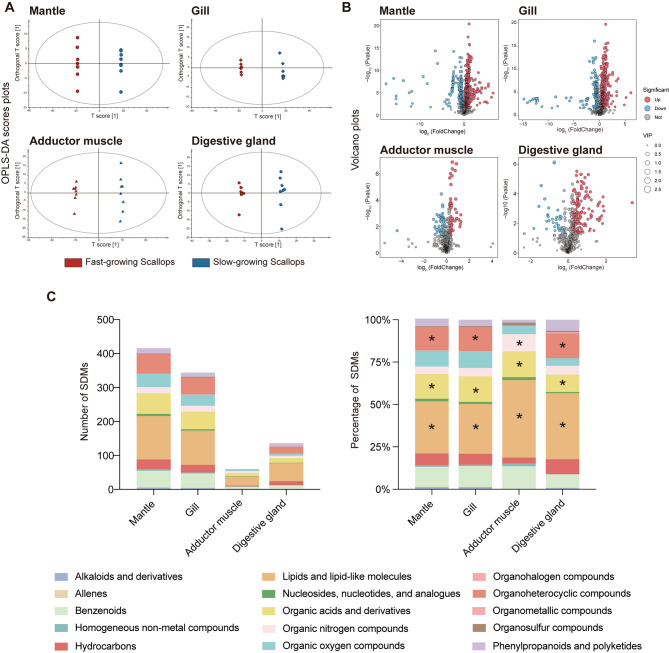
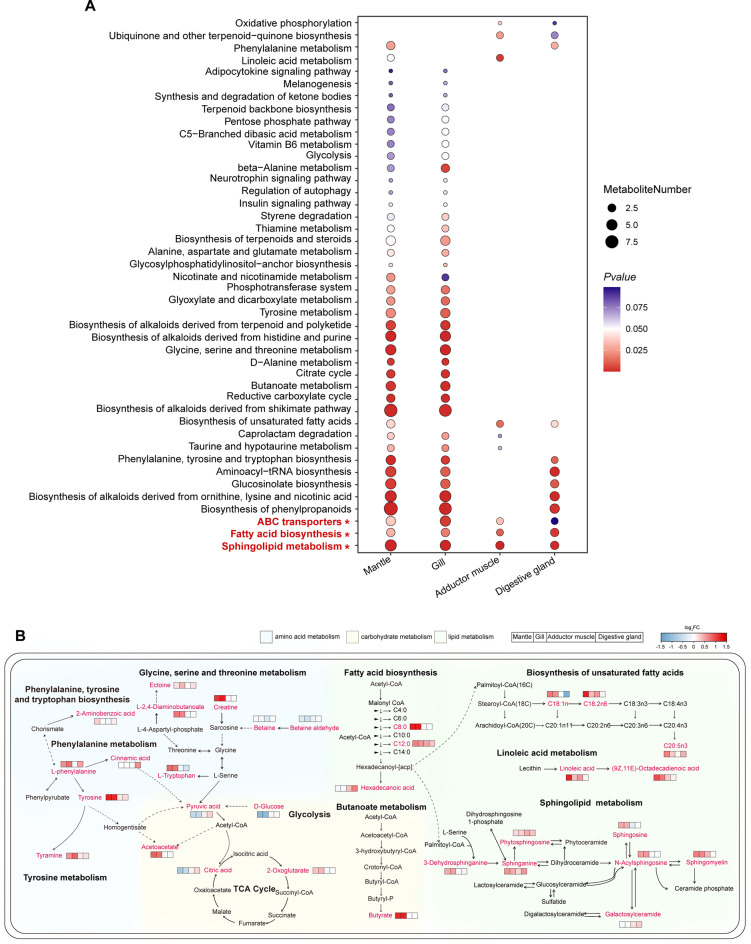
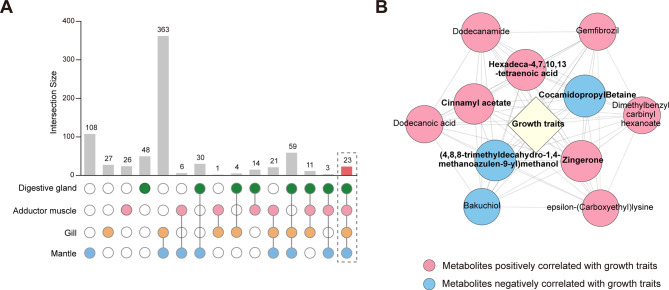
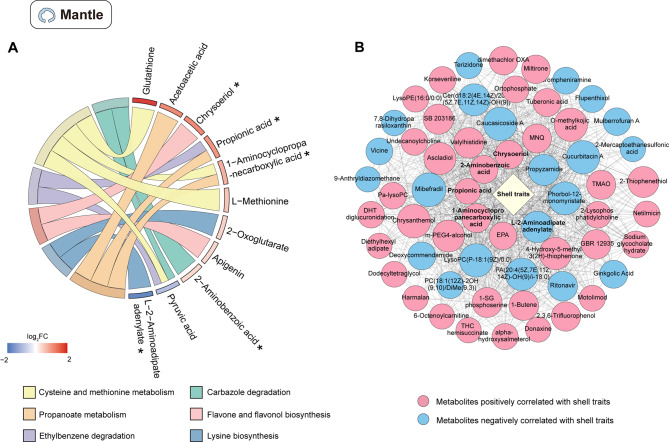
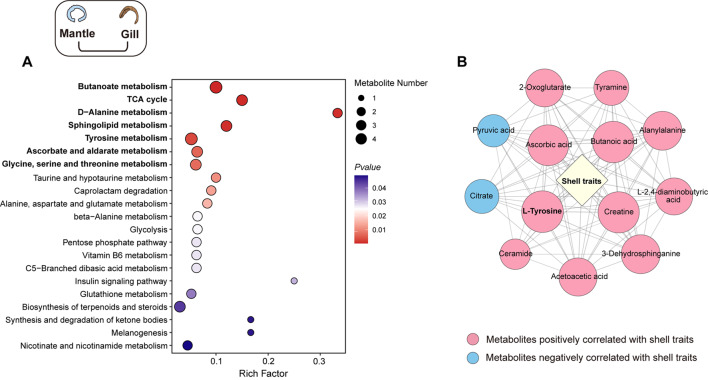
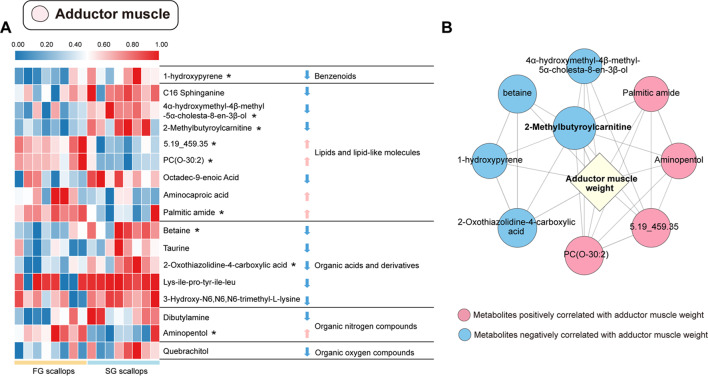
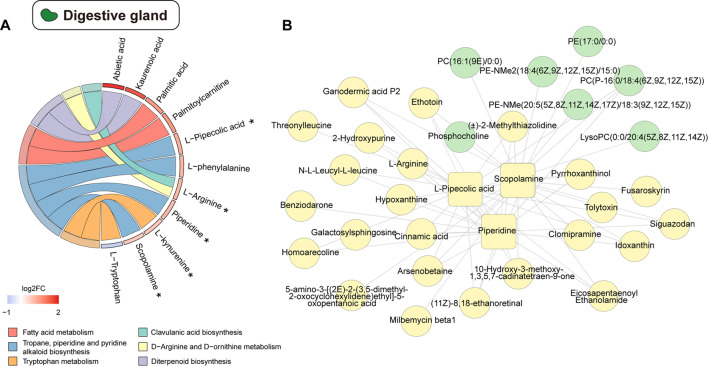
Results: In this study, metabolic profiles of multiple tissues of Chlamys farreri with different growth performance were systematically investigated by ultraperformance liquid chromatography quadrupole time-of-flight mass spectrometry (UPLC-Q-TOF-MS). Through comparing the metabolic variation between fast-growing (FG) scallops and slow-growing (SG) scallops, 613, 509, 105, and 192 significantly different metabolites (SDMs) were identified in the mantle, gill, adductor muscle, and digestive gland, respectively. Growth-related metabolic pathways including sphingolipid metabolism, fatty acid biosynthesis, and ABC transporter pathway, along with 11 SDMs associated with growth traits were identified in all four tissues, implying they were involved in the growth of multiple tissues in scallops. Tissue-specific metabolic profiling indicated that sulfur-containing amino acid metabolism in the mantle potentially contributed to shell growth, while the gill synergistically participated with the mantle through various metabolic processes, such as tyrosine metabolism, glycine, serine, and threonine metabolism and melanogenesis; energy metabolism was crucial for adductor muscle growth; and nutrients digestion and absorption in the digestive gland were linked to scallop growth.

Conclusions: Our results represent the first comprehensive analysis of the crucial pathways and metabolites associated with the growth of C. farreri, offering valuable insights for future bivalve aquaculture production.

Keywords: Chlamys farreri; Bivalve; Growth; Metabolomics; Multi-tissue.


Conflict of interest statement

Declarations Ethics approval and consent to participate Animal materials of C. farreri used in this study were obtained from Weihai Changqing Marine Technology Co., Ltd., Shandong Province, China. No field permissions were necessary to collect the animal samples for this study. The authors declared that the experimental research on the animals described in this paper was in compliance with institutional, national and international guidelines. Consent for publication Not applicable. Competing interests The authors declare no competing interests.

Figures

Fig. 1
Fig. 1
The metabolite characteristics of the mantle, gill, adductor muscle, and digestive gland of C. farreri. (A) The summary Sankey plot of the major metabolite categories identified in four tissues of C. farreri. (B) Venn diagram of identified metabolites among four tissues of C. farreri. (C) PCA scatter plot from the metabolic profiles of mantle, gill, adductor muscle, digestive gland, and QC samples in C. farreri
Fig. 2
Fig. 2
Significantly different metabolites (SDMs) of the mantle, gill, adductor muscle, and digestive gland between the FG scallops and the SG scallops. (A) OPLS-DA score plots of the metabolic profiles of four tissues. (B) Volcano plots of SDMs of four tissues. Pink spots and blue spots represent the up-regulated and down-regulated SDMs in the four tissues of FG scallops, respectively. (C) Stacked graph (left) and percentage bar graph (right) of SDM categories of four tissues. The ordinates of stacked graph and percent bar graph represent the number and percentage of different categories of SDMs in each tissue, respectively. Different colors represent different categories of SDMs. “*” indicates the top three categories of SDMs in each tissue
Fig. 3
Fig. 3
The metabolic pathways shared by multi-tissue in C. farreri. (A) Tissue-shared metabolic pathways of SDMs in four tissues. The intensity of red color in the spots indicates the significance of enrichment. The size of the spots corresponds to the number of enriched SDMs. Red font and “*” indicate the metabolic pathways shared by all four tissues. (B) Schematic illustration of metabolic pathways shared by multi-tissue related to the growth of C. farreri. The heatmap (log2FC) shows the expression levels of SDMs detected in four tissues of FG scallops relative to SG scallops. SDMs are indicated in red font
Fig. 4
Fig. 4
Identification of growth-related metabolites across multi-tissue in C. farreri. (A) UpsetR plot of SDMs among four tissues. Intersection size represents the number of tissue-shared SDMs among tissues denoted in the bottom rows. (B) Correlation network between the abundance of SDMs shared across four tissues and growth traits. Connections are identified using the cutoff of |r| > 0.5 and P < 0.05. Yellow square represents growth traits, which is the first principal component (PC1) derived from shell height, shell length, shell width, body weight, soft tissue weight, and adductor muscle weight. Pink nodes and blue nodes represent SDMs positively and negatively correlated with growth traits, respectively. The strength of the correlation with growth traits is indicated by the size of the nodes
Fig. 5
Fig. 5
Tissue-specific metabolic pathways and metabolites associated with growth in the mantle of C. farreri. (A) Circos plot of mantle specific enrichment pathways of SDMs. SDMs are listed on the right, ordered by descending log2FC. Corresponding metabolic pathways are on the left. “*” indicates the mantle specific SDMs. (B) Correlation network between mantle-specific SDMs abundance and shell traits. Connections are identified using the cut off of |r| > 0.5 and P < 0.05. Yellow square represents shell traits, which is the PC1 derived from shell length and shell height. Pink nodes and blue nodes represent SDMs positively and negatively correlated with shell traits, respectively. The strength of the correlation with shell traits is indicated by the size of the nodes
Fig. 6
Fig. 6
Analysis of SDMs shared between mantle and gill of C. farreri. (A) Metabolic pathways enrichment of SDMs shared between the mantle and gill. The intensity of red color in the spots indicates the significance of enrichment. The size of the spots corresponds to the number of enriched SDMs. (B) Correlation network between the abundance of SDMs shared by mantle and gill and shell traits. Connections are identified using SDMs in significantly (P < 0.01) enriched metabolic pathways with |r| > 0.5 and P < 0.05. Yellow square represents shell traits, which is the PC1 derived from shell length and shell height. Pink nodes and blue nodes represent SDMs positively and negatively correlated with shell traits, respectively. The strength of the correlation with shell traits is indicated by the size of the nodes
Fig. 7
Fig. 7
Tissue-specific metabolic pathways and metabolites associated with adductor muscle growth of C. farreri. (A) Heatmap of annotated adductor muscle specific SDMs. Red and blue arrows indicate up-regulated and down-regulated in FG scallops, respectively. Metabolite categories are shown on the far right. “*” indicates the SDMs associated with adductor muscle weight. (B) Correlation network between adductor muscle specific SDMs abundance and adductor muscle weight. Connections are identified using the cut off of |r| > 0.5 and P < 0.05. Yellow square represents adductor muscle weight. Pink nodes and blue nodes represent SDMs positively and negatively correlated with adductor muscle weight, respectively. The strength of the correlation with adductor muscle weight is indicated by the size of the nodes. The compound 5.19_459.35 represents 2-(Methoxycarbonyl)-5-methyl-2,4-bis(3-methyl-2-butenyl)-6-(2-methyl-1-oxopropyl)-5-(4-methyl-3-pentenyl)cyclohexanone
Fig. 8
Fig. 8
Analysis of tissue-specific metabolic pathways and metabolites in the digestive gland of C. farreri. (A) Circos plot of digestive gland specific enrichment pathways of SDMs. SDMs are listed on the right, ordered by descending log2FC. Corresponding metabolic pathways are on the left. “*” indicates the digestive gland specific SDMs. (B) Correlation network between SDMs abundance involved in tropane, piperidine, and pyridine alkaloids biosynthesis and other digestive gland specific SDMs abundance. Connections are identified using the cut off of |r| > 0.5 and P < 0.05. Yellow squares represent SDMs involved in tropane, piperidine, and pyridine alkaloids biosynthesis. Green nodes represent phospholipids and related compounds. The strength of the correlation is indicated by the thickness of the edges

Similar articles

Cited by

References

    1. FAO. Fishery and aquaculture statistics – yearbook 2020. FAO; 2023.
    1. Farmery AK, Alexander K, Anderson K, Blanchard JL, Carter CG, Evans K, et al. Food for all: Designing sustainable and secure future seafood systems. Rev Fish Biol Fisher. 2022;32:101–21. - PMC - PubMed
    1. Tan K, Ma H, Li S, Zheng H. Bivalves as future source of sustainable natural omega-3 polyunsaturated fatty acids. Food Chem. 2020;311:125907. - PubMed
    1. Venter L, Loots DT, Vosloo A, Van Jansen P, Lindeque JZ. Abalone growth and associated aspects: now from a metabolic perspective. Rev Aquacult. 2018;10:451–73.
    1. Guo L, Li L, Zhang S, Zhang G. Molecular cloning and characterization of the myostatin gene in a cultivated variety of bay scallop, Argopecten irradians. Aquaculture. 2012;350–353:192–9.

LinkOut - more resources