. 2024 Nov 15;24(1):409.
doi: 10.1186/s12876-024-03495-2.

Investigating the diagnostic and prognostic significance of genes related to fatty acid metabolism in hepatocellular carcinoma

Affiliations

Investigating the diagnostic and prognostic significance of genes related to fatty acid metabolism in hepatocellular carcinoma

Sha-Sha Zhao et al. BMC Gastroenterol. .

Abstract

Background: Hepatocellular carcinoma (HCC) is one of the most prevalent and lethal cancers worldwide, with death rates increasing by approximately 2-3% per year. The high mortality and poor prognosis of HCC are primarily due to inaccurate early diagnosis and lack of monitoring when liver transplantation is not feasible. Fatty acid (FA) metabolism is a critical metabolic pathway that provides energy and signaling factors in cancer, particularly in HCC, and promotes malignancy. Therefore, it is essential to explore specific FA metabolism-related diagnostic and prognostic signatures that can enable the effective early diagnosis and monitoring of HCC.

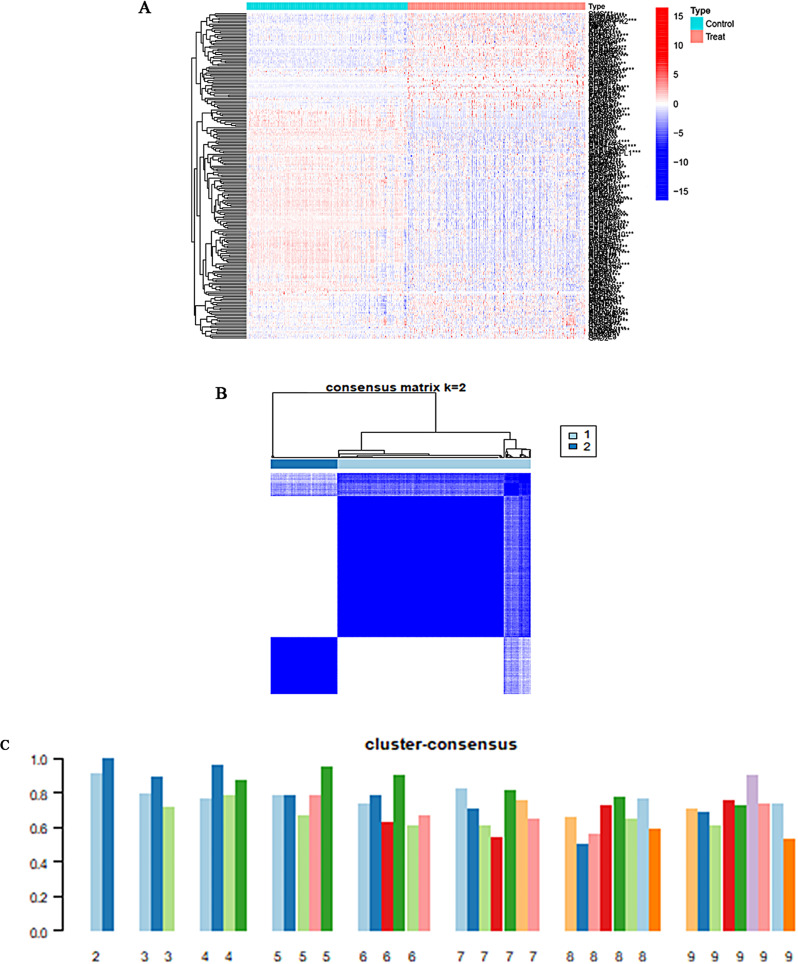
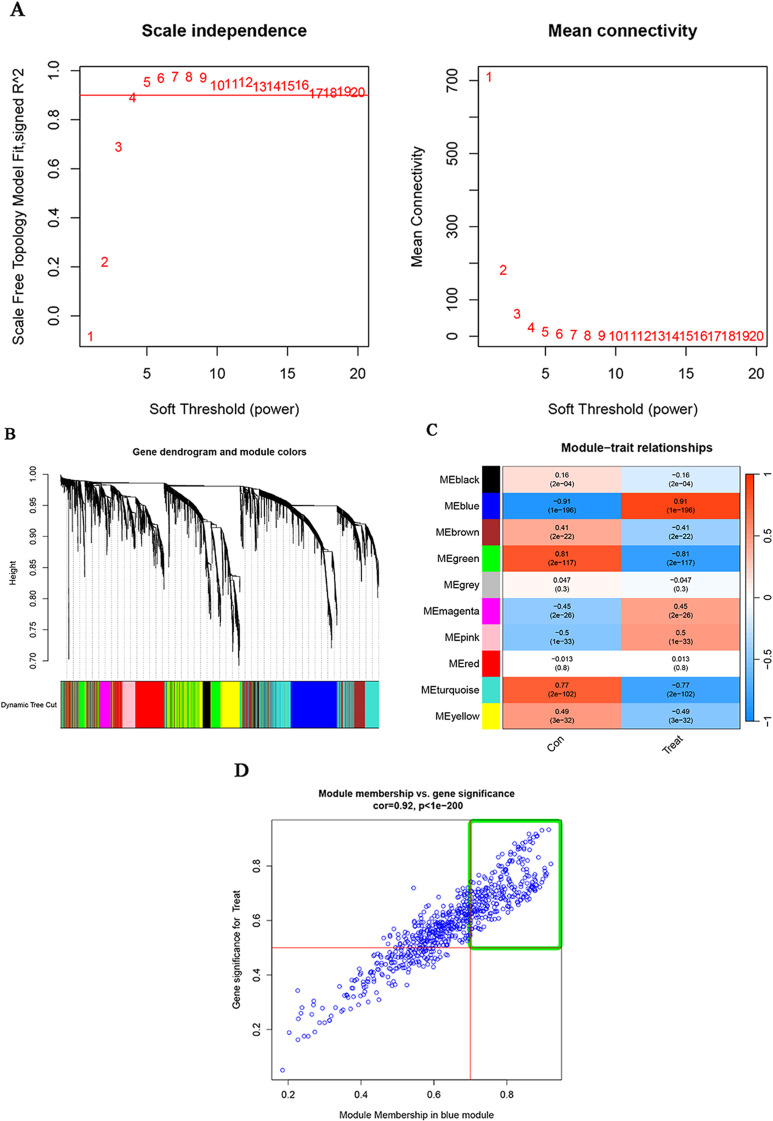
Methods: In this study, we used genes associated with FA metabolism pathway and weighted gene co-expression network analysis (WGCNA) to establish a gene co-expression network and identify hub genes related to HCC (disease WGCNA) and FA clusters (cluster WGCNA). A diagnostic model was constructed using data downloaded from the Gene Expression Omnibus database (GSE25097), and a prognostic model was established using The Cancer Genome Atlas cohort, in which Univariate Cox regression analysis, multivariate Cox risk model, and LASSO Cox regression analysis were applied. The immune infiltration of HCC cells was evaluated using CIBERSORT. The function of the key SLC22A1 gene was experimentally verified in vitro and in vivo.

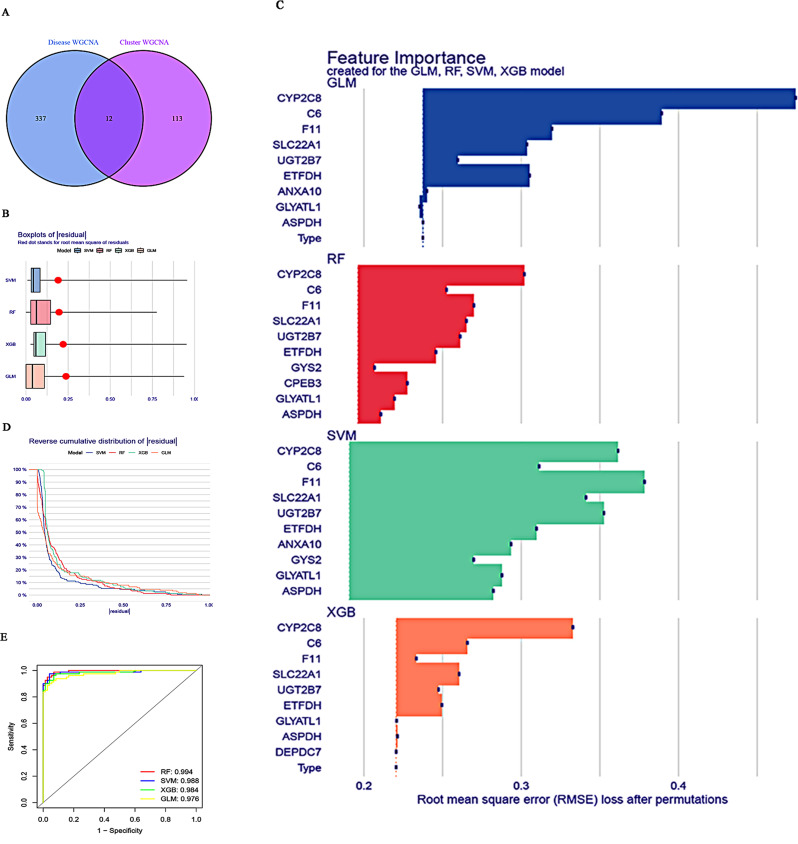
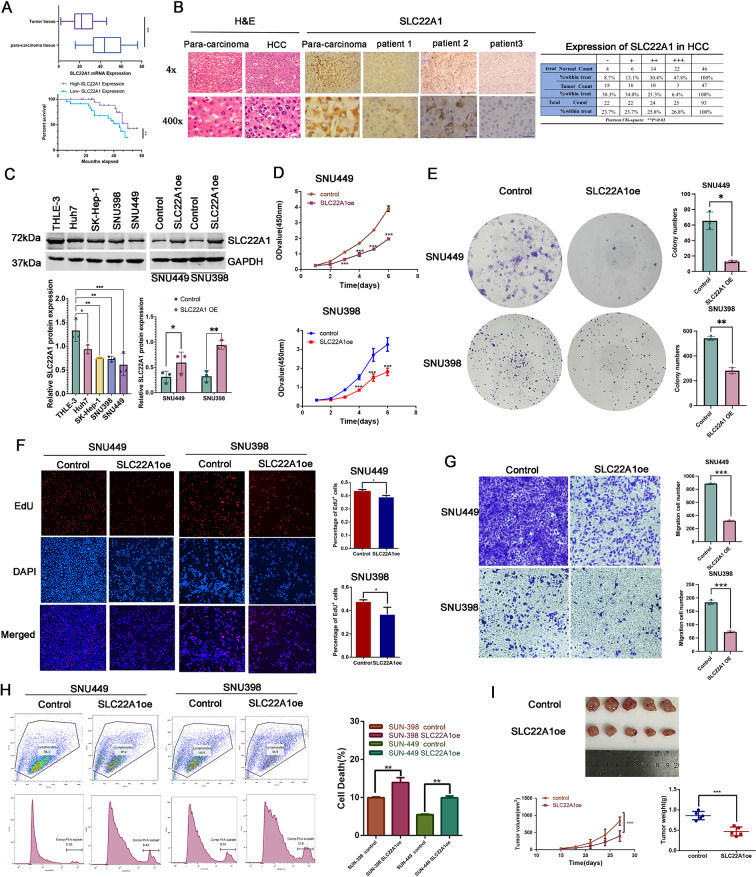
Results: Twelve overlapping genes (CPEB3, ASPDH, DEPDC7, ETFDH, UGT2B7, GYS2, F11, ANXA10, CYP2C8, GLYATL1, C6, and SLC22A1) from disease and cluster WGCNA were identified as key genes and used in the construction of the diagnostic and prognostic models. The RF model had the highest area under the ROC curve (AUC) of 0.994 was identified as the most effective for distinguishing patients with HCC with different features. The top five important genes (C6, UGT2B7, SLC22A1, F11, and CYP2C8) from the RF model were selected as diagnostic genes for further analysis (ROC curves: AUC value = 0.986, 95% confidence interval [95% CI] = 0.967-0.999). Moreover, a risk score formula consisting of four genes (GYS2, F11, ANXA10 and SLC22A1) was established and its independent prognostic ability was further demonstrated (univariate Cox regression analysis: hazard ratio [HR] = 3.664%, 95% CI = 2.033-6.605, P < 0.001; multivariate Cox regression analysis: HR = 2.801%, 95% CI = 1.553-5.049, P < 0.001). Additionally, in vitro and in vivo experiments demonstrated that SLC22A1 inhibits HCC tumor development, suggesting it may be a potential therapeutic target for HCC.

Conclusions: These findings indicate a considerable value of specific FA metabolism-related genes in the diagnostic and prognostic evaluation of HCC, which provide novel insights into the disease's management, as well as has potential implications for personalized treatment strategies. However, further investigation of the effects of these model genes on HCC is required.

Keywords: SLC22A1; Biomarker; Diagnosis; Fatty acid metabolism-related genes; Hepatocellular carcinoma; Prognosis; Weighted gene co-expression network analysis.


Conflict of interest statement

Declarations Ethics approval and consent to participate All participants signed informed consent forms. This study was reviewed and approved by the Institutional Review Board (Approval Number: 21K196) of Shanghai Tenth People’s Hospital, Tongji University School of Medicine, Shanghai. The animal study also approved under declaration with the approval number of SHDSYY-2021-4709. Consent for publication Not applicable. Competing interests The authors declare no competing interests.

Figures

Fig. 1
Fig. 1
Diagnostic and prognostic significance workflow of FA-related genes in hepatocellular carcinoma (HCC) using WGCNA algorithms. This analysis involves leveraging data obtained from both the GEO and TCGA databases
Fig. 2
Fig. 2
Identification of FAs clusters in HCC. (A) The heatmap displaying the expression levels of 220 FA-DEGs in normal and tumour tissue of HCC. Blue and red colours indicate low and high expression of genes, respectively. (B) Two FAs clusters (k = 2) were identified in HCC using a consensus clustering algorithm. (C) The consistency score of each subtype. The cluster-consensus was highest when the k value was set to two (k = 2). DEG, differential expressed gene; FA, fatty acid; HCC, hepatocellular carcinoma
Fig. 3
Fig. 3
Co-expression network construction. The top 25% of genes with the highest variance in HCC were used. (A) The estimation of the soft threshold power was set to β = 4. (B) Co-expression modules were visualized as a cluster tree dendrogram, represented in various colours. (C) The relationships between consensus module eigengenes and HCC were examined. The rows in the figure correspond to consensus modules, while the columns represent clinical status. The numbers within each module indicate the correlation coefficients between the respective module and clinical status, along with the p-values enclosed in parentheses. The modules are depicted in different colours, where red signifies a positive correlation, and green signifies a negative correlation. (D) Module membership within the blue modules and gene significance in relation to HCC were analysed. Each blue dot represents a gene. Genes with module membership values > 0.7 and gene significances > 0.5, contained within the green box, were identified as candidate hub genes. HCC, hepatocellular carcinoma
Fig. 4
Fig. 4
The co-expression network was constructed using FA clusters. (A) The soft threshold power was estimated to be β = 4. (B) Co-expression modules were visualized as a cluster tree dendrogram, distinguished by various colours. (C) The relationships between consensus module eigengenes and FA clusters were explored. The figure rows represent consensus modules, while the columns correspond to FAs clusters. The numbers within each module indicate the correlation coefficients between the respective module and clusters, along with the p-values enclosed in parentheses. The modules were visualized in different colours, where red signifies a positive correlation and green signifies a negative correlation. (D) Module membership within the turquoise modules and gene significance for clusters 2 were analysed. Each turquoise dot represents a gene. Genes with module membership values > 0.7 and gene significances > 0.5, located within the green box, were identified as candidate hub genes. FA, fatty acid
Fig. 5
Fig. 5
The machine learning models RF, SVM, GLM, and XGB were constructed and evaluated. (A) The intersections between genes related to hub modules, identified through disease WGCNA and cluster WGCNA, were investigated. (B) Boxplots of residuals were generated for each machine learning model, with red dots representing the root mean square of residuals (RMSE). (C) The feature importance of the RF, SVM, GLM, and XGB models were analysed. (D) The cumulative distribution of residuals was examined for each machine learning model. (E) ROC analysis of the four models, based on five-fold cross-validation in the GEO dataset, was conducted. GLM, generalized linear model; RF random forest; ROC, receiver operating characteristic; SVM, support vector machine; WGCNA, weighted gene co-expression network analysis; XGB, extreme gradient boosting
Fig. 6
Fig. 6
An RF model consisting of five genes was estimated. (A) A nomogram was developed to predict the risk of hepatocellular carcinoma (HCC) based on the RF model. (B, C) Calibration curve (B) and decision curve analysis (DCA) (C) were employed to assess the predictive probability of the nomogram model. (D) ROC analysis of the RF model was conducted using five-fold cross-validation on the TCGA dataset. (E, F) The differential expression of the five key genes between normal and HCC tissues was examined in the GSE25097 (E) and TCGA (F) datasets, respectively. RF, random forest
Fig. 7
Fig. 7
The immune-infiltration in hepatocellular carcinoma (HCC) and its correlation with core genes in RF models. (A) Boxplots were used to demonstrate the differential expression of 22 infiltrated immune cells between normal and HCC samples (*P < 0.05, **P < 0.01, ***P < 0.001). (B) The relative abundances of immune cells were compared between normal and HCC samples. (C) A heatmap was constructed to depict the association between the five genes in the RF model and the 22 infiltrated immune cells (*P < 0.05, **P < 0.01, ***P < 0.001). The colours blue and red indicated negative and positive correlations, respectively
Fig. 8
Fig. 8
Construction of FA metabolism-related gene prognostic model in the TCGA cohort. (A) A forest plot was utilized to display the hazard ratio of nine FA-related genes with prognostic values, which were selected based on a univariate Cox regression analysis. (B, C) These nine genes with prognostic value underwent LASSO Cox regression analysis, resulting in the identification of four key FA-related genes (CYS2, F11, ANXA10, and SLC22A1) to build the predictive model for survival. (D) The OS rate of patients in high- and low-risk groups within the TCGA dataset was demonstrated utilizing Kaplan–Meier plots. (E–H) Separate Kaplan–Meier plots were generated for the survival analysis of each of the four model genes
Fig. 9
Fig. 9
The exploration and evaluation of the independent prognostic value of our prognostic model. (A, B) The forest plots were used to demonstrate the hazard ratio of risk score and other clinical characteristics based on a univariate cox regression analysis (A) and multivariate cox regression analysis (B). (C) The prognostic prediction power of the constructed signature and clinical items was assessed based on the AUC of survival ROC curves. (D) The time-dependent AUC of the ROC curves was utilized to estimate the one-, three-, and five-year OS rates of patients from TCGA. (E, F) The clinical characteristic differences between high- and low-risk groups of patients within the TCGA dataset were visualized using a heatmap (E) and a circlemap (F) (*P < 0.05, **P < 0.01, ***P < 0.001). (G, H) The differential expression of four prognostic genes between normal and HCC tissues was examined in GSE25097 (G) and TCGA (H) datasets respectively. (I, J) The external validation of the prognostic model used GSE14520 dataset. The comparation of the overall survival rates between low and high risk-score groups (I). ROC curve was utilized to estimate the OS rates of patients (J)
Fig. 10
Fig. 10
The role of SLC22A1 in determining the proliferation, migration, and death capacity of HCC cells. (A) The relative expression level of SLC22A1 mRNA and the survivorship curve of 47 patients with HCC enrolled in this study were presented. (B) Representative IHC staining of H&E and SLC22A1 in para-carcinoma tissue and HCC tissues of patients with HCC. The SLC22A1 expression level was quantified using ImageJ (NIH, Bethesda, MD, USA) software. (C) The expression level of SLC22A1 in different HCC cell lines and SLC22A1 overexpression cells were confirmed by western blotting. (D–F) The impact of SLC22A1 overexpression on the proliferation of HCC cells was evaluated using CCK-8 assays (D), clone formation assays (E), and EDU assays (F). (G) The migratory ability of HCC cells was assessed using Transwell assays. (H) The effect of SLC22A1 overexpression on cell death was determined by flow cytometry. (I) The tumorigenicities of SUN449 cells were determined by subcutaneously injecting the cells (5 × 106 cells/mouse; n = 5/group) into nude mice. Tumour volumes were measured using vernier calliper every 3 days for a duration of 27 days. The mice were sacrificed and tumour tissues were collected, and weighed at the end of the assay. HCC, hepatocellular cancer. Statistical significance was denoted by *P < 0.05, **P < 0.01, ***P < 0.001, and ns representing not significant

References

    1. Sung H, Ferlay J, Siegel RL, Laversanne M, Soerjomataram I, Jemal A, et al. Global Cancer statistics 2020: GLOBOCAN estimates of incidence and Mortality Worldwide for 36 cancers in 185 countries. Cancer J Clin. 2021;71(3):209–49. - PubMed
    1. Bray F, Laversanne M, Sung H, Ferlay J, Siegel RL, Soerjomataram I, et al. Global cancer statistics 2022: GLOBOCAN estimates of incidence and mortality worldwide for 36 cancers in 185 countries. CA Cancer J Clin. 2024;74(3):229–63. - PubMed
    1. Tsuchiya N, Sawada Y, Endo I, Saito K, Uemura Y, Nakatsura T. Biomarkers for the early diagnosis of hepatocellular carcinoma. (2219–840 (Electronic)). - PMC - PubMed
    1. Wang W, Wei C. Advances in the early diagnosis of hepatocellular carcinoma. (2352–3042 (Electronic)). - PMC - PubMed
    1. Omata M, Cheng AL, Kokudo N, Kudo M, Lee JM, Jia J et al. Asia-Pacific clinical practice guidelines on the management of hepatocellular carcinoma: a 2017 update. (1936 – 0541 (Electronic)). - PMC - PubMed

LinkOut - more resources