. 2024 Nov 15;30(1):219.
doi: 10.1186/s10020-024-00979-5.

CKS2 induces autophagy-mediated glutathione metabolic reprogramming to facilitate ferroptosis resistance in colon cancer

Affiliations

CKS2 induces autophagy-mediated glutathione metabolic reprogramming to facilitate ferroptosis resistance in colon cancer

Leilei Yang et al. Mol Med. .

Erratum in

Abstract

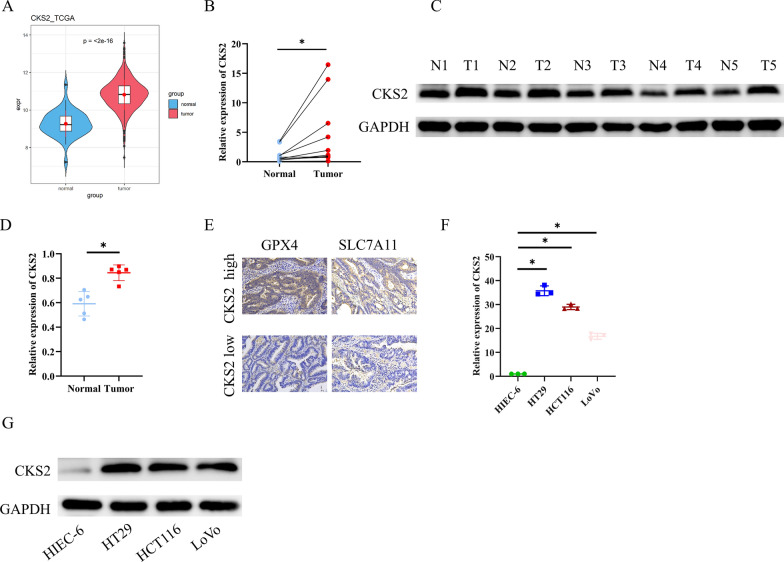
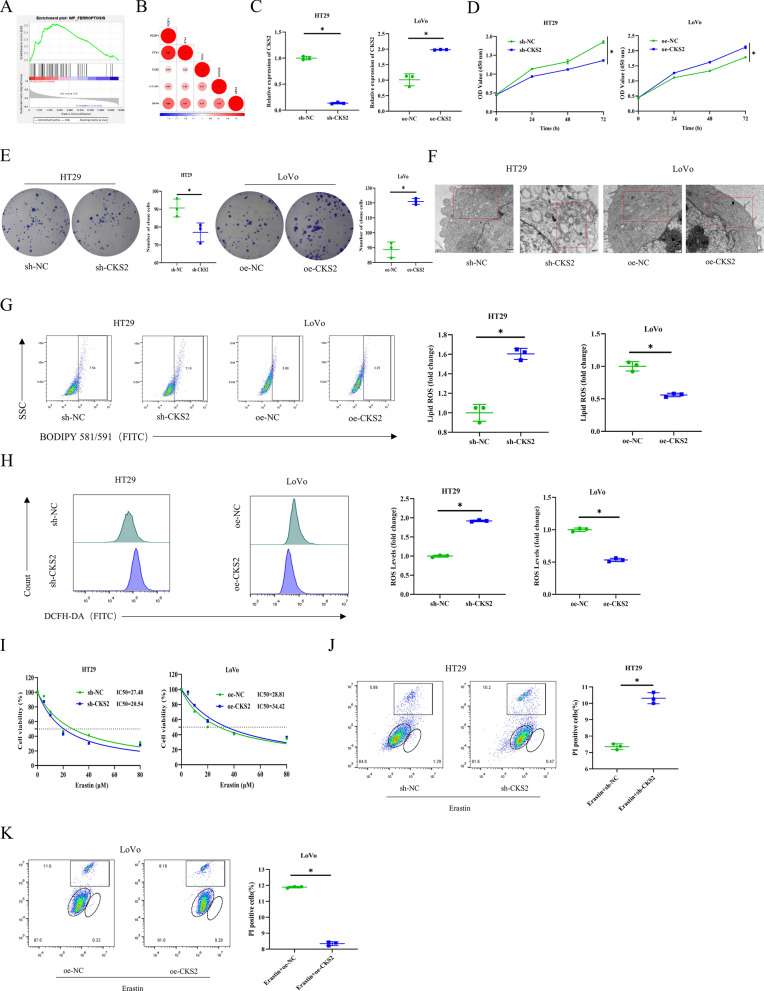
Background: Ferroptosis, a form of cell death characterized by lipid peroxidation, plays a crucial role in tumor suppression, offering novel avenues for cancer therapy. Previous studies have indicated that high levels of cyclin-dependent kinase subunit 2 (CKS2) promote the progression of various cancers. However, the potential interplay between CKS2 and ferroptosis in colon cancer (CC) remains unclear.

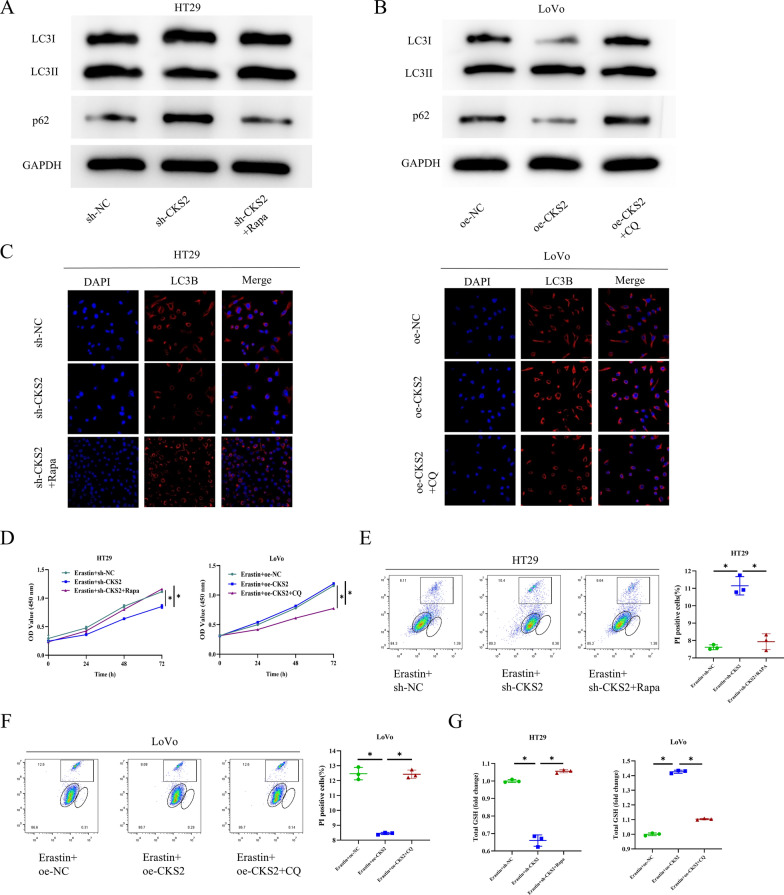
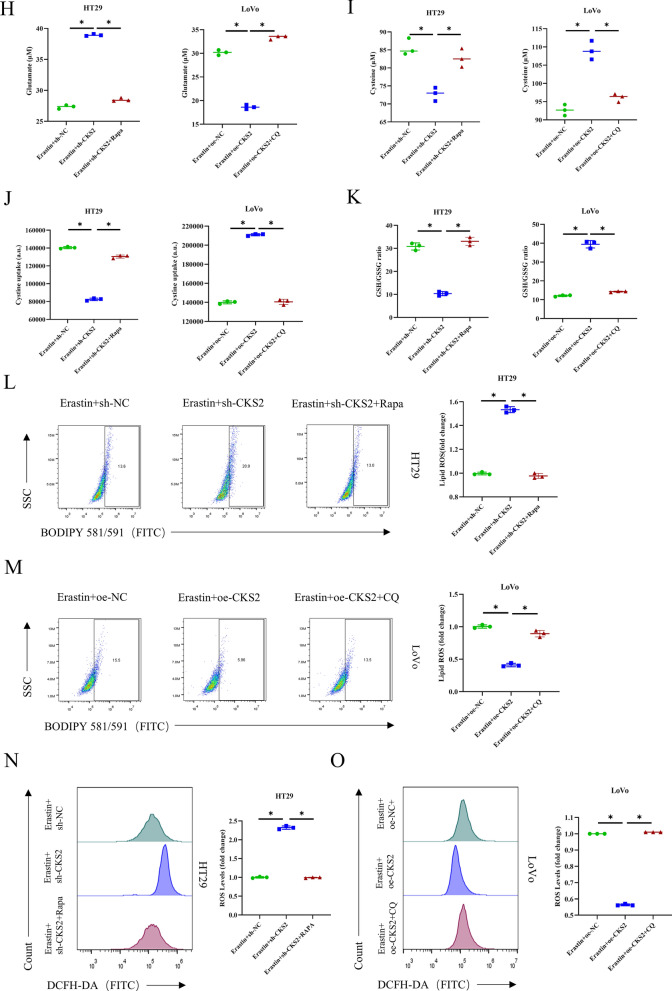
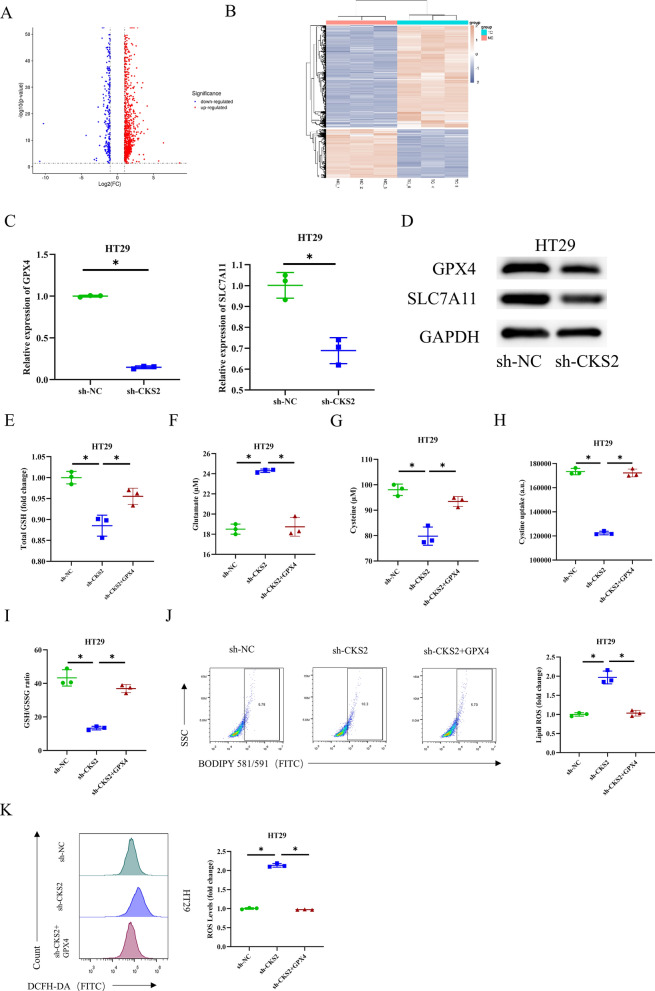
Methods: Bioinformatics and RNA-seq analyses were employed to study genes associated with the ferroptosis signaling pathway. CKS2 expression was evaluated using quantitative reverse transcription polymerase chain reaction (qRT-PCR) and Western blot (WB). The in vitro and in vivo effects of CKS2 on CC cells were assessed through the CCK-8 assay, colony formation assay, propidium iodide (PI) staining, BODIPY staining, DCFH-DA staining, and animal experiments. Additionally, the impact of CKS2 on autophagy and glutathione (GSH) metabolism was investigated using a transmission electron microscope (TEM), immunofluorescence (IF) assays, WB experiments, and relevant assay kits.

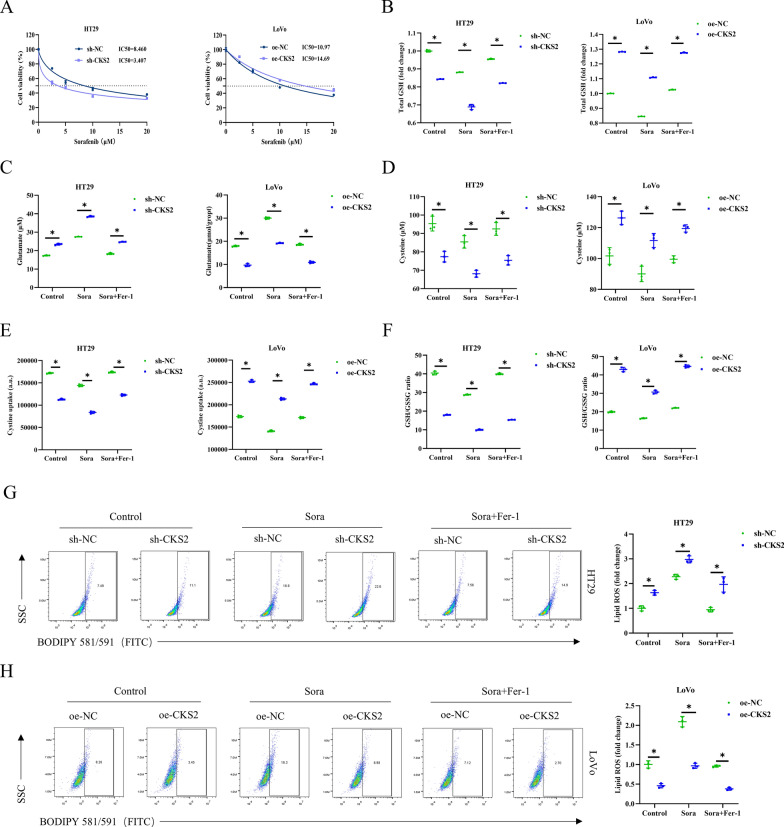
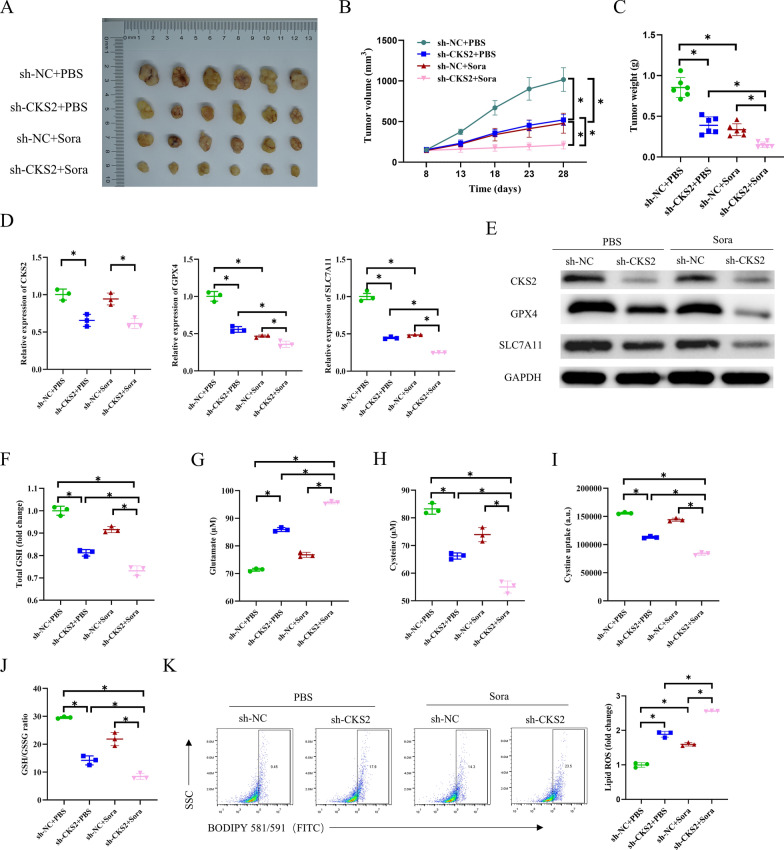
Results: CKS2 expression was elevated in CC, indicating a poor clinical outcome. Knockdown of CKS2 significantly enhanced Erastin-induced ferroptosis in CC cells, leading to reduced GSH metabolism. Conversely, CKS2 overexpression produced opposite effects. Mechanistically, CKS2-induced autophagy reinforced GSH metabolism, thereby increasing resistance to ferroptosis in CC cells. Furthermore, inhibiting CKS2 promoted tumor ferroptosis by downregulating GPX4 expression. Additionally, CKS2 knockdown effectively increased sorafenib-induced ferroptosis both in vitro and in vivo.

Conclusion: CKS2 suppresses ferroptosis in CC by modulating GSH metabolism in both in vitro and in vivo settings. These findings offer new insights into targeting CKS2 for CC treatment and shed light on the mechanism of ferroptosis in CC.

Keywords: Autophagy; Colon cancer; Cyclin-dependent kinase subunit 2; Ferroptosis; Glutathione metabolism.


Conflict of interest statement

Declarations Ethics approval and consent to participate The use of tissue samples was approved by the Ethics Committee of Taizhou Hospital, Wenzhou Medical University (approval number: KL20240457). And the animal study was approved by the Ethics Committee of Taizhou Hospital, Wenzhou Medical University (approval number: tzy-2024084). Consent for publication Not applicable. Competing interests The authors declare no competing interests.

Figures

Fig. 1
Fig. 1
Expression of CKS2 in CC tissues and cells A Analysis of CKS2 expression in human normal colon tissues (n = 41) and human CC tissues (n = 480) using the TCGA database; B–D qRT-PCR and WB analysis of CKS2 expression in normal tissues (n = 10) and tumor tissues (n = 10) of CC patients; E IHC evaluation of GPX4 and SLC7A11 levels in patients with different CKS2 expression (n = 2); F–G qRT-PCR and WB analysis of CKS2 expression in human CC cell lines (n = 3). Data are presented as the mean ± SD of three independent experiments. Statistical analysis was conducted by t-test. * means P < 0.05
Fig. 2
Fig. 2
Effects of CKS2 on CC cells ferroptosis. A Enriched pathway of CKS2 in bioinformatics analysis; B Positive correlation between CKS2 and inhibitory genes in ferroptosis; C: qRT-PCR detected CKS2 expression in cells of each group; D–E CCK-8 and clone formation assays measured cell viability and proliferation capacity in each group; F TEM observed morphological changes in mitochondria; G, L, M BODIPY581/591 staining assessed lipid ROS level in cells; H, N, O DCFH-DA staining analyzed cell ROS level; I CCK-8 measured IC50; J–K PI staining detected cell survival; P The kit for GSH and GSSG detection determined GSH level; Q Glutamate colorimetric kit measured glutamate level; R–S Cysteine colorimetric kit assessed cysteine level; T Cystine uptake fluorescence kit determined cystine uptake level; U The kit for GSH and GSSG detection measured GSH/GSSG ratio. Data are presented as the mean ± SD of three independent experiments. Statistical analysis was conducted by t-test. * means P < 0.05
Fig. 2
Fig. 2
Effects of CKS2 on CC cells ferroptosis. A Enriched pathway of CKS2 in bioinformatics analysis; B Positive correlation between CKS2 and inhibitory genes in ferroptosis; C: qRT-PCR detected CKS2 expression in cells of each group; D–E CCK-8 and clone formation assays measured cell viability and proliferation capacity in each group; F TEM observed morphological changes in mitochondria; G, L, M BODIPY581/591 staining assessed lipid ROS level in cells; H, N, O DCFH-DA staining analyzed cell ROS level; I CCK-8 measured IC50; J–K PI staining detected cell survival; P The kit for GSH and GSSG detection determined GSH level; Q Glutamate colorimetric kit measured glutamate level; R–S Cysteine colorimetric kit assessed cysteine level; T Cystine uptake fluorescence kit determined cystine uptake level; U The kit for GSH and GSSG detection measured GSH/GSSG ratio. Data are presented as the mean ± SD of three independent experiments. Statistical analysis was conducted by t-test. * means P < 0.05
Fig. 3
Fig. 3
CKS2 mediates GSH metabolism reprogramming through autophagy activation in CC cells A, WB measured expression levels of autophagy-related proteins (LC3I, LC3II, and p62); C IF detection assessed LC3B expression; D CCK-8 assay detected cell viability; E, F PI staining measured cell survival; G The kit for GSH and GSSG detection determined the level of GSH; H Glutamate colorimetric kit analyzed the level of glutamate; I Cysteine colorimetric kit assessed the level of cysteine; J Cystine uptake fluorescence kit determined cystine uptake level; K The kit for GSH and GSSG detected GSH/GSSG ratio; L, M BODIPY581/591 staining tested lipid ROS level; N, O DCFH-DA staining examined cell ROS level. Data are presented as the mean ± SD of three independent experiments. Statistical analysis was conducted by one-way ANOVA. * means P<0.05
Fig. 3
Fig. 3
CKS2 mediates GSH metabolism reprogramming through autophagy activation in CC cells A, WB measured expression levels of autophagy-related proteins (LC3I, LC3II, and p62); C IF detection assessed LC3B expression; D CCK-8 assay detected cell viability; E, F PI staining measured cell survival; G The kit for GSH and GSSG detection determined the level of GSH; H Glutamate colorimetric kit analyzed the level of glutamate; I Cysteine colorimetric kit assessed the level of cysteine; J Cystine uptake fluorescence kit determined cystine uptake level; K The kit for GSH and GSSG detected GSH/GSSG ratio; L, M BODIPY581/591 staining tested lipid ROS level; N, O DCFH-DA staining examined cell ROS level. Data are presented as the mean ± SD of three independent experiments. Statistical analysis was conducted by one-way ANOVA. * means P<0.05
Fig. 4
Fig. 4
The effect of CKS2 upregulating GPX4 on ferroptosis. A Volcano plot of DEGs (DEGs: 1494, upregulated genes: 1011, downregulated genes: 483); B Cluster analysis of DEGs, where the horizontal axis represents sample names and clustering results, and the vertical axis represents DEGs and gene clustering results (NC represents sh-NC group, TC represents sh-CKS2 group); C, D qRT-PCR and WB detected mRNA and protein expression levels of GPX4 and SLC7A11 in CC cells; E The kit for GSH and GSSG determined the level of GSH; F Glutamate colorimetric kit assessed the level of glutamate; G Cysteine colorimetric kit tested the level of cysteine; H Cystine uptake fluorescence kit examined cystine uptake level; I The kit for GSH and GSSG detected GSH/GSSG ratio; J BODIPY581/591 staining analyzed lipid ROS level; K DCFH-DA staining measured cell ROS level. Data are presented as the mean ± SD of three independent experiments. Statistical analysis was conducted by one-way ANOVA. * means P < 0.05
Fig. 5
Fig. 5
Repression of CKS2 facilitates sora-induced ferroptosis. A CCK-8 detected IC50; B The kit for GSH and GSSG measured the level of GSH; C Glutamate colorimetric kit determined the level of glutamate; D Cysteine colorimetric kit measured the level of cysteine; E Cystine uptake fluorescence kit tested cystine uptake level; F The kit for GSH and GSSG detected GSH/GSSG ratio; G, H BODIPY581/591 staining analyzed lipid ROS level. Data are presented as the mean ± SD of three independent experiments. Statistical analysis was conducted by t-test. * means P < 0.05
Fig. 6
Fig. 6
The effect of CKS2 and sora on tumorigenesis in nude mice. A Images of tumors in nude mice treated with PBS and sora in sh-NC and sh-CKS2 groups (n = 6); B Tumor growth curves in sh-NC and sh-CKS2 groups after treatment with PBS and sora (n = 6); C Tumor weight in sh-NC and sh-CKS2 groups after treatment with PBS and sora (n = 6); D, E qRT-PCR and WB measured mRNA and protein expression levels of CKS2, GPX4, and SLC7A11 in nude mouse tumors (n = 3); F The kit for GSH and GSSG determined level of GSH; G Glutamate colorimetric kit assessed glutamate level (n = 3); H Cysteine colorimetric kit detected cysteine level (n = 3); I Cystine uptake fluorescence kit determined cystine uptake levels (n = 3); J The kit for GSH and GSSG determined GSH/GSSG ratio (n = 3); K BODIPY581/591 staining detect lipid ROS level (n = 3). Data are presented as the mean ± SD of six/three independent experiments. Statistical analysis was conducted by one-way ANOVA. * means P < 0.05

Similar articles

Cited by

References

    1. Chen Y, Zhu G, Liu Y, Wu Q, Zhang X, Bian Z, et al. O-GlcNAcylated c-Jun antagonizes ferroptosis via inhibiting GSH synthesis in liver cancer. Cell Signal. 2019;63:109384. - PubMed
    1. Chen X, Kang R, Kroemer G, Tang D. Broadening horizons: the role of ferroptosis in cancer. Nat Reviews Clin Oncol. 2021;18:280–96. - PubMed
    1. Chen L, Hu K, Liu Y, Liu L, Tang J, Qin X. Knockdown of replication protein A 3 induces protective autophagy and enhances cisplatin sensitivity in lung adenocarcinoma by inhibiting AKT/mTOR signaling via binding to cyclin-dependent kinases regulatory subunit 2. Drug Dev Res. 2022a;83:1589–99. - PubMed
    1. Chen H, Wang C, Liu Z, He X, Tang W, He L, et al. Ferroptosis and its multifaceted role in cancer: mechanisms and therapeutic approach. Antioxid (Basel). 2022;11:1504. - PMC - PubMed
    1. Chen Y, Lin B, Yang S, Huang J. IRF1 suppresses colon cancer proliferation by reducing SPI1-mediated transcriptional activation of GPX4 and promoting ferroptosis. Exp Cell Res. 2023;431:113733. - PubMed

LinkOut - more resources