. 2024 Nov 15;22(1):1027.
doi: 10.1186/s12967-024-05821-4.

Single-cell transcriptomics link gene expression signatures to clinicopathological features of gonadotroph and lactotroph PitNET

Affiliations

Single-cell transcriptomics link gene expression signatures to clinicopathological features of gonadotroph and lactotroph PitNET

T Elise Potthoff et al. J Transl Med. .

Abstract

Background: Pituitary neuroendocrine tumors (PitNET) are among the most common intracranial tumors. Despite a frequent benign course, aggressive behavior can occur. Tumor behavior is known to be under the influence of the tumor microenvironment (TME). However, the relationship between TME cells and aggressive tumor behavior has not been adequately explored in PitNET.

Methods: We performed differential expression analysis as well as gene expression program identification based on single-cell RNA sequencing to comparatively characterize the transcriptome of seven gonadotroph and three lactotroph PitNET and correlate it with clinical features using bulk RNA-seq data from an independent cohort of 134 PitNET. Tumor immune infiltration was quantified via immunostaining on tissue sections of gonadotroph and lactotroph PitNET.

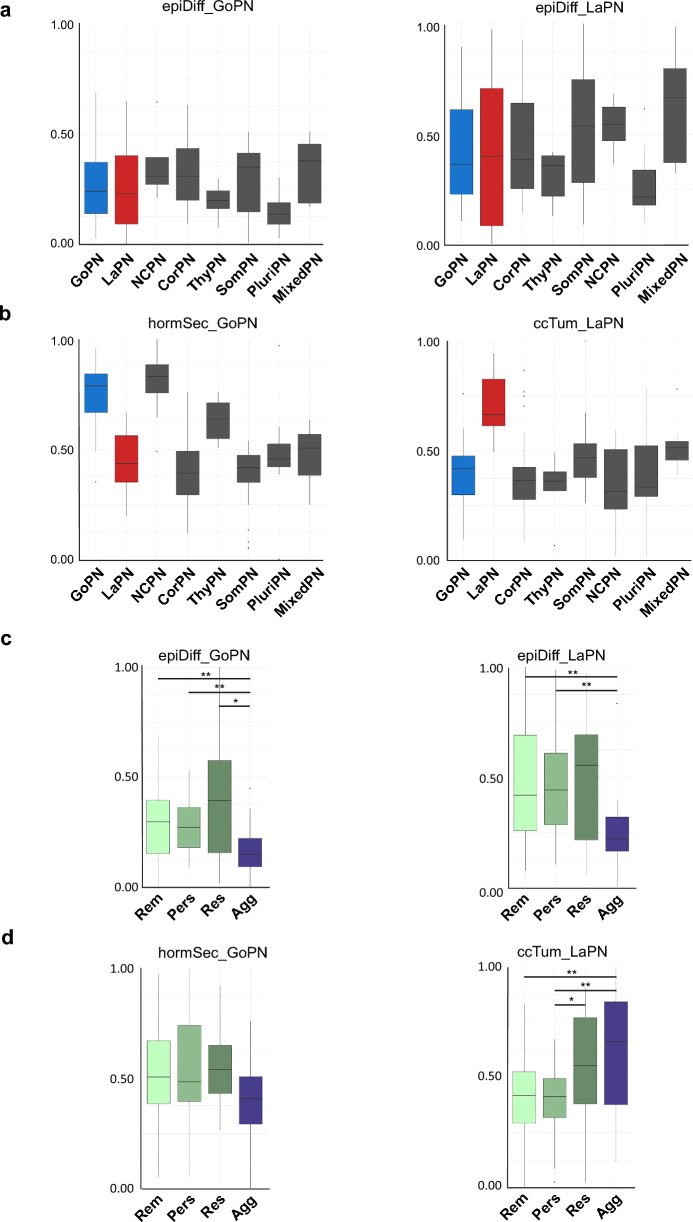
Results: In lactotroph PitNET, we detect a highly proliferative gene profile with significantly increased expression levels in aggressively growing tumors within bulk RNA-seq data of an independent cohort of 134 PitNET samples. We also report high intratumoral heterogeneity in gonadotroph PitNET (GoPN) and lactotroph PitNET (LaPN) and identify signatures of epithelial, endocrine, and immunological gene networks in both subtypes. A comparison of their TME composition shows enrichment of SPP1+ macrophages and CD4+ T cells in GoPN, as well as enrichment of CD4/CD8 double-negative T cells (DN) and natural killer cells (NK) in LaPN. Also notable is the presence of proliferative lymphocytes, the occurrence of which positively correlates with more aggressive tumor behavior in the bulk RNA-seq cohort. However, increased CD8+ T and NK cell abundances correlate significantly with reduced aggressiveness indicating potential anti-tumoral effects.

Conclusions: Our study expands the knowledge of the differences in cellular composition of gonadotroph and lactotroph PitNET subtypes. It lays the foundation for further studies on the influence of lymphoid cells on the variable aggressive behavior of PitNET. Regarding the treatment of drug-resistant lactotroph PitNET, proliferative lymphocytes, CD8+ T, and NK cells could represent potentially valuable targets for developing new cancer immunotherapies.

Keywords: Gonadotroph; Intratumoral heterogeneity; Lactotroph; Pituitary neuroendocrine tumor (PitNET); Single-cell RNA sequencing; Tumor microenvironment.


Conflict of interest statement

Declarations Ethics approval and consent to participate Ten human PitNET samples from patients treated at the Department of Neurosurgery, University Hospital of Münster, Münster, Germany, were used for scRNA-seq with ethical committee agreement (2017–261-f-S, Münster, Germany). Consent for publication Not applicable. Competing interests The authors have no relevant competing (financial and/or non-financial) interests.

Figures

Fig. 1
Fig. 1
The single-cell transcriptomic landscapes of GoPN and LaPN. a UMAP plot showing integration and clustering of seven GoPN samples and b of three LaPN samples, as determined by scRNA-seq. c Cell type annotation of GoPN, and d of LaPN based on known marker genes and inferred CNV analysis (see Suppl. Figure 2 and Suppl. Figure 3). Clusters highlighted in red indicate selected tumor cell clusters (cluster 9 and 14 in GoPN, cluster 14 and 22 in LaPN) with specific gene signatures. Heatmaps of the relative expression levels of these and other tumor cell cluster-specific gene signatures are shown in (e), together with their functional gene ontology association and representative marker genes. ccImm cycling immune cells, ccTum cycling tumor cells, EC endothelial cells, epiDiff epithelial differentiation and proliferation, GoPN gonadotroph PitNET, hormSec hormone secretion, OxPhos oxidative phosphorylation, LaPN lactotroph PitNET, PC pericytes, UMAP uniform manifold approximation and projection
Fig. 2
Fig. 2
Tumor-specific gene signatures correlate with clinicopathological features of PitNET. a Boxplots showing the normalized expression level of the condensed epithelial gene signatures derived from GoPN or LaPN single-cell data (epiDiff_GoPN, epiDiff_LaPN) in a bulk RNA-seq cohort comprising 134 PitNET tumors (29 gonadotroph (GoPN), 16 lactotroph (LaPN), 8 null-cell (NCPN), 35 corticotroph (CorPN), 6 thyrotroph (ThyPN), 23 somatotroph (SomPN), 9 plurihormonal (PluriPN) and 8 mixed (MixedPN) PitNET) [28]. b Boxplots of the normalized expression levels of the condensed hormone secretion signature (hormSec) from GoPN (left) and the cycling tumor cell signature (ccTum) from LaPN (right). For a statistical analysis of (a, b) see Suppl. Table 5. c, d Correlation of GoPN or LaPN gene signatures with aggressiveness level and/or clinical behavior of the bulk RNA-seq PitNET cohort (Rem, remission, n = 60; Pers, persistent, n = 48; Res, resistant, n = 12; Agg, aggressive, n = 14). Statistical analysis was performed using an unpaired two-sample Wilcoxon test, with */**/***/**** indicating p ≤ 0.05/0.01/0.001/0.0001, respectively. Non-significant results remain unmarked
Fig. 3
Fig. 3
Tumor microenvironment of GoPN and LaPN. a UMAP plot with cell type annotation of GoPN, and b of LaPN tumors. c Pie charts showing the relative proportions of lymphoid, myeloid, and other cell types in the TME of GoPN and LaPN. d Relative distribution of all cell types, including tumor cells in GoPN (left) and LaPN (right), based on the number of cells per annotated cluster. e Quantification of immunostaining of the myeloid marker CD68 (top) and the T cell marker CD3 (bottom) in tissue sections of GoPN (n = 20) and LaPN (n = 19) tumors. Relative tumor cell infiltration (y-axis) was assessed by expert judgment, and the differences in mean score values of GoPN (red) versus LaPN (blue) were tested for significance using a Mann–Whitney U-test. ns, not specific. B B-cells, ccLy cycling lymphoid cells, ccImm cycling immune cells, CD4/CD8DN CD3+CD4/CD8-double negative T cells, cDC CD1C-expressing conventional dendritic cells, EC endothelial cells, act.Macs activated macrophages (act-Macs), MC mast cells, MiMe high-level expression of mitochondrial and metabolic genes, NK natural killer cells, PC pericytes, Plasma plasma B-cells
Fig. 4
Fig. 4
Distinct cell type expressions in myeloid cells in GoPN and LaPN. a Cluster arrangement of the myeloid cells from both GoPN and LaPN tumors after integration. b Dot plot showing the average expression levels (avg. exp.) and occurrence (pct. exp.) of myeloid cell type-specific marker genes in the individual clusters. c UMAP plot with annotated myeloid cells from GoPN and LaPN. d Relative distribution of identified cell types within GoPN and LaPN cells. cDC CD1C-expressing conventional dendritic cells, MDSC myeloid-derived suppressor cells, Mono monocytes, TAMs tumor-associated macrophages
Fig. 5
Fig. 5
The lymphoid compartment and its relation to clinicopathological features of PitNET. a Cluster arrangement of the lymphoid compartment from both GoPN and LaPN tumors after integration. b Relative proportions of GoPN and LaPN cells in the identified clusters. ce Expression of cycling lymphoid cell (ccLy), CD8+ T cell (CD8+), and natural killer cell (NK) signatures in PitNET tumors [28], categorized by degree of aggressiveness in (c), invasion into the sphenoid sinus in (d), or by proliferation index (percentage of MIB1-stained Ki67-positive cells) in (e). Statistical analysis was done as in Fig. 2 (Suppl. Table 9). ILC innate lymphoid cells
Fig. 6
Fig. 6
Correlation of distinct tumor and lymphoid cell signatures associated with better or worse tumor progression outcome. Linear correlation of expression values of a CD8+ T cell (CD8+) signature with tumor signature epiDiff_GoPN, b cycling lymphoid cell (ccLy) signature with cycling tumor cell (ccTum) signature and natural killer cell (NK) signature with both tumor signatures epiDiff_GoPN (c) and epiDiff_LaPN (d). Signatures associated with a less aggressive outcome are marked in green, while those associated with a more aggressive outcome are marked in red. Pearson correlation coefficient (R) and p-value are indicated (p)

References

    1. Karimian-Jazi K. Hypophysentumoren (pituitary gland tumors). Radiologe. 2019;59:982–91. 10.1007/s00117-019-0570-1. - PubMed
    1. Melmed S, Kaiser UB, Lopes MB, et al. Clinical biology of the pituitary adenoma. Endocr Rev. 2022;43:1003–37. 10.1210/endrev/bnac010. - PMC - PubMed
    1. Oh JY, Osorio RC, Jung J, et al. Transcriptomic profiles of normal pituitary cells and pituitary neuroendocrine tumor cells. Cancers. 2022. 10.3390/cancers15010110. - PMC - PubMed
    1. Asa SL, Mete O, Perry A, et al. Overview of the 2022 WHO classification of pituitary tumors. Endocr Pathol. 2022;33:6–26. 10.1007/s12022-022-09703-7. - PubMed
    1. Vroonen L, Daly AF, Beckers A. Epidemiology and management challenges in prolactinomas. Neuroendocrinology. 2019;109:20–7. 10.1159/000497746. - PubMed