. 2024 Nov 15;16(1):133.
doi: 10.1186/s13073-024-01405-5.

Efficacy and safety of novel multiple-chain DAP-CAR-T cells targeting mesothelin in ovarian cancer and mesothelioma: a single-arm, open-label and first-in-human study

Affiliations

Efficacy and safety of novel multiple-chain DAP-CAR-T cells targeting mesothelin in ovarian cancer and mesothelioma: a single-arm, open-label and first-in-human study

Tongpeng Xu et al. Genome Med. .

Abstract

Background: Despite remarkable achievements in applying chimeric antigen receptor (CAR)-T cells to treat hematological malignancies, they remain much less effective against solid tumors, facing several challenges affecting their clinical use. We previously showed that multichain DNAX-activating protein (DAP) CAR structures could enhance the safety and efficacy of CAR-T cells when used against solid tumors. In particular, mesothelin (MSLN)-targeted CAR-T cell therapy has therapeutic potential in MSLN-positive solid tumors, including ovarian cancer and mesothelioma.

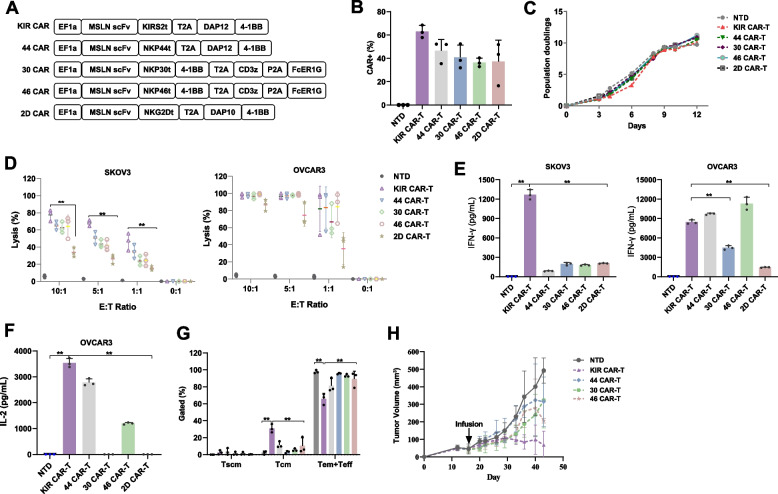
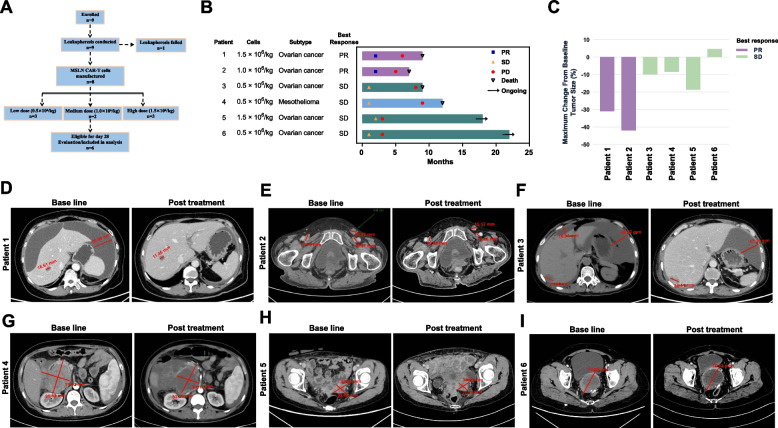
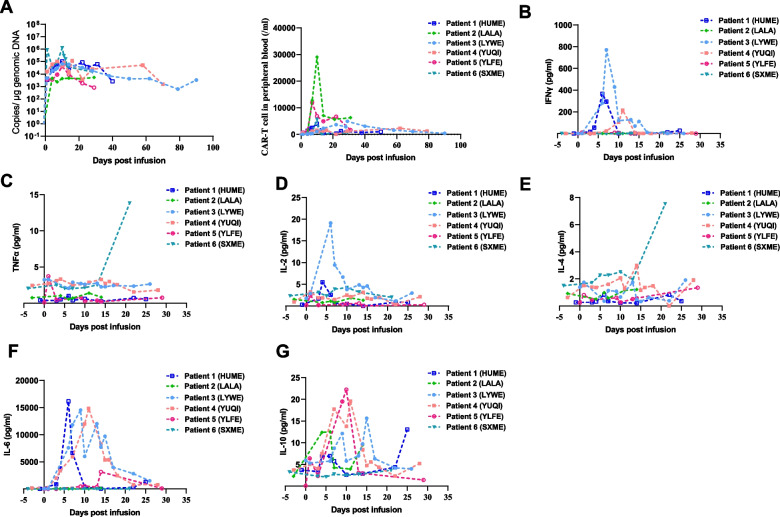
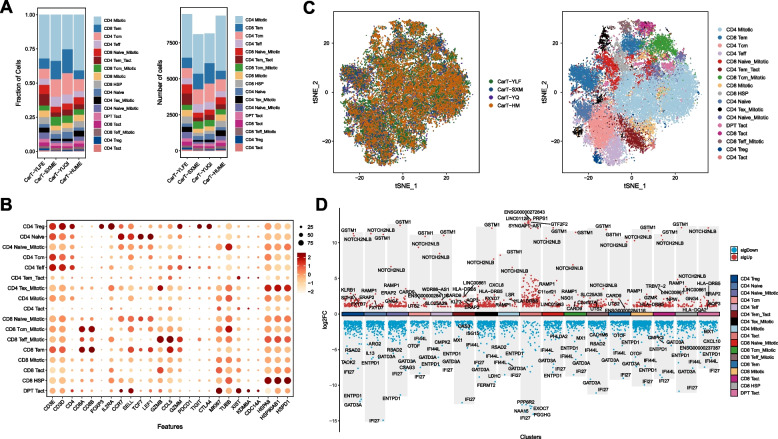
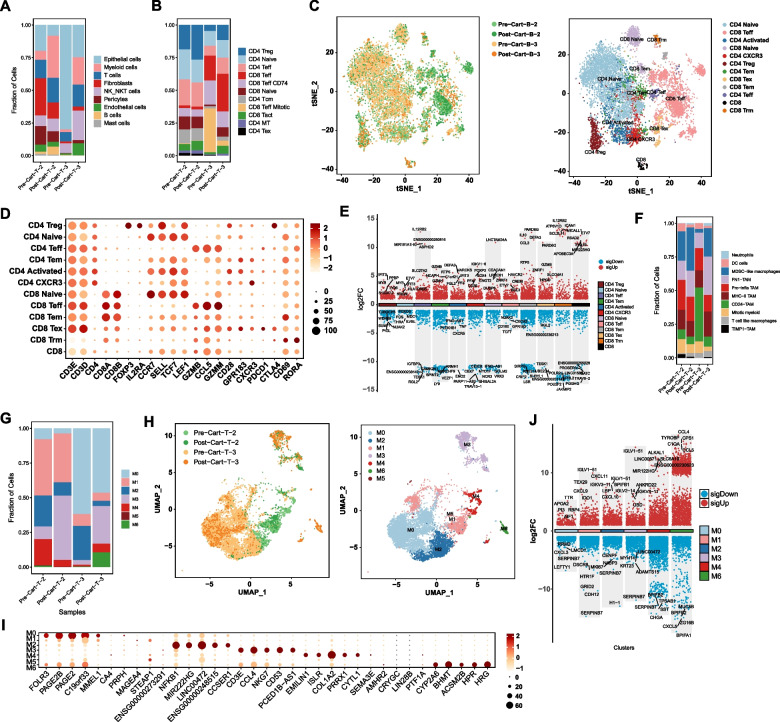
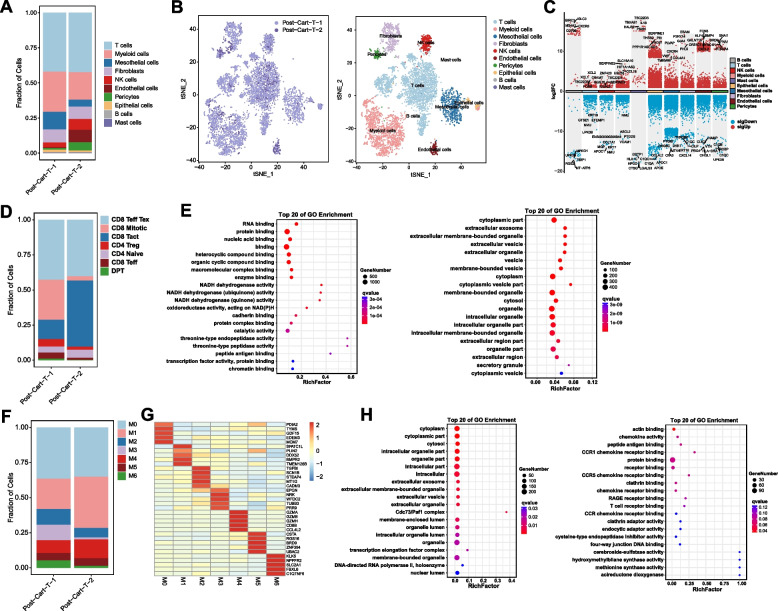
Methods: In vitro cell killing assays and xenograft model were utilized to determine the anti-tumor efficacy of MSLN targeting DAP-CAR-T cells and other CAR-T cells. ELISA and flow cytometry analysis were used to assess the cytokine secretion capacity and proliferation ability. Eight patients with MSLN expression were enrolled to evaluate the safety and efficacy of MSLN-DAP CAR-T cell therapy. Single-cell sequencing was performed to explore the dynamics of immune cells in patients during treatment and to identify the transcriptomic signatures associated with efficacy and toxicity.

Results: We found that multichain DAP-CAR formed by combining a natural killer cell immunoglobulin-like receptor truncator and DAP12 exhibited better cytotoxicity and tumor-killing capacity than other natural killer cell-activated receptors associated with DAP12, DAP10, or CD3Z. The safety and efficacy of MSLN-DAP CAR-T cell therapy in patients with ovarian cancer and mesothelioma were evaluated in a single-arm, open-label clinical trial (ChiCTR2100046544); two patients achieved partial response, while four patients had a stable disease status. Furthermore, single-cell sequencing analysis indicated that KT032 CAR-T cell infusion could recruit more immune cells and temporarily remodel the TME.

Conclusions: Our study highlights the safety and therapeutic efficacy of multiple-chain DAP-CAR-T cell therapy targeting MSLN to treat patients with ovarian cancer and mesothelioma.

Trial registration: ChiCTR.org.cn, ChiCTR2100046544 . May 21, 2021.

Keywords: CAR-T cells; Efficacy; MSLN; Mesothelioma; Ovarian cancer; Safety.


Conflict of interest statement

Declarations Ethics approval and consent to participate This study was approved by the Institution Review Board of The First Affiliated Hospital of Nanjing Medical University (2021-SR-084). This study conformed to the principles of the Helsinki Declaration. Healthy donors or patients consented to participate in the study. All participants provided written informed consent prior to participation. The animal experiment in this study was approved by the Institutional Ethics Committee of Nanjing Medical University (IACUC2103036). Consent for publication All participants provided written informed consent for publication. Competing interests Authors EX-W, C-W, and JZ-Z were employed by Nanjing CART Medical Technology Co., Ltd. The other authors declare that they have no competing interests.

Figures

Fig. 1
Fig. 1
Killer cell immunoglobulin-like receptor (KIR) Chimeric antigen receptor (CAR) is the optimal CAR structure based on natural killer (NK) cell activation receptors. A CAR design based on various NK cell activation receptor combinations. B Flow cytometric analysis of CAR-positive T cell percentage 7 days after lentiviral transduction. C Expansion of different CAR-T and control non-transduced (NTD) cells. D xCELLigence RTCA system evaluation of in vitro cytotoxicity of different MSLN CAR-T and NTD cells against SKOV37 and OVCAR3 cells. E ELISA analysis of IFN-γ secretion by different MSLN CAR-T cells following co-culture with SKOV37 and OVCAR3 cells (E:T, 2:1). F ELISA analysis of IL-2 secretion by different MSLN CAR-T cells following co-culture with OVCAR3 cells (E:T, 2:1). G Flow cytometry-based gating strategy for identifying Tn, Tcm, Tem, and Tef subsets in NTD and different MSLN CAR-T cells. H Tumor growth curves demonstrating the antitumor efficacy of NTD or different MSLN CAR-T cells in a SKOV3-derived xenograft model. Statistical significance: **P < 0.01
Fig. 2
Fig. 2
AI Evaluation of the efficacy and safety of KT032 in patients with ovarian cancer and mesothelioma. A The study schema is shown. Subjects were screened for enrolment, underwent leukapheresis for CAR-T cell manufacturing, and infused with varying doses of CAR-T cells. B A swimmer plot was drawn to show patients’ response and time to disease progression in months. C A waterfall plot was drawn to show the determined percent change in tumor burden. D CT images showing the longest dimension of an initially responding tumor lesion at baseline, and at different time points after receiving KT032 cell infusion
Fig. 3
Fig. 3
KT032 cell pharmacokinetics and cytokine levels in peripheral blood of patients. A The pharmacokinetics of KT032 cell copy number in patients were evaluated using qPCR. The pharmacokinetics of KT032 cells in patients’ peripheral blood were assessed using qPCR and flow cytometry. B ELISA analysis of IFN-γ levels in patients’ peripheral blood. C ELISA analysis of TNFα levels in patients’ peripheral blood. D ELISA analysis of IL-2 levels in patients’ peripheral blood. E ELISA analysis of IL-4 levels in patients’ peripheral blood. F ELISA analysis of IL-6 levels in patients’ peripheral blood. G ELISA analysis of IL-10 levels in patients’ peripheral blood
Fig. 4
Fig. 4
Single-cell sequencing analysis of the properties of KT032 from different patients. A The bar chart shows the proportional distribution (left) and the absolute distribution (right) of various T cell types in four cases with KT032 cell transfusion. B The bubble plot displays the expression levels of key marker genes in various types of T cells with KT032 cell transfusion. The size of the bubbles represents the percentage of gene expression in the cells, and the color of the bubbles represents the average level of gene expression. C The distribution of various types of T cells in the t-distributed stochastic neighbor embedding (tSNE) plot for four cases with KT032 cell transfusion. D The volcano plot of the differential analysis shows the upregulated and downregulated genes in various T cell clusters with KT032 cell transfusion products compared with PR samples. Upregulated genes are shown in red, downregulated genes in blue, and the symbols of the top five genes with the largest differences in upregulation and downregulation are labeled. The differential threshold is set as fold change > 2 and P < 0.05
Fig. 5
Fig. 5
Single-cell sequencing analysis of the properties of the immune and tumor cells after infusion of KT032 in patients with ovarian cancer. A The bar chart shows the proportional distribution of various cell types in tumor samples from patients with ovarian cancer before and after KT032 treatment. B The bar chart shows the proportional distribution of various T cells in tumor samples from patients with ovarian cancer before and after KT032 treatment. C The tSNE plot illustrates the distribution of different types of T cells in tumor samples from patients with ovarian cancer before and after KT032 treatment. D The bubble plot displays the expression levels of key marker genes for different types of T cells in tumors from patients with ovarian cancer. The size of the bubbles represents the percentage of gene expression in the cells, while the color represents the average level of gene expression. E The volcano plot of the differential analysis shows the upregulated and downregulated genes in various T cell clusters of tumors from patients with ovarian cancer after treatment compared with before treatment. Upregulated genes are shown in red, downregulated genes in blue, and the symbols of the top five genes with the largest differential expression are labeled. The differential threshold is fold change (FC) > 2 and P <0.05. F The bar chart illustrates the proportional distribution of different myeloid cells in tumor samples from patients with ovarian cancer before and after CAR-T treatment. G The bar chart displays the proportional distribution of different malignant cells in tumor samples from patients with ovarian cancer before and after CAR-T treatment. H The tSNE plot shows the distribution of different malignant cells in tumor samples of patients with ovarian cancer before and after CAR-T treatment. I The bubble plot shows the expression levels of the top five upregulated genes in various malignant cells in ovarian cancer tumor samples. The size of the bubbles represents the percentage of gene expression in the cells, while the color represents the average level of gene expression. J The volcano plot of differential analysis shows the upregulated and downregulated genes in tumor samples from patients with ovarian cancer after treatment compared with before treatment. Upregulated genes are shown in red, downregulated genes in blue, and the symbols of the top five genes with the largest differential expression are labeled. The differential threshold is FC > 2 and P < 0.05
Fig. 6
Fig. 6
Single-cell sequencing analysis of the properties of the immune and tumor cells after infusion of KT032 in a patient with mesothelioma. A The bar chart shows the proportional distribution of different cell types in tumor samples from patients with mesothelioma after KT032 therapy in two stages. B The tSNE plot illustrates the distribution of different cell types in tumor samples from patients with mesothelioma after KT032 therapy in two stages. C The volcano plot of differential analysis displays the upregulated and downregulated genes in tumor samples from patients with mesothelioma after KT032 therapy in stage two compared with stage one. Upregulated genes are shown in red, downregulated genes in blue, and the top five genes with the largest differences in upregulation or downregulation are labeled with their symbols. The differential threshold is FC > 2 and P < 0.05. D The bar chart presents the proportional distribution of different T cell types in tumor samples from patients with mesothelioma after KT032 therapy in two stages. E The bubble plot shows the top 20 enriched pathways (q-value) for differentially expressed genes between CD8+ mitotic T cells (left) and CD8+ Tact cells (right) in tumor samples from patients with mesothelioma after KT032 therapy in two stages. F The bar chart displays the proportional distribution of different malignant cell types in tumor samples from patients with mesothelioma after KT032 therapy in two stages. G The heatmap illustrates the expression levels of the top five upregulated genes in different malignant cell types in tumor samples from patients with mesothelioma. The color represents the average gene expression level. H The bubble plot shows the top 20 enriched pathways (q-value) for upregulated genes in the M3 subgroup (left) and M4 subgroup (right) of tumor samples from patients with mesothelioma after KT032 therapy

Similar articles

Cited by

References

    1. Sterner RC, Sterner RM. CAR-T cell therapy: current limitations and potential strategies. Blood Cancer J. 2021;11:69. - PMC - PubMed
    1. Holstein SA, Lunning MA. CAR T-cell therapy in hematologic malignancies: a voyage in progress. Clin Pharmacol Ther. 2020;107:112–22. - PubMed
    1. San-Miguel J, Dhakal B, Yong K, Spencer A, Anguille S, Mateos MV, Fernandez de Larrea C, Martinez-Lopez J, Moreau P, Touzeau C, et al. Cilta-cel or standard care in lenalidomide-refractory multiple myeloma. N Engl J Med. 2023;389:335–47. - PubMed
    1. Qu X, An G, Sui W, Wang T, Zhang X, Yang J, Zhang Y, Zhang L, Zhu D, Huang J, et al. Phase 1 study of C-CAR088, a novel humanized anti-BCMA CAR T-cell therapy in relapsed/refractory multiple myeloma. Journal For Immunotherapy of Cancer. 2022;10:e005145. - PMC - PubMed
    1. Martinez M, Moon EK. CAR T cells for solid tumors: new strategies for finding, infiltrating, and surviving in the tumor microenvironment. Front Immunol. 2019;10:128. - PMC - PubMed

LinkOut - more resources