

Towards clinical translation of urinary vitronectin for non-invasive detection and monitoring of renal fibrosis in kidney transplant patients
- PMID: 39548536
- PMCID: PMC11566717
- DOI: 10.1186/s12967-024-05777-5
Towards clinical translation of urinary vitronectin for non-invasive detection and monitoring of renal fibrosis in kidney transplant patients
Abstract
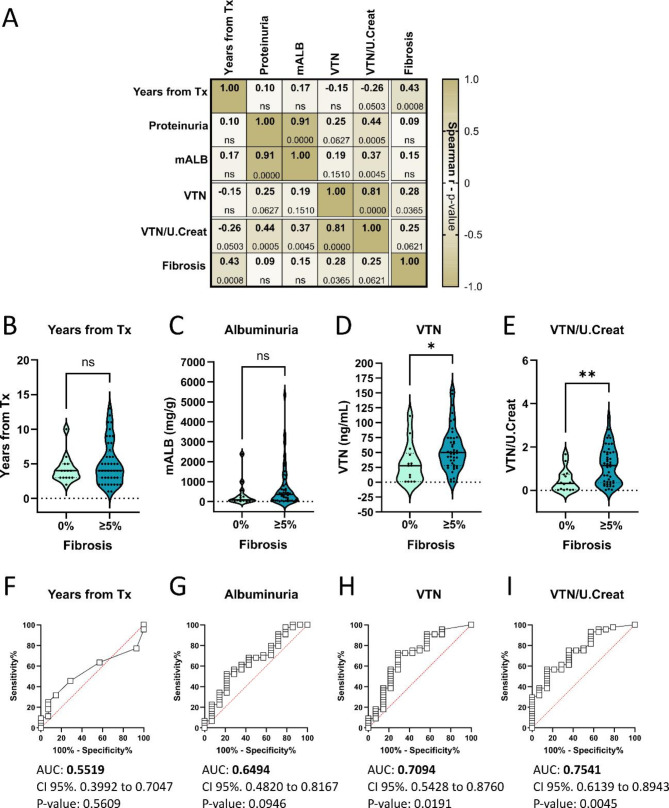
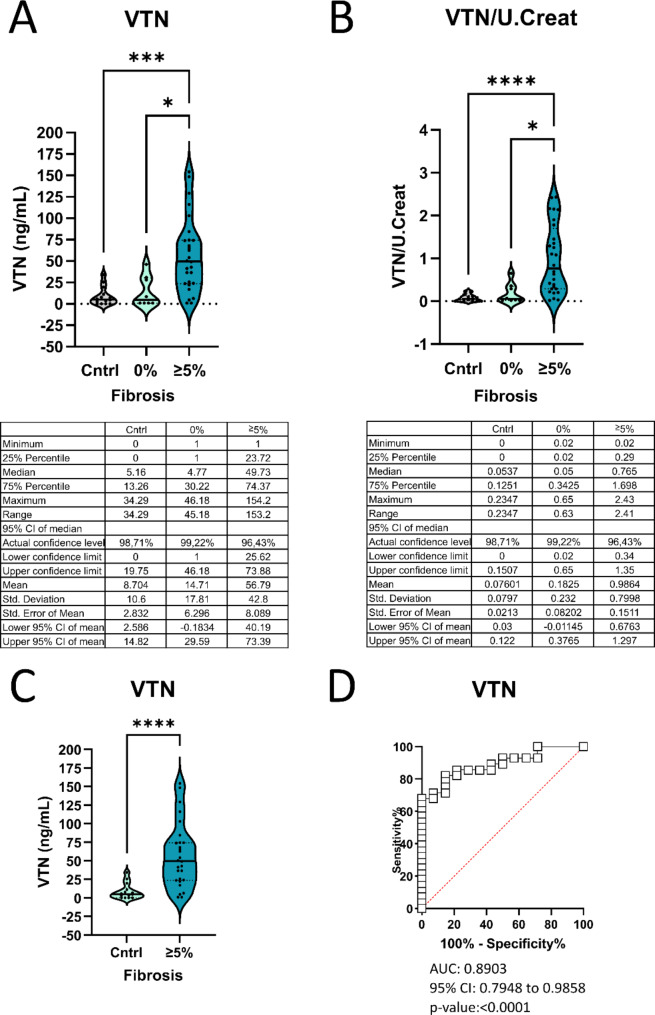
Background: Interstitial fibrosis and tubular atrophy (IFTA) is a critical factor in the prognosis of kidney health. Currently, IFTA quantitation in kidney biopsy samples is crucial for diagnosis and assessing disease severity, but the available non-invasive biomarkers are not satisfactory. Proteomic studies identified urinary vitronectin (VTN) as a potential biomarker for kidney fibrosis. As mass spectrometry techniques are not practical for use in clinical settings, we tested whether evaluation of urinary VTN levels through enzyme-linked immunosorbent assay (ELISA) can help monitor fibrotic changes in kidney transplant recipients and prove the clinical viability of the assay.
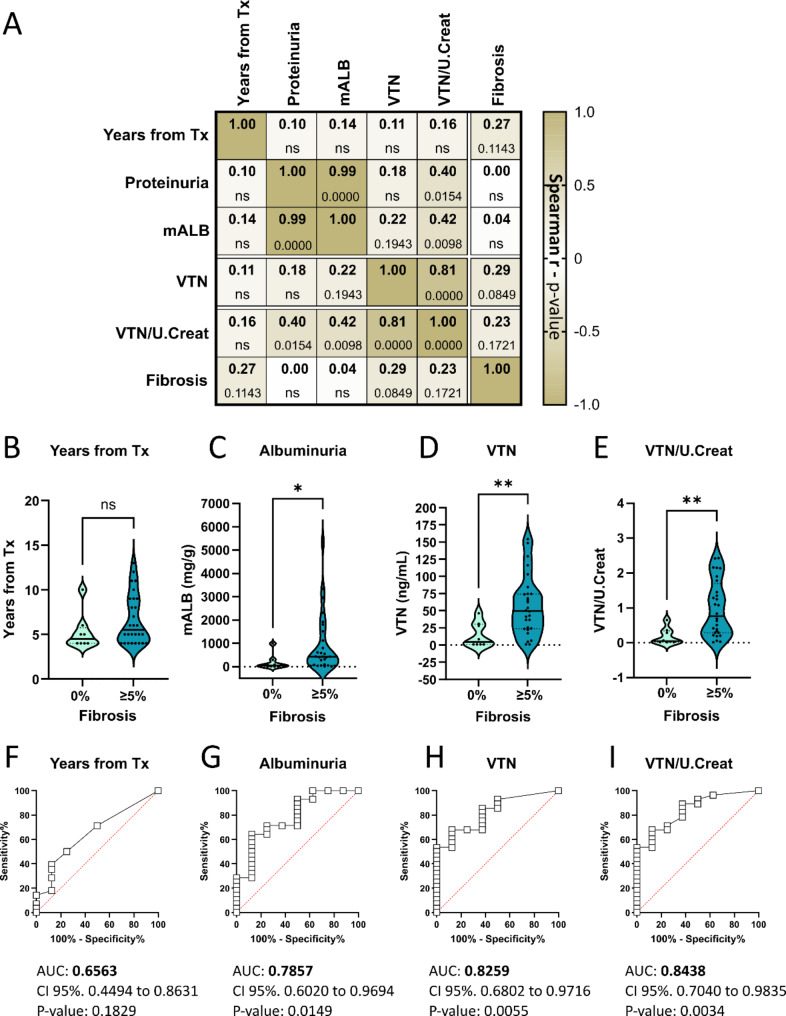
Methods: A total of 58 kidney transplant (KTx) patients who underwent renal biopsy were included in the study. Patients were categorized into two groups referred as no fibrosis (0%) or with fibrosis (≥ 5%) based on their histological findings. In a subsequent/follow-up analysis, the time elapsed from transplantation was also considered. The urinary levels of VTN were measured using ELISA.
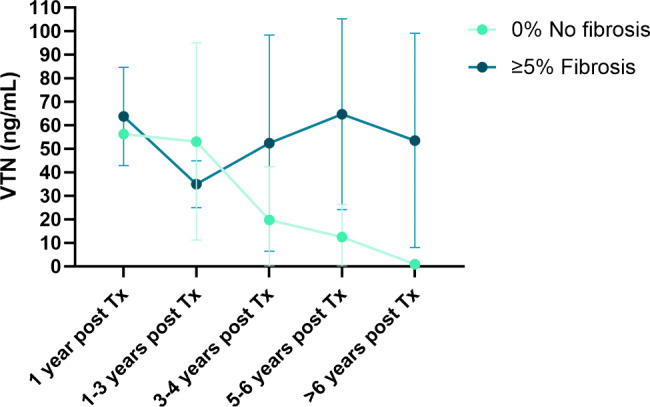
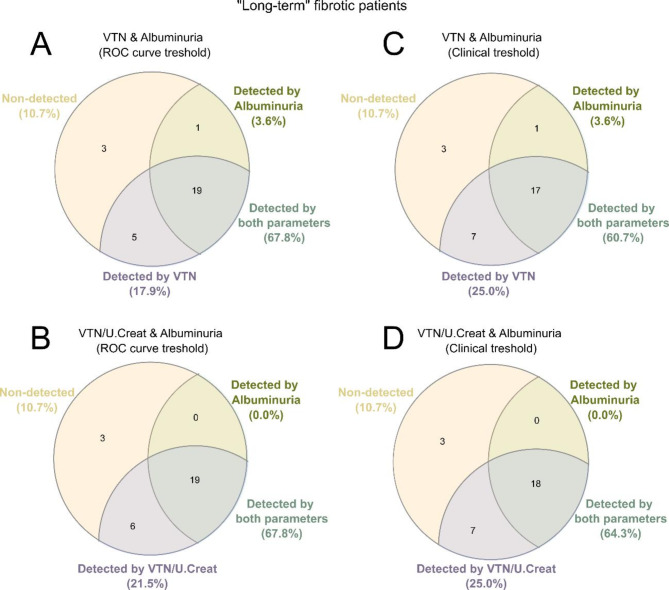
Results: VTN (p = 0.0180) and VTN normalized by urinary creatinine levels (p = 0.0037), were significantly increased in patients with fibrotic grafts. When focusing on patients with long-term grafts (> 3 years from transplantation, n = 36), VTN exhibited superior potential in identifying fibrotic grafts compared to albuminuria (VTN p = 0.0040 vs. albuminuria p = 0.0132). Importantly, in this group, while albuminuria correctly identified 71% of fibrotic patients, the combination of VTN plus albuminuria correctly classified 89% of fibrotic grafts detected by renal biopsy.
Conclusions: VTN has emerged as a valid indicator of renal fibrosis. Of interest, urinary levels of VTN in combination with conventional clinical parameters (such as albuminuria) significantly improved the non-invasive detection of renal fibrosis in kidney transplant patients.
Keywords: (3–10): Biomarker; ELISA; Extracellular matrix; Kidney fibrosis; Liquid biopsy; Nephrology; kidney transplant.
© 2024. The Author(s).
Conflict of interest statement
Figures
Similar articles
-
Urinary vitronectin identifies patients with high levels of fibrosis in kidney grafts.J Nephrol. 2021 Jun;34(3):861-874. doi: 10.1007/s40620-020-00886-y. Epub 2020 Dec 4. J Nephrol. 2021. PMID: 33275196 Free PMC article.
-
Proteomics of Urinary Extracellular Vesicles Highlight the Involvement of Vitronectin and the Fibrinolytic and TNF Pathways as Mechanisms Underlying Renal Fibrosis in Kidney Transplant Patients.J Extracell Biol. 2025 Jun 2;4(6):e70056. doi: 10.1002/jex2.70056. eCollection 2025 Jun. J Extracell Biol. 2025. PMID: 40458674 Free PMC article.
-
Macrophage promotes fibroblast activation and kidney fibrosis by assembling a vitronectin-enriched microenvironment.Theranostics. 2023 Jul 3;13(11):3897-3913. doi: 10.7150/thno.85250. eCollection 2023. Theranostics. 2023. PMID: 37441594 Free PMC article.
-
The non-invasive biopsy--will urinary proteomics make the renal tissue biopsy redundant?QJM. 2009 Aug;102(8):523-38. doi: 10.1093/qjmed/hcp071. Epub 2009 Jun 24. QJM. 2009. PMID: 19553250 Review.
-
Future of non-invasive graft evaluation: A systematic review of proteomics in kidney transplantation.World J Transplant. 2025 Mar 18;15(1):96025. doi: 10.5500/wjt.v15.i1.96025. World J Transplant. 2025. PMID: 40104186 Free PMC article. Review.
Cited by
-
Kidney and Bladder Transplantation: Advances, Barriers, and Emerging Solutions.Medicina (Kaunas). 2025 Jun 5;61(6):1045. doi: 10.3390/medicina61061045. Medicina (Kaunas). 2025. PMID: 40572733 Free PMC article. Review.
-
Fibrotic Disease: from Signaling Pathways and Biomarkers to Molecular Imaging.Mol Imaging Biol. 2025 Aug 11. doi: 10.1007/s11307-025-02038-9. Online ahead of print. Mol Imaging Biol. 2025. PMID: 40790290 Review.
References
MeSH terms
Substances
Grants and funding
LinkOut - more resources
Full Text Sources
Medical
Research Materials
Miscellaneous
