. 2024 Nov;14(11):e70057.
doi: 10.1002/ctm2.70057.

Persistence of activated anti-mesothelin hYP218 chimeric antigen receptor T cells in the tumour is associated with efficacy in gastric and colorectal carcinomas

Affiliations

Persistence of activated anti-mesothelin hYP218 chimeric antigen receptor T cells in the tumour is associated with efficacy in gastric and colorectal carcinomas

Sameer Mir et al. Clin Transl Med. 2024 Nov.

Abstract

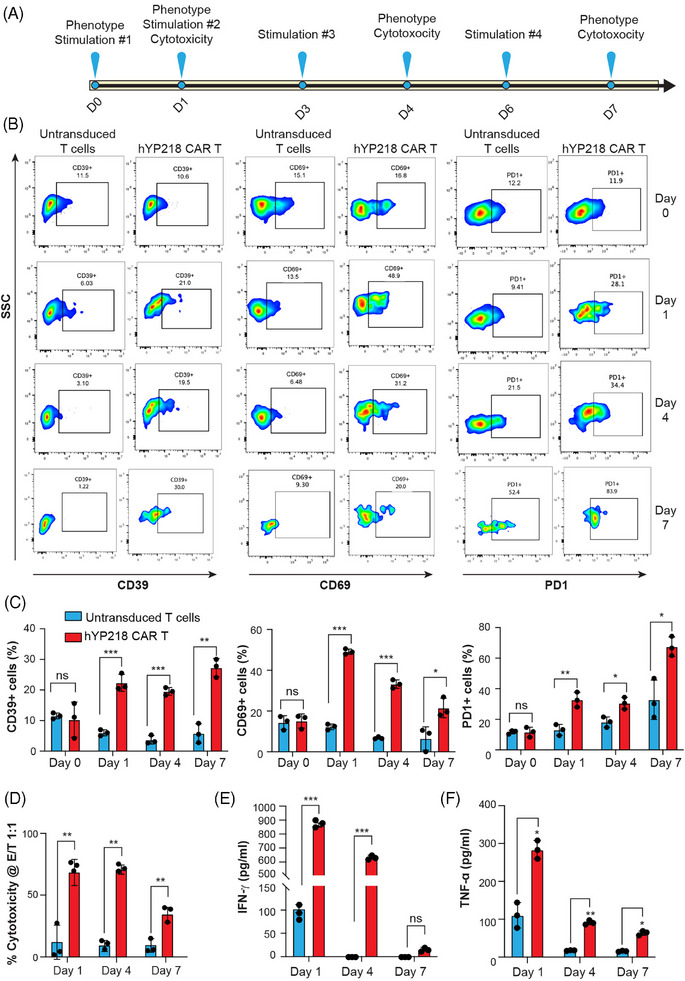
Patients with advanced gastric and colorectal cancers have limited treatment options. Since mesothelin is highly expressed in these tumour types, we evaluated the therapeutic benefits of anti-mesothelin hYP218 CAR T cells alone, and in combination with anti-PD1 antibody, pembrolizumab. GEPIA analysis was performed using human gastric (n = 408) and colon cancer tumours (n = 275) in TCGA database, to evaluate mRNA expression of mesothelin, compared to normal tissues. Mesothelin expression in gastric and colorectal cancer cell-lines (n = 5) was analysed using flow cytometry. In vitro efficacy by hYP218 CAR T cells was tested by cytotoxicity and cytokine release assays. In vivo anti-tumour efficacy of hYP218 CAR T cells alone, and in combination with pembrolizumab, was evaluated in NSG mice bearing human gastric (HGC27) and colorectal (SW48) tumour xenografts. Additionally, hYP218 CAR-T cell persistence, activation and exhaustion marker-expression were studied. Mesothelin expression was significantly higher in gastric and colon cancer biopsies compared to normal tissues (p < .005). Mesothelin expression in gastric and colon cancer cell lines ranged from 10 000 to 70 000 molecules per cell. hYP218 CAR T cells demonstrated strong cytotoxic activity at low effector to target ratio, ranging from 0.24 to 1.0. In NSG mouse-models, hYP218 CAR T cells demonstrated anti-tumour efficacy and persisted in the tumour microenvironment in a functional state at day 40 posttreatment with expression of activation markers CD39 and CD69, increased production of IFN-γ and TNF-α and ability to kill tumour cells in vitro when isolated from tumours. There was increased PD1 expression. In combination with pembrolizumab, hYP218 CAR T cells led to slower tumour growth in NSG mice bearing large but not small HGC27 tumours. Anti-tumour efficacy of hYP218 CAR T cells is due to increased accumulation of activated CAR T cells in the tumour and combination with pembrolizumab resulted in improvement in anti-tumour activity of large established tumours. HIGHLIGHTS: Mesothelin expression is significantly higher in gastric and colorectal cancers than normal tissues. hYP218 CAR T cells demonstrate strong anti-tumour activity against mesothelin-positive gastric and colorectal carcinomas. Activated hYP218 CAR T cells persist in the tumour microenvironment and retain their cytotoxic activity. Addition of pembrolizumab in larger tumours enhance CAR T cell efficacy.

Keywords: CAR T cell; anti‐PD1; colorectal cancer; gastric cancer; mesothelin; pembrolizumab; xenograft cancer model.


Conflict of interest statement

RH has received funding from the Intramural Research Program of the NIH, National Cancer Institute, Center for Cancer Research (ZIA‐BC‐010816) and has received funding for conduct of clinical trials via a cooperative research and development agreement between NCI and Bayer AG and TCR2 Therapeutics. Other authors have no competing interests to disclose.

Figures

FIGURE 1
FIGURE 1
Mesothelin (MSLN) expression in human tumours and cell lines. (A) MSLN RNA expression in gastric and colon tumours (T) as compared to matched healthy tissue (N) in TCGA pan‐cancer data. For gastric cancer 408 tumours and 36 matched healthy tissues were analysed. For colon carcinoma 275 tumours and 41 matched healthy tissues were analysed. The Log2FC cutoff was set at 1, and the p‐value cutoff was set at 0.01. (B) Kaplan–Meyer plot showing overall survival in patients with high and low levels of tumour mesothelin expression in gastric (left) and colon carcinomas (right). The 95% confidence interval (CI) is represented as a dotted line. The group cutoff is selected based on quartiles, with top 25% and minimum 25% MSLN expression. (C) Histograms displaying MSLN cell surface expression by flow cytometry in various gastric (AGS, N87 and HCG27) and colorectal cancer cell lines (SW48, HTB39). Ovarian cancer cell line OVCAR8 and non‐small cell lung cancer cell line H1703 were used as positive and negative controls respectively for MSLN expression. (D) The quantification of MSLN molecules per cell was determined by flow cytometry using anti‐human mesothelin antibody conjugated with PE quantibrite beads. Gating strategy: FSC/SSC‐Singlets‐Live‐MSLN+. Data are plotted as mean ± SD (n = 3; *p ≤ .05).
FIGURE 2
FIGURE 2
Cytotoxicity of hYP218 CAR T cells against gastric and colorectal cancer cell lines. (A) Cytotoxicity of hYP218 CAR T or untransduced T cells upon co‐culture at different E:T ratios against mesothelin expressing gastric (N87, HGC27 and AGS) and colorectal tumour cell lines (SW48 and HTB39). OVCAR‐8 and H1703 cells were used as positive and negative control, respectively for mesothelin expression. ET50 values for each cell line shown in the table. (B) Release of IFN‐γ and (C) TNF‐α after co‐culture of hYP218 CAR T or untransduced T cells with tumour cells at E:T ratio of 1.5:1 and 3:1. Data represent ± SD (n = 3). Significance levels: ns = non‐significant; *p ≤ .05; **p ≤ .01; ***p ≤ .001.
FIGURE 3
FIGURE 3
Phenotypic changes and cytotoxicity of hYP218 CAR T cells after in vitro antigen restimulation. (A) Schematic diagram of tumour cells and T cells co‐culture assay. (B, C) Activation (CD39 and CD69) and exhaustion (PD1) markers expressed by hYP218 CAR T cell products as determined by flowcytometry. The status of activation and exhaustion markers were assessed on day 0 and following antigen restimulation using HGC27 target cells on days 1, 4, and 7. (D) The percentage of HGC27 MSLN+ target cells killed by hYP218 CAR T cells was assessed after a single exposure on day 1, at a mid‐time point on day 4, and following four cycles of antigen exposure on day 7. (E, F) ELISA quantification of (E) IFN‐γ and (F) TNF‐α release by hYP218 CAR T cells was performed upon coculture with target cells on days 1, 4, and 7. Gating strategy: FSC/SSC > Singlets > Live > CD3+ > EGFR+ > CD39/CD69+/PD1+. Data are plotted as mean ± SD (n = 3). Significance levels: ns = non‐significant; *p ≤ .05; **p ≤ .01; ***p ≤ .001.
FIGURE 4
FIGURE 4
In vivo anti‐tumour efficacy of hYP218 CAR T cells using mesothelin expressing gastric and colorectal tumour models. (A) Kinetics of HGC27 gastric tumour growth in saline, Untransduced T cells and hYP218 CAR T cell treated mice. NSG mice were injected with 1 × 106 cells. After 14 days, they were treated either with 1 × 106 of hYP218 CAR T cells, or mock T cells or saline (n = 5 per treatment group). Tumour growth was monitored, and tumour volume was measured twice a week. (B) K–M survival curve shows survival benefit of the hYP218 CAR T treated mice (p ≤ .05 hYP218 CAR T cell versus Untransduced T cells, median survival > 40 days). (C) Kinetics of SW48 colorectal cancer tumour growth in NSG mice. Mice were injected with 1 × 106 cells SW48 tumour cells and 12 days later were treated with 1 × 106 of hYP218 CAR T cells, or mock T cells or saline (n = 5 per treatment group). (D) K–M survival curve shows survival benefit of the hYP218 CAR T treated mice (p ≤ .001 hYP218 CAR T cell versus Untransduced T cells, median survival > 40 days). Data represent mean ± SEM. Significance levels: ns = non‐significant; *p ≤ .05; **p ≤ .01; ***p ≤ .001.
FIGURE 5
FIGURE 5
Long‐term persistence of activated hYP218 CAR T cells in tumour and spleen of treated mice. (A) Flow cytometry analysis showing the basal expression levels of activation markers CD39 and CD69 in CAR T cell products on day 9 posttransduction. (B–G) Flow cytometry analysis showing the presence of CD3+ EGFR+ cells along with their activation phenotypes in the tumour and spleen collected on day 40 after CAR T cell infusion in mice bearing (B–D) HGC27 and (E–G) SW48 tumours. Gating strategy:FSC/SSC > Singlets > Live > CD3+ > EGFR+ > CD39/CD69+. Data are plotted as mean ± SD, ns = non‐significant; *p ≤ .05; **p ≤ .01; ****p ≤ .0001.
FIGURE 6
FIGURE 6
Functional status of the tumour infiltrating hYP218 CAR T cells. (A–D) TNF‐α and Interferon‐γ levels in the serum of hYP218 CAR T treated mice bearing HGC27 and SW48 tumours, collected on day 40 post treatment. A significantly higher concentration of both cytokines was observed in the HGC27 compared to the SW48 tumour models. Data are plotted as mean ± SEM (n = 3; p ≤ .0001 hYP218 CAR T versus Untransduced T cell in HGC27 cancer model; p ≥ .05 hYP218 CAR T versus Untransduced T cell in SW48 cancer model). (E, F) Effector cytokines released by hYP218 CAR T cells upon stimulation with Leukocyte Activation Cocktail for 4 h. (G) Cytotoxicity caused by the isolated tumour‐infiltrated hYP218 CAR T cells and untransduced T cells over a 24‐h time period at a 1:1 effector‐to‐target ratio. Gating strategy: FSC/SSC > Singlets > Live > CD3+ > EGFR+ > IFN+/TNF+/IL2+. Data are represented as mean ± SD, ns = non‐significant; ****p ≤ .0001.
FIGURE 7
FIGURE 7
Expression of exhaustion markers on hYP218 CAR T cell product and CAR T cells isolated from tumour and spleen of treated mice. (A) Representative flow cytometry data showing basal expression of PD1 and TGFBR2 in hYP218 CAR T cell products. Low expression of PD1 was seen across the samples, while TGFBR2 expression was undetectable. (B) Representative flow cytometry dot plots depicting the elevated expression of PD1 in CAR T cells isolated from tumour and spleen tissues of HGC27 and SW48 tumour bearing mice on day 40 post hYP218 CAR T treatment when compared with the baseline expression seen in the cell product (n = 3). (C) Flow Cytometry analysis showing increased TGFBR2 expression on CAR T cells isolated from the tumour and spleen tissues of mice bearing HGC27 and SW48 tumours that were treated with hYP218 CAR T cells (n = 3). (D, E) Cumulative bar plots showing the percentage of PD1 and TGFBR2‐positive cells in cell products, spleen, and tumour of HGC27 and SW48 CDX models, respectively. Gating strategy: FSC/SSC > Singlets > Live > CD3+ > EGFR+ > PD1/TGFBR2+. Data are plotted as mean ± SD, *p ≤ .05; **p ≤ .01; ***p ≤ .001.
FIGURE 8
FIGURE 8
The combination of hYP218 CAR T cells with the anti‐PD1 antibody pembrolizumab enhances tumour control. (A) The experimental design of the in vivo experiment involving hYP218 and the anti‐PD1 antibody was as follows: 1 × 106 HGC27 cancer cells were injected per mouse, and treatment began when the tumour volume reached 150 mm3. The treatment consisted of a single dose of 5 × 106 hYP218 CAR T cells followed by four doses of the anti‐PD1 antibody (pembrolizumab). (B) Kinetics of HGC27 gastric tumour growth in saline, mock, pembrolizumab and hYP218 CAR T cell treated mice. NSG mice were injected with 1 × 10⁶ cells and allowed to grow until more robust, larger tumours of approximately 150 mm3 had formed. Mice were treated either with 5 × 106 of hYP218 CAR T cells, pembrolizumab (150µg) or mock T cells or saline (p ≤ .001 combination group versus hYP218 CAR T cell, n = 5 per treatment group). Tumour growth was monitored, and tumour volume was measured twice a week. (C) Survival curve shows survival benefit of the combined hYP218 CAR T and pembrolizumab treated mice (p ≤ .05 pembrolizumab group versus hYP218 CAR T cell, p ≤ .001 pembrolizumab group versus combination group, n = 5 per treatment group). (D) Kinetics of HGC27 gastric tumour growth in saline, Untransduced T cells, pembrolizumab, hYP218 CAR T, and the combination group. NSG mice (n = 5 per treatment group) were injected with 1×10⁶ cells, and treatment was initiated when the tumour volume was small, approximately 80 mm3. Tumour growth was monitored, and tumour volume was measured twice a week. (E) Kaplan–Meier survival curve. (F–H) Flowcytometry data showing the expression of CD69, CD39 and PD1‐TIM3 expression on hYP218 CAR T cells in the pembrolizumab‐treated group compared to the group that did not receive pembrolizumab. Data are represented as mean ± SD, ns = non‐significant; *p ≤ .05; **p ≤ .01; ***p ≤ .001.

References

    1. Smyth EC, Nilsson M, Grabsch HI, et al. Gastric cancer. Lancet. 2020;396(10251):635‐648. doi:10.1016/s0140-6736(20)31288-5. [published Online First: 2020/08/31]. - DOI - PubMed
    1. Hossain MS, Karuniawati H, Jairoun AA, et al. Colorectal cancer: a review of carcinogenesis, global epidemiology, current challenges, risk factors, preventive and treatment strategies. Cancers (Basel). 2022;14(7). doi:10.3390/cancers14071732. [published Online First: 2022/04/13]. - DOI - PMC - PubMed
    1. Dekker E, Tanis PJ, Vleugels JLA, et al. Colorectal cancer. The Lancet. 2019;394(10207):1467‐1480. doi:10.1016/S0140-6736(19)32319-0 - DOI - PubMed
    1. Li K, Zhang A, Li X, et al. Advances in clinical immunotherapy for gastric cancer. Biochim Biophys Acta Rev Cancer. 2021;1876(2):188615. doi:10.1016/j.bbcan.2021.188615 - DOI - PubMed
    1. Joshi SS, Badgwell BD. Current treatment and recent progress in gastric cancer. CA Cancer J Clin. 2021;71(3):264‐279. doi:10.3322/caac.21657 - DOI - PMC - PubMed

MeSH terms

LinkOut - more resources