. 2025 Jan;100(1):10-22.
doi: 10.1002/ajh.27513. Epub 2024 Nov 16.

High-grade B-cell lymphoma not otherwise specified, with diffuse large B-cell lymphoma gene expression signatures: Genomic analysis and potential therapeutics

Affiliations

High-grade B-cell lymphoma not otherwise specified, with diffuse large B-cell lymphoma gene expression signatures: Genomic analysis and potential therapeutics

Waseem Lone et al. Am J Hematol. 2025 Jan.

Abstract

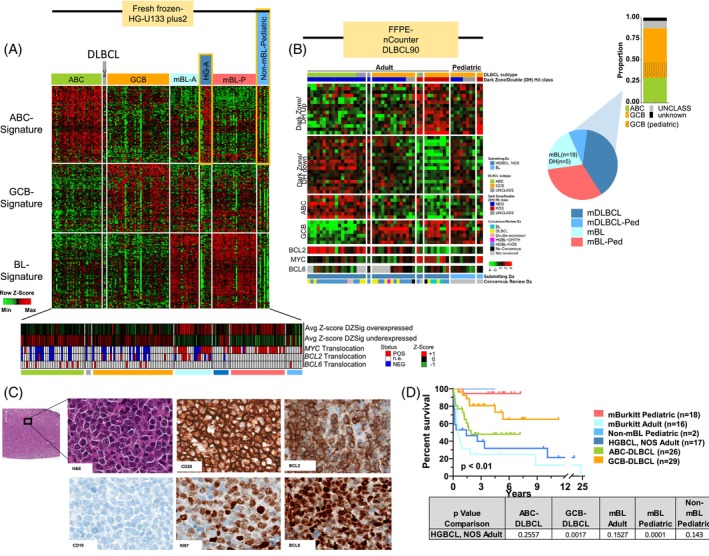
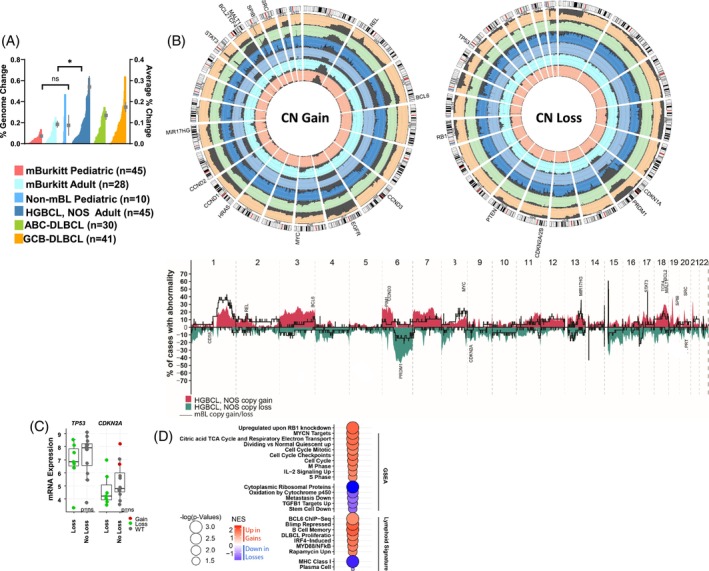
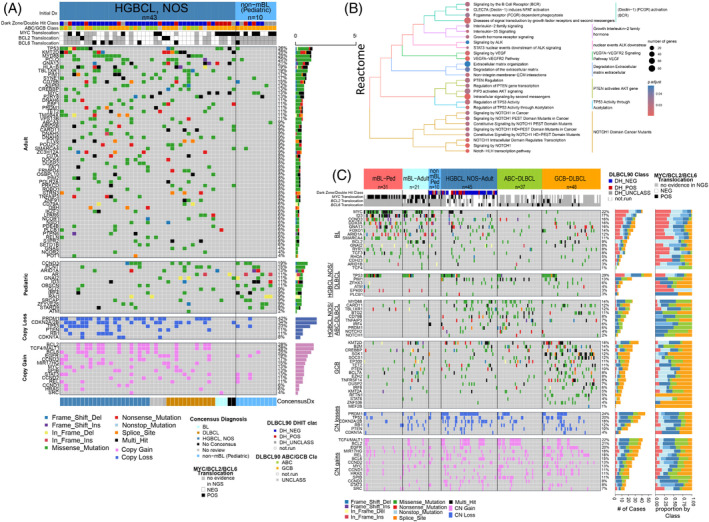
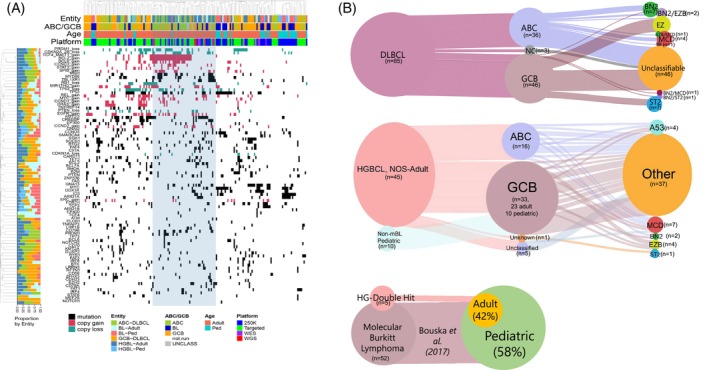
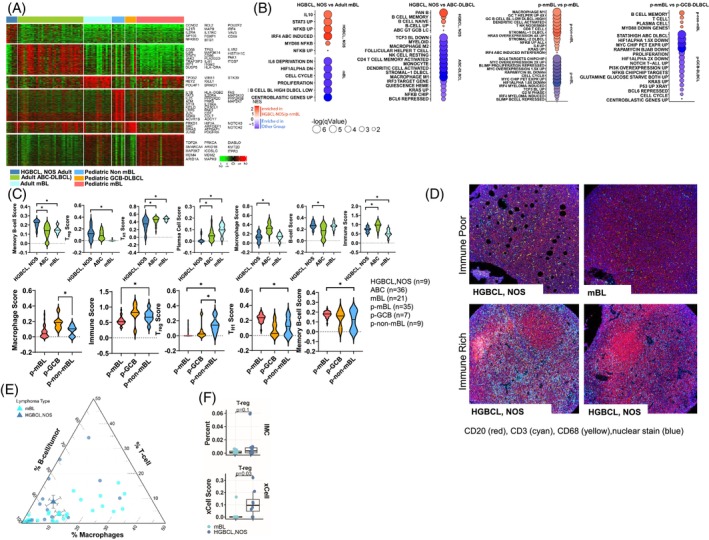
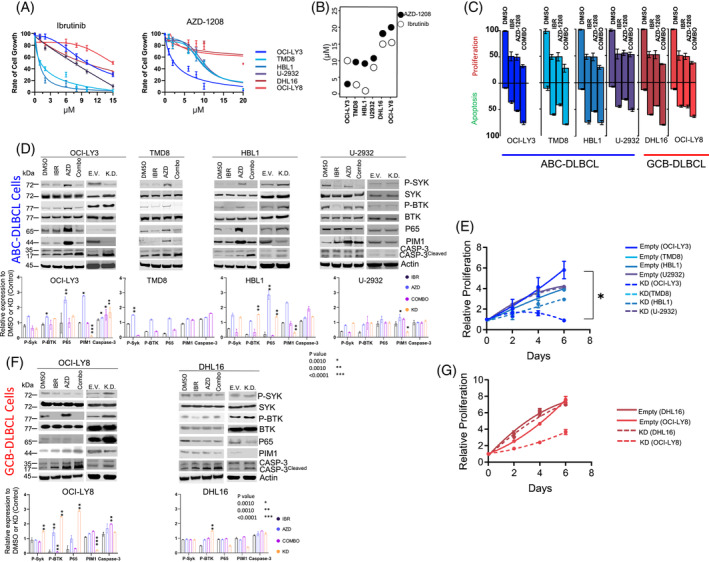
High-grade B-cell lymphoma not otherwise specified (HGBCL, NOS) has overlapping morphological and genetic features with diffuse large B-cell lymphoma (DLBCL) and Burkitt lymphoma (BL), leading to uncertainty in its diagnosis and clinical management. Using functional genomic approaches, we previously characterized HGBCL and NOS, that demonstrate gene expression profiling (GEP), and genetic signatures similar to BL. Herein, we characterize distinct HGBCL, NOS, cohort (n = 55) in adults (n = 45) and in children (n = 10), and compared the GEP, genomic DNA copy number (CN), and mutational spectrum with de novo DLBCL (n = 85) and BL (n = 52). This subgroup, representing ~60% of HGBCL, NOS, lack gene-expression signature of BL and double hit/dark zone lymphoma, but express DLBCL like signatures and are characterized by either GCB- or ABC-like mRNA signatures and exhibit higher genomic complexity, similar to de novo DLBCL, and show alteration in genes regulating B-cell activation (CD79B, MYD88, PRDM1, TBLIXR1, CARD11), epigenome (KMT2D, TET2) and cell cycle transition (TP53, ASPM). However, recurrent mutations in genes often mutated in BL (DDX3X, GNA13, CCND3), but rare in DLBCL, are also present in HGBCL-NOS, highlighting genetic heterogeneity. Consistent with mutation spectrum, frequent genomic CN alterations in genes regulating B-cell activation (del-PRDM1, gain-BCL6, -REL, -STAT3) and cell cycle regulators (del-TP53, del-CDKN2A, del-RB1, gain-CCND3) were observed. Pediatric cases showed GCB-DLBCL-like mRNA signatures, but also featured hallmark mutations of pediatric BL. Frequent oncogenic PIM1 mutations were present in adult HGBCL, NOS. In vitro analyses with pharmacologic or genetic inhibition of PIM1 expression triggered B-cell activation and NF-κB-induced apoptosis, suggesting that PIM1 is a rational therapeutic target.


Conflict of interest statement

The authors declare no competing financial interests.

Figures

FIGURE 1
FIGURE 1
Classification and clinical data for high‐grade B‐cell lymphoma (HGBCL), not otherwise specified (NOS), cases. (A) Heatmap of diffuse large B‐cell lymphoma (DLBCL) and Burkitt lymphoma (BL) Affymetrix classification signatures as described in Dave, et al., Lenz, et al., and Bouska, et al. The Dark Zone/DHL‐Signature status (represented by average Z‐score of genes described in Ennishi, et al. 13 ) and MYC/BCL2/BCL6 translocation status are displayed below. (B) Heatmap of adult HGBCL, NOS, cases and non‐mBL pediatric cases profiled on the DLBCL90 nCounter panel. An additional cohort of HGBCL, NOS, and pediatric non‐molecular BL (initially diagnosed as BL but lacking the BL GEP signature) were profiled using the nCounter DLBCL90 classifier to determine DLBCL subtypes (ABC‐DLBCL or GCB‐DLBCL) and to identify DZ‐lymphomas. (C) Hematoxylin and eosin (H&E) staining and immunohistochemistry of CD20, BCL2, CD10, Ki67, and BCL6 in a representative HGBCL, NOS, case. This case, HGBCL‐30, is also shown in Figure S1. All images are at 20× magnification. (D) Kaplan–Meier curve comparing overall survival of molecular BL, non‐molecular Burkitt lymphoma (non‐mBL) pediatric cases with DLBCL signatures, HGBCL, NOS, with DLBCL signatures, and de novo DLBCL cases. The p values (log‐rank) for the different groups compared with HGBCL, NOS, are noted in the table below. [Color figure can be viewed at wileyonlinelibrary.com]
FIGURE 2
FIGURE 2
Genomic analysis of HGBCL, NOS, cases with DLBCL signatures. (A) Histogram of % genome‐change per case (left axis) in molecular BL, HGBCL, NOS, with DLBCL signatures, and de novo DLBCL cases. The mean and standard error of the mean are shown as in‐laid points and correspond to the right‐axis scale. (B) The upper panel shows circos plots comparing the frequency of gains and losses found in the noted lymphoma types. The scale lines represent 20% increments. The lower panel depicts the frequency plot of gains and losses in adult HGBCL, NOS, and adult mBL. (C) Analysis of mRNA expression and CNA status in adult HGBCL, NOS shows that frequent deletions in TP53 and CDKN2A correlate with decreased mRNA expression levels. (D) Bubble graph of pathways enriched for genes demonstrating both upregulation and CN gain or downregulation and CN loss (compared with WT) in HGBCL, NOS, adult cases. [Color figure can be viewed at wileyonlinelibrary.com]
FIGURE 3
FIGURE 3
Mutational profiling of HGBCL, NOS, cases with DLBCL signatures. (A) Mutation status of hallmark genes identified by WES in 43 adult HGBCL, NOS, and 10 pediatric non‐molecular BL cases with DLBCL GEP signatures. The panels represent genes common in the adult cases or pediatric cases or genes affected by DNA CN loss or gain. (B) Bubble graph of pathways enriched for mutations in DHL‐signature negative HGBCL, NOS, adult cases. (C) Mutation status of hallmark genes within the noted lymphoma types. MYC/BCL2/BCL6 translocation status and gene expression classification are displayed above according to in‐figure key. Right axis corresponds to mutation count and proportion within subtypes. The panels show genes common in (1) BL, (2) HGBCL, NOS, and DLBCL, (3) HGBCL, NOS and ABC‐DLBCL, and (4) GCB‐DLBCL. The lower 2 panels show DNA CN losses and DNA CN gains. [Color figure can be viewed at wileyonlinelibrary.com]
FIGURE 4
FIGURE 4
Genetic classifications for HGBCL, NOS, cases with DLBCL signatures. (A) Hierarchical clustering of frequent mutation and CNAs in the noted lymphoma subtypes. (B) Sankey plot of genetic classifications for HGBCL, NOS, cases with DLBCL signatures based on the Lymphgen1.0 classifier. Nodes represent classifications with the migration of cases represented by connecting lines. Line width is proportional to the number of cases. [Color figure can be viewed at wileyonlinelibrary.com]
FIGURE 5
FIGURE 5
Gene expression analysis of HGBCL, NOS, adult cases. (A) Heatmap of differentially expressed genes between the denoted lymphoma groups. (B) Bubble graph of significantly enriched GSEA pathways in adult HGBCL, NOS as compared with BL and ABC‐DLBCL (left) and pediatric non‐mBL as compared with pediatric BL and pediatric GCB‐DLBCL (right). Bubble size and color correspond to in‐figure‐key. (C) Immune cell enrichment analysis (xCell) for adult HGBCL, NOS, ABC‐DLBCL, and BL (upper panel). Immune cell enrichment analysis (xCell) for pediatric non‐mBL, pediatric GCB‐DLBCL, and pediatric BL (lower panel). Asterisks (p < 0.05) denote significant differences between groups. (D) Representative imaging mass cytometry (IMC) images of immune rich and immune poor cases. (E) Ternary plot displaying the percent of B‐cells, T‐cells, and macrophages in HGBCL, NOS, and mBL cases analyzed by IMC. The circles represent individual samples, and the triangles the average values for the groups. (F) Boxplots comparing the percent of regulatory T‐cells (Treg cells) from IMC data in mBL versus HGBCL, NOS, with the Treg score (lower insert) estimated from gene expression data using xCell in the same cases. [Color figure can be viewed at wileyonlinelibrary.com]
FIGURE 6
FIGURE 6
In vitro investigation of PIM1 inhibition in genetically classified DLBCL cell lines. (A) Representative IC50 curves for ibrutinib (IBR; BCR inhibitor) and AZD‐1208 (AZD; pan PIM‐inhibitor) in the listed cell lines at 48 h. (B) IC50 values for IBR and AZD in the noted cell lines. (C) Cell proliferation/growth or apoptosis relative to vehicle control (DMSO) for single‐ (AZD or IBR) or double‐agent (Combo) treatments for the listed cell lines. Agents were treated at their respective IC50 values for 48 h. Error bars represent SEM from three independent experiments. (D) Representative western blots for the indicated targets following drug treatments of the noted ABC‐DLBCL cell lines at the respective IC50 values (48 h) or after knockdown of PIM1, the bottom panel represents the protein quantification from three independent biological experiments. Vehicle DMSO (D), ibrutinib (I), AZD‐1208 (A) and combination treatment (C), empty vector (EV), knockdown (KD). Phosphorylation of SYK was probed at Tyr525/526 (P‐SYK) and BTK at Tyr223 (P‐BTK). CASP‐3; caspase (E) Proliferation (normalized to day 1) for the listed ABC‐DLBCL cells lines. Error bars represent SEM from three independent experiments. Asterisks (p < 0.05) denote significant differences between groups. (F) Representative western blots for the indicated targets following drug treatments of the noted GCB‐DLBCL cell lines at the respective IC50 values (48 h) or after knockdown of PIM1. The bottom panel represents the protein quantification from three independent biological experiments. (G) Proliferation (normalized to Day 1) for the listed GCB‐DLBCL cells lines. Error bars represent SEM from three independent experiments. Asterisks (p < 0.05) denote significant differences between groups. [Color figure can be viewed at wileyonlinelibrary.com]

References

    1. Ok CY, Medeiros LJ. High‐grade B‐cell lymphoma: a term re‐purposed in the revised WHO classification. Pathology. 2020;52(1):68‐77. doi:10.1016/j.pathol.2019.09.008 - DOI - PubMed
    1. Zayac AS, Landsburg DJ, Hughes ME, et al. High‐grade B‐cell lymphoma, not otherwise specified: a multi‐institutional retrospective study. Blood Adv. 2023;7(21):6381‐6394. doi:10.1182/bloodadvances.2023009731 - DOI - PMC - PubMed
    1. Swerdlow SH, Campo E, Pileri SA, et al. The 2016 revision of the World Health Organization classification of lymphoid neoplasms. Blood. 2016;127(20):2375‐2390. doi:10.1182/blood-2016-01-643569 - DOI - PMC - PubMed
    1. Alaggio R, Amador C, Anagnostopoulos I, et al. Correction: "the 5th edition of the World Health Organization classification of Haematolymphoid Tumours: lymphoid neoplasms" leukemia. 2022 Jul;36(7):1720‐1748. Leukemia. 2023;37(9):1944‐1951. doi:10.1038/s41375-023-01962-5 - DOI - PMC - PubMed
    1. Alaggio R, Amador C, Anagnostopoulos I, et al. The 5th edition of the World Health Organization classification of Haematolymphoid Tumours: lymphoid neoplasms. Leukemia. 2022;36(7):1720‐1748. doi:10.1038/s41375-022-01620-2 - DOI - PMC - PubMed

MeSH terms