

Model-informed drug development for antimicrobials: translational pharmacokinetic-pharmacodynamic modelling of apramycin to facilitate prediction of efficacious dose in complicated urinary tract infections
- PMID: 39548844
- PMCID: PMC11695905
- DOI: 10.1093/jac/dkae409
Model-informed drug development for antimicrobials: translational pharmacokinetic-pharmacodynamic modelling of apramycin to facilitate prediction of efficacious dose in complicated urinary tract infections
Abstract
Objectives: The use of mouse models of complicated urinary tract infection (cUTI) has usually been limited to a single timepoint assessment of bacterial burden. Based on longitudinal in vitro and in vivo data, we developed a pharmacokinetic-pharmacodynamic (PKPD) model to assess the efficacy of apramycin, a broad-spectrum aminoglycoside antibiotic, in mouse models of cUTI.
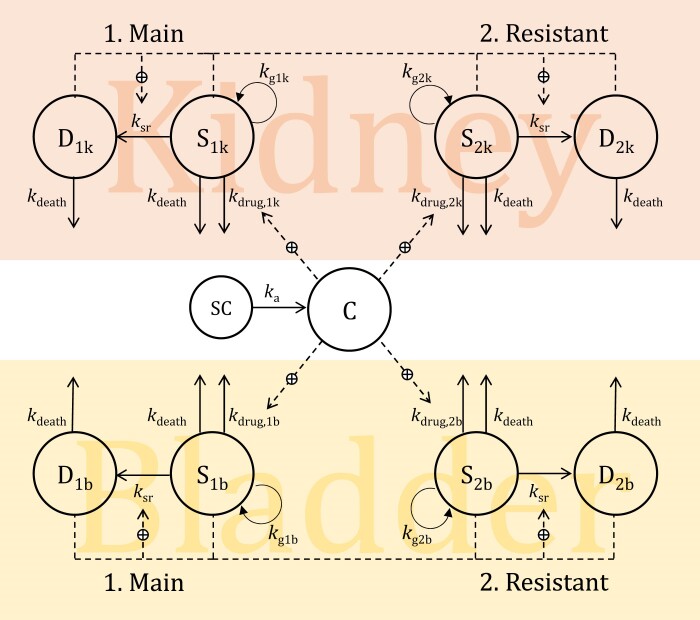
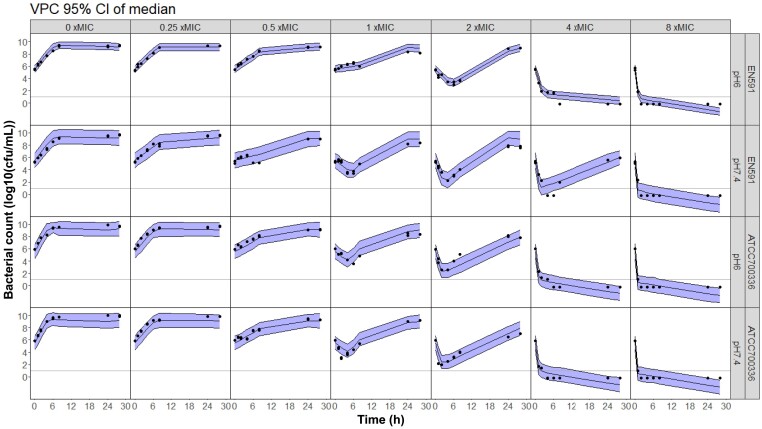
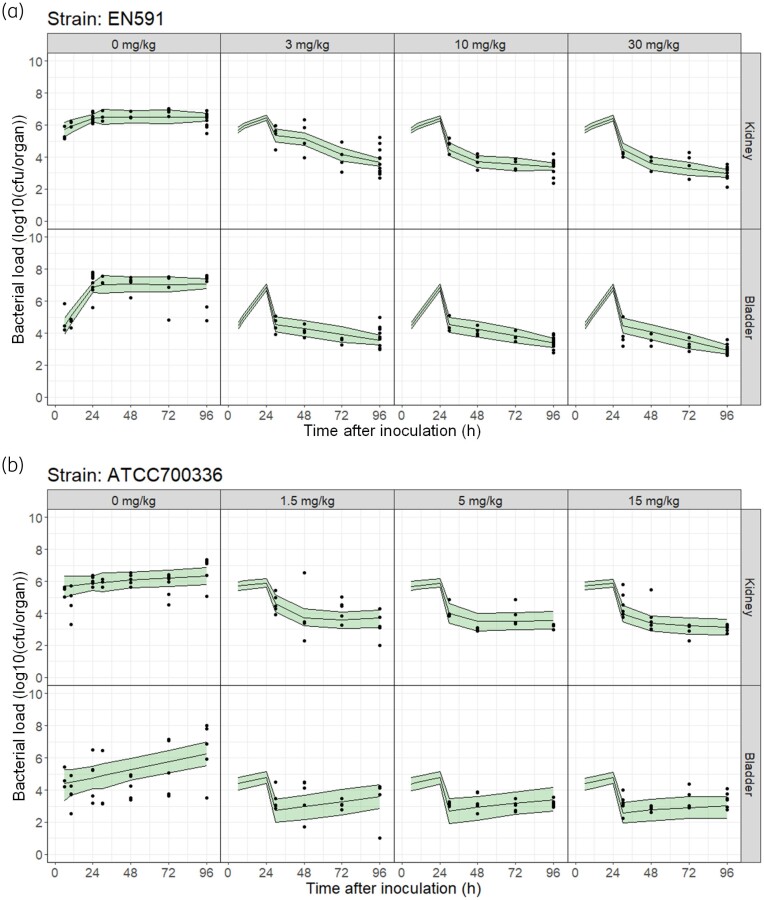
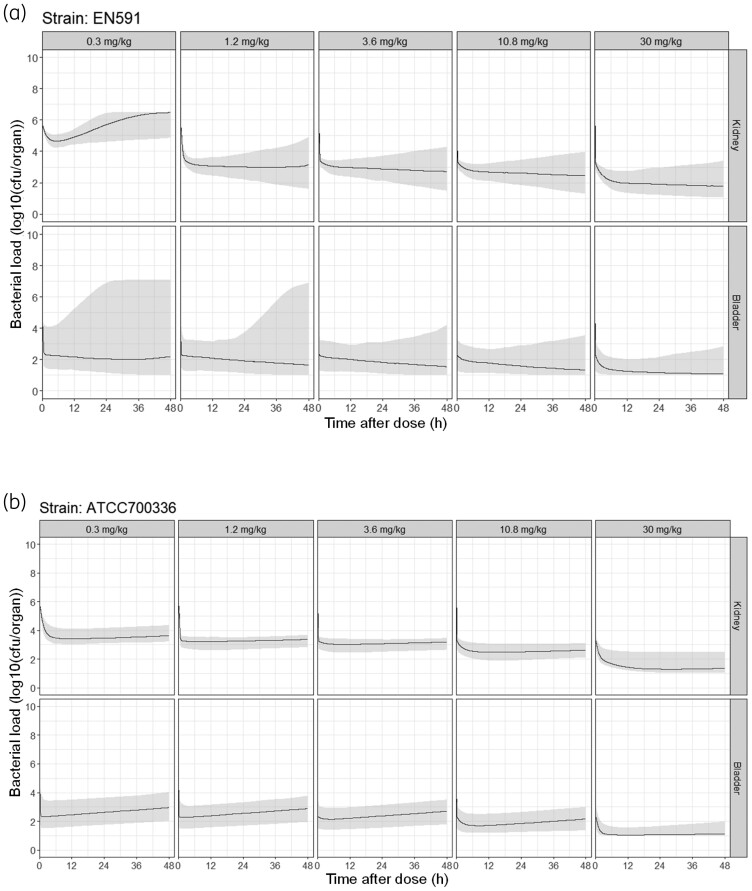
Methods: Two Escherichia coli strains were studied (EN591 and ATCC 700336). Apramycin exposure-effect relationships were established with in vitro time-kill data at pH 6 and pH 7.4 and in mice with cUTI. Immunocompetent mice were treated with apramycin (1.5-30 mg/kg) starting 24 h post-infection. Kidney and bladder tissue were collected 6-96 h post-infection for cfu determination. A PKPD model integrating all data was developed and simulations were performed to predict bacterial burden in humans.
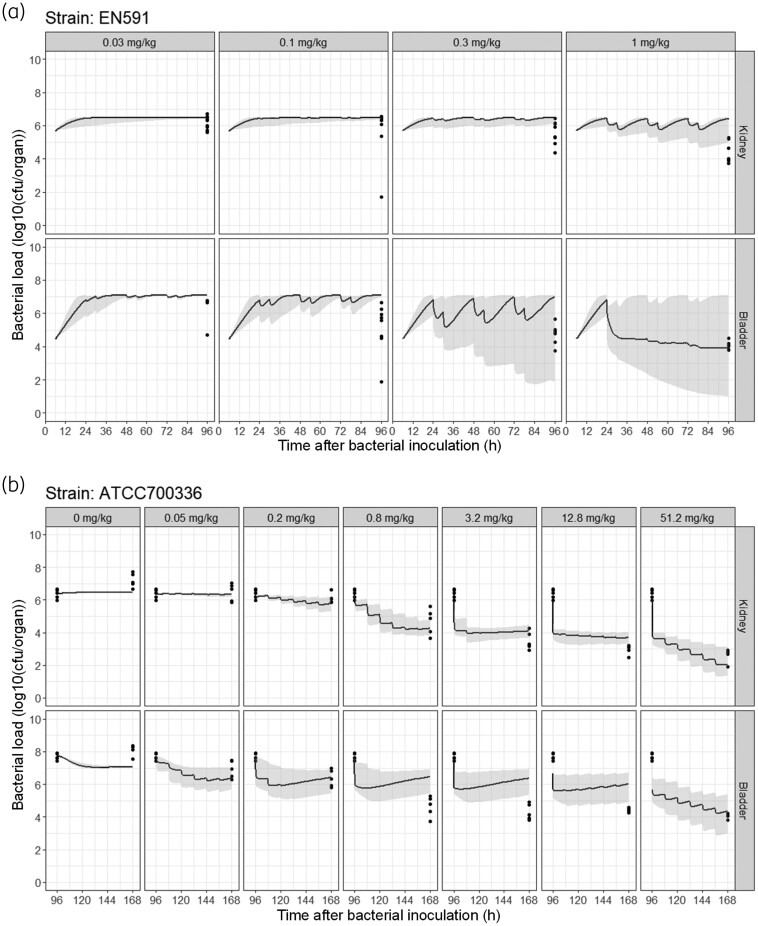
Results: Treatment with apramycin reduced the bacterial load in kidneys and bladder tissue up to 4.3-log compared with vehicle control. In vitro and in vivo tissue time-course efficacy data were integrated into the PKPD model, showing 76%-98% reduction of bacterial net growth and 3- to 145-fold increase in apramycin potency in vivo compared with in vitro. Simulations suggested that an 11 mg/kg daily dose would be sufficient to achieve bacterial stasis in kidneys and bladder in humans.
Conclusions: PKPD modelling with in vitro and in vivo PK and PD data enabled simultaneous evaluation of the different components that influence drug effect, an approach that had not yet been evaluated for antibiotics in the cUTI model and that has potential to enhance model-informed drug development of antibiotics.
© The Author(s) 2024. Published by Oxford University Press on behalf of British Society for Antimicrobial Chemotherapy.
Figures
Similar articles
-
Model-Informed Drug Development for Antimicrobials: Translational PK and PK/PD Modeling to Predict an Efficacious Human Dose for Apramycin.Clin Pharmacol Ther. 2021 Apr;109(4):1063-1073. doi: 10.1002/cpt.2104. Epub 2020 Nov 28. Clin Pharmacol Ther. 2021. PMID: 33150591 Free PMC article.
-
Antibacterial activity of apramycin at acidic pH warrants wide therapeutic window in the treatment of complicated urinary tract infections and acute pyelonephritis.EBioMedicine. 2021 Nov;73:103652. doi: 10.1016/j.ebiom.2021.103652. Epub 2021 Nov 2. EBioMedicine. 2021. PMID: 34740109 Free PMC article.
-
Translational in vitro and in vivo PKPD modelling for apramycin against Gram-negative lung pathogens to facilitate prediction of human efficacious dose in pneumonia.Clin Microbiol Infect. 2022 Oct;28(10):1367-1374. doi: 10.1016/j.cmi.2022.05.003. Epub 2022 May 20. Clin Microbiol Infect. 2022. PMID: 35598857
-
Semi-mechanistic pharmacokinetic-pharmacodynamic modelling of antibiotic drug combinations.Clin Microbiol Infect. 2018 Jul;24(7):697-706. doi: 10.1016/j.cmi.2017.11.023. Epub 2017 Dec 8. Clin Microbiol Infect. 2018. PMID: 29229429 Review.
-
Community-Acquired Urinary Tract Infection by Escherichia coli in the Era of Antibiotic Resistance.Biomed Res Int. 2018 Sep 26;2018:7656752. doi: 10.1155/2018/7656752. eCollection 2018. Biomed Res Int. 2018. PMID: 30356438 Free PMC article. Review.
Cited by
-
Model-based translation of the PKPD-relationship for linezolid and vancomycin on methicillin-resistant Staphylococcus aureus: from in vitro time-kill experiments to a mouse pneumonia model.J Antimicrob Chemother. 2025 Jul 1;80(7):1860-1868. doi: 10.1093/jac/dkaf140. J Antimicrob Chemother. 2025. PMID: 40343749 Free PMC article.
References
-
- De Cueto M, Aliaga L, Alós J-I et al. Executive summary of the diagnosis and treatment of urinary tract infection: guidelines of the Spanish Society of Clinical Microbiology and Infectious Diseases (SEIMC). Enfermedades Infecc Microbiol Clínica 2017; 35: 314–20. 10.1016/j.eimc.2016.11.005 - DOI - PubMed
MeSH terms
Substances
Grants and funding
LinkOut - more resources
Full Text Sources
Medical
