. 2025 Jan;55(1):e202451061.
doi: 10.1002/eji.202451061. Epub 2024 Nov 16.

The Microbiome Modifies Manifestations of Hemophagocytic Lymphohistiocytosis in Perforin-Deficient Mice

Affiliations

The Microbiome Modifies Manifestations of Hemophagocytic Lymphohistiocytosis in Perforin-Deficient Mice

Jasmin Mann et al. Eur J Immunol. 2025 Jan.

Abstract

Primary hemophagocytic lymphohistiocytosis (HLH) is a life-threatening hyperinflammatory syndrome caused by inborn errors of cytotoxicity. Patients with biallelic PRF1 null mutations (encoding perforin) usually develop excessive immune cell activation, hypercytokinemia, and life-threatening immunopathology in the first 6 months of life, often without an apparent infectious trigger. In contrast, perforin-deficient (PKO) mice only develop HLH after systemic infection with lymphocytic choriomeningitis virus (LCMV). We hypothesized that restricted microbe-immune cell interactions due to specific pathogen-free (SPF) housing might explain the need for this specific viral trigger in PKO mice. To investigate the influence of a "wild" microbiome in PKO mice, we fostered PKO newborns with Wildling microbiota ('PKO-Wildlings') and monitored them for signs of HLH. PKO-Wildlings survived long-term without spontaneous disease. Also, systemic infection with vaccinia virus did not reach the threshold of immune activation required to trigger HLH in PKO-Wildlings. Interestingly, after infection with LCMV, PKO-Wildlings developed an altered HLH pattern. This included lower IFN-γ serum levels along with improved IFN-γ-driven anemia, but more elevated levels of IL-17 and increased liver inflammation compared with PKO-SPF mice. Thus, wild microbiota alone is not sufficient to trigger HLH in PKO mice, but host-microbe interactions shape inflammatory cytokine patterns, thereby influencing manifestations of HLH immunopathology.

Keywords: Wildling; hemophagocytic lymphohistiocytosis; microbiome; perforin‐deficiency.


Conflict of interest statement

The authors declare no conflicts of interest.

Figures
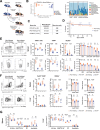
FIGURE 1
FIGURE 1
Transfer of a diverse microbiome into PKO mice does not provoke spontaneous HLH. (A) Experimental setup for generating PKO‐Wildlings. (B) Microbiome analysis of fecal samples from Wildlings and SPF mice. Principal coordinate analysis (PCoA) with distance calculation using Bray‐Curtis dissimilarity (left). Relative abundance at the rank of phylum (right). (C) Mean litter size and wean‐to‐born ratio for PKO‐Wildling, PKO‐SPF, and C57BL/6J mice [31]. (D) Kaplan–Meier curve of cumulative survival probability for PKO‐Wildling and PKO‐SPF mice at indicated time points after birth (n = number of mice). Ticks indicate censored animals. (E) Representative contour plots of indicated antigens on isolated splenocytes (left). Relative and absolute abundance of CD8+ T cells, CD44+, and KLRG1+ antigen‐experienced CD8+ T cells in the spleen and liver (right). (F) Contour plots depicting FoxP3, CD25, and RORγt expression (left). Frequency and total counts of FoxP3+ CD25+ CD4+ Tregs and RORγt+ T cells. (G) Abundance of indicated populations in the spleen and liver. (E–G) Data represent mean ± SD, pooled from at least two independent experiments with 3 mice/group, aged 9–16 weeks of age. Statistical differences were determined using unpaired Student's t‐test, Mann–Whitney test, or multiple unpaired t‐tests with correction for multiple comparisons using the Holm–Šidák method.
FIGURE 2
FIGURE 2
PKO‐Wildlings do not develop HLH after infection with vaccinia virus. PKO‐Wildling, B6‐Wildling, and PKO‐SPF mice were infected with 2 × 106 pfu vaccinia virus WR (VVWR) and HLH parameters were analyzed 10 days later. (A) Body weight is shown as mean percentage ± SD of initial body weight pooled from 2 independent experiments with 2–3 mice/group. (B) Ear temperature on day 0 and day 10 after infection. The grey area represents the reference range of noninfected B6‐SPF animals (mean ± 2xSD). (C) Spleen weight as a percentage of body weight. (D) Number of white blood cells (WBC), hemoglobin (HGB) and platelet (PLT) count measured in EDTA‐blood. (E–H) Ferritin, triglycerides (TGC), soluble CD25 (sCD25), and glutamate‐pyruvate transaminase (GPT) in serum. (B–H) Symbols represent individual mice and shown is mean ± SD. Data were pooled from two independent experiments with 2–3 mice/group. Noninfected (n.i.) B6‐SPF mice are shown as a healthy reference. Statistical testing was performed using an unpaired Student's t‐test.
FIGURE 3
FIGURE 3
PKO‐Wildlings develop lethal HLH immunopathology after LCMV infection similar to PKO‐SPF mice. Mice were infected with 200 pfu LCMV‐WE i.v. and HLH parameters were assessed on day 11/12 after infection. (A) Body weight of LCMV‐infected mice at indicated time points. Shown is mean ± SD of 4 independent experiments with 2–4 mice/group. (B) Ear temperature on day 0 and day of analysis. (C, D) Spleen and liver weight as a percentage of body weight. (E) White blood cell (WBC) count, hemoglobin (HGB), and platelet numbers (PLT) measured in EDTA blood. (F–H) Ferritin, triglycerides (TGC), and soluble CD25 (sCD25) in serum of LCMV‐infected mice. (B–H) Symbols represent individual mice, shown as mean ± SD, pooled from 2–4 independent experiments with 2–4 mice/group. Healthy noninfected (n.i.) B6‐SPF mice are shown for comparison. Statistical testing to compare PKO‐Wildling and PKO‐SPF mice was done by two‐way ANOVA and Šidák post hoc analysis (B), Mann–Whitney test (C–E, G‐H), and unpaired Student's t‐test (B, F).
FIGURE 4
FIGURE 4
Presence of Wildling microbiota in PKO mice promotes liver pathology during LCMV‐induced HLH. (A) Glutamate‐pyruvate transaminase (GPT) and lactate‐dehydrogenase (LDH) in serum of LCMV‐infected mice analyzed on day 11/12 after infection. Noninfected (n.i.) B6‐SPF mice are shown as a reference. (B) Viral titers in the liver, spleen, lung, and kidney. Shown is the median with an interquartile range. (C) The contour plot depicts the staining of F4/80 and Ly‐6G on density‐isolated immune cells from the liver of LCMV‐infected mice (left). The graph shows absolute numbers of NK cells (NK1.1+ CD3), F4/80+ CD11b+ macrophages, dendritic cells (DC, CD11c+ SiglecH+/CD11c+ MHCII+), and Neutrophils (CD11b+ Ly‐6G+) in the liver (right). (D) Representative flow cytometry plots showing expression of CD8, CD4, FoxP3, and CD25 on liver immune cells (left), and percentages and total numbers of indicated cell subsets (right). (E) Representative images of CD8 and F4/80 immunohistochemistry staining of liver sections with H&E counterstaining (scale bar = 50 µm). Insert: Examples of hemophagocytosis. Quantification of hemophagocytic macrophages per 10 high‐power fields (HPF) assessed based on F4/80 staining and number of CD8+ cells per mm2 liver tissue. (A, C–E) Shown is mean ± SD. Symbols represent individual mice pooled from 2–4 independent experiments with 2–4 mice/group. Statistical testing was performed using unpaired Student‘s t‐test (A), Mann–Whitney test (A, B, D, E), and multiple t‐tests with correction for multiple comparisons by Holm‐Šidák (C).
FIGURE 5
FIGURE 5
Wildling microbiota modulates the cytokine pattern in LCMV‐triggered HLH. (A) PCA Biplot of 32 cytokines analyzed by multiplex assay in serum of mice on day 12 after LCMV‐WE infection. Points represent individual mice and colored arrows indicate the contribution of selected cytokines. (B) Serum concentration of selected HLH‐related cytokines. Horizontal line and error bars indicate the median with interquartile range. (C) IFN‐γ expression of CD8+ T cells after ex vivo restimulation with GP33‐41 peptide (left). The abundance of IFN‐γ‐producing CD8+ T cells in spleens upon ex vivo restimulation with GP33‐41 peptide or PMA/Ionomycin (right). (D) RORγt expression in TCRβ+ T cells isolated from the liver (left). Frequency and absolute number of RORγt+ T cells in the liver (right). (C, D) Shown is mean ± SD. (A–D) Results shown are representative of two experiments performed with similar outcomes (A, B) or pooled from two independent experiments with 2–4 mice/group (C, D). Statistical testing was done by unpaired Student's t‐test (B‐D).

References

    1. Stepp S. E., Dufourcq‐Lagelouse R., Le Deist F., et al., “Perforin Gene Defects in Familial Hemophagocytic Lymphohistiocytosis,” Science 286, no. 5446 (1999): 1957–1959. - PubMed
    1. Feldmann J., Callebaut I., Raposo G., et al., “Munc13‐4 is Essential for Cytolytic Granules Fusion and is Mutated in a Form of Familial Hemophagocytic Lymphohistiocytosis (FHL3),” Cell 115, no. 4 (2003): 461–473. - PubMed
    1. zur Stadt U., Schmidt S., Kasper B., et al., “Linkage of Familial Hemophagocytic Lymphohistiocytosis (FHL) Type‐4 to Chromosome 6q24 and Identification of Mutations in Syntaxin 11,” Human Molecular Genetics 14, no. 6 (2005): 827–834. - PubMed
    1. zur Stadt U., Rohr J., Seifert W., et al., “Familial Hemophagocytic Lymphohistiocytosis Type 5 (FHL‐5) Is Caused by Mutations in Munc18‐2 and Impaired Binding to Syntaxin 11,” American Journal of Human Genetics 85, no. 4 (2009): 482–492. - PMC - PubMed
    1. Henter J. I., Horne A., Arico M., et al., “HLH‐2004: Diagnostic and Therapeutic Guidelines for Hemophagocytic Lymphohistiocytosis,” Pediatric Blood & Cancer 48, no. 2 (2007): 124–131. - PubMed

MeSH terms

LinkOut - more resources