. 2024 Dec:159:107108.
doi: 10.1016/j.oraloncology.2024.107108. Epub 2024 Nov 15.

Long read sequencing identifies complex structural variant landscape and recurrent TERT rearrangements in mucoepidermoid carcinoma

Affiliations

Long read sequencing identifies complex structural variant landscape and recurrent TERT rearrangements in mucoepidermoid carcinoma

Elizabeth Gensterblum-Miller et al. Oral Oncol. 2024 Dec.

Abstract

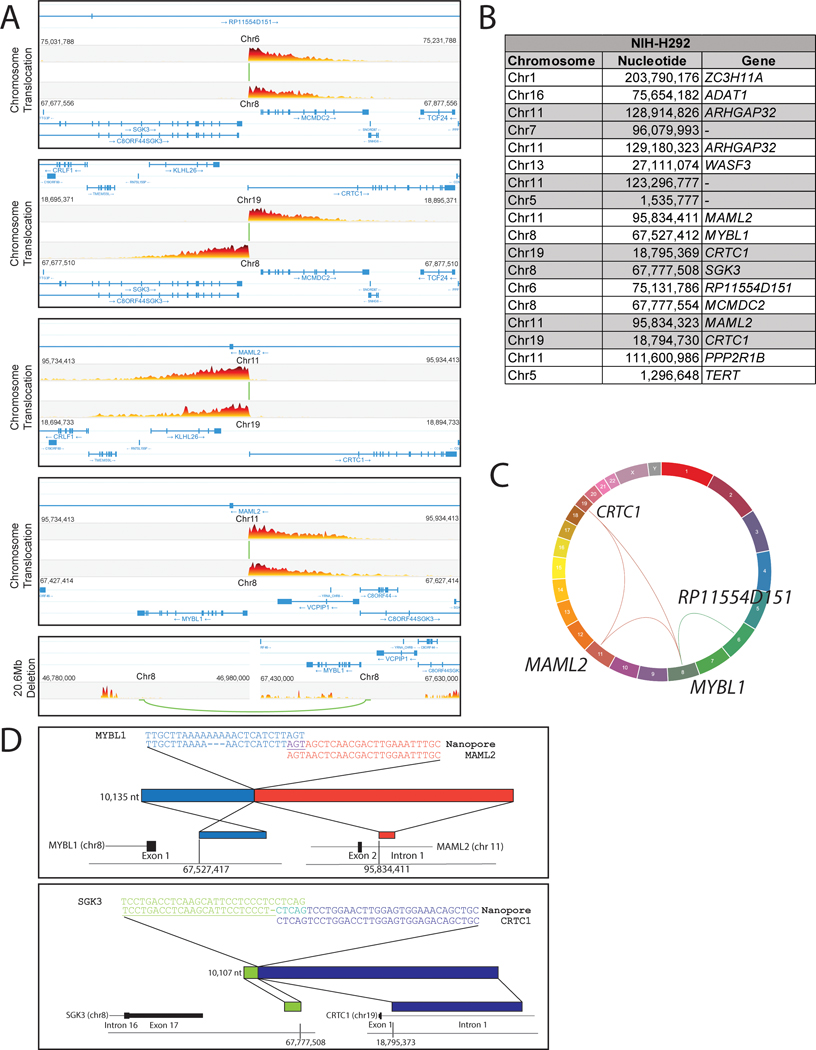
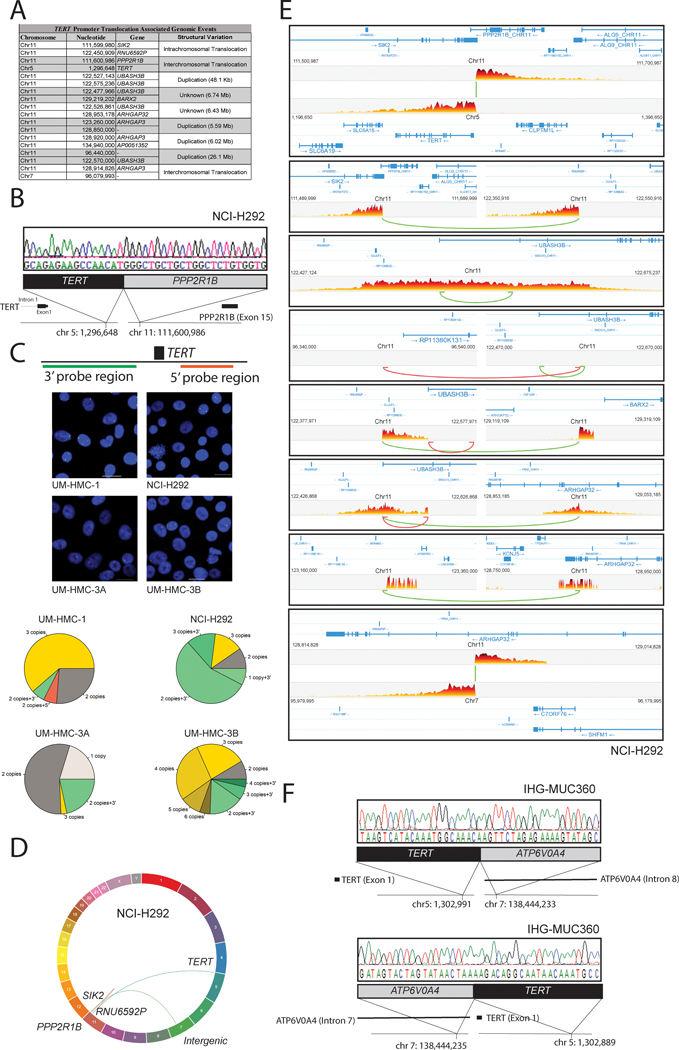
Mucoepidermoid Carcinoma (MEC) is a common salivary malignant neoplasm. Approximately 60 % of MECs harbor translocations between CRTC1 or CRTC3 and MAML2, which are thought to drive disease pathogenesis. However, the precise structural mechanism driving this rearrangement remains uncharacterized. Here, we performed multi-omic and long read genomic sequencing, discovering a chain of alterations that created the CRTC1::MAML2 fusion, but also an unexpected MAML2 to MYBL1 rearrangement, suggesting that MYBL1 may play a larger role in salivary gland cancers than previously recognized. Furthermore, we discovered and validated recurrent TERT rearrangements and amplifications in MEC models. 5/5 MEC cell lines and 36/39 (92 %) primary MEC tumors harbored a TERT rearrangement or copy number amplification. Custom sequencing of the TERT locus confirmed translocation breakpoints in 13/33 (39 %) MECs, while exome sequencing confirmed frequent TERT amplifications. Critically, TERT knockdown in NCI-H292, a cell line with TERT promoter rearrangement, reduced clonogenic cell survival, supporting a critical role of this gene in MEC tumorigenesis. Overall, our data suggest that complex chromothripsis rearrangement mechanisms drive the formation of structural variation in CRTC1::MAML2 fusion positive and negative tumors and reveal highly recurrent structural variation driving TERT rearrangement in MEC.

Keywords: CRTC1; MAML2; MEC; NOTCH2; Structural variation; TERT; Translocation.


Conflict of interest statement

Declaration of competing interest The authors declare that they have no known competing financial interests or personal relationships that could have appeared to influence the work reported in this paper.

Figures

Figure 1.
Figure 1.. CRTC1::MAML2 breakpoint is directly sequenced by long read Nanopore DNA sequencing.
A) Coordinates of reads split between both CRTC1 and MAML2 for each cell line sequenced. UM-HMC-3A and UM-HMC-3B share a genetic background, so are recorded as UM-HMC-3. B) Schematic represents independent reads that identify the CRTC1::MAML2 breakpoint in NCI-H292, C) UM-HMC-1, D) UM-HMC-3A, and UM-HMC-3B. Consensus sequences of each breakpoint are shown.
Figure 2.
Figure 2.. Linked Read Sequencing Resolves the Genetic Mechanism Driving CRTC1::MAML2 Rearrangement in the NCI-H292 Mucoepidermoid Carcinoma Cell Line.
A) Five structural variations were discovered in NCI-H292, associated with the CRTC1 to MAML2 genomic rearrangement. Structures of individual events are shown. B) High confidence chromosomal rearrangements and estimated genomic breakpoints discovered in NCI-H292. C) Schematic representation shows independent reads used to identify the MYBL1 to MAML2 translocation, and the SGK3 to CRTC1 translocation. GRCh37/hg19 coordinates are shown, with sequences spanning the breakpoint annotated at the top of the figure D) Genome-wide view of the chained structural events leading to the CRTC1 to MAML2 translocation.
Figure 3.
Figure 3.. Discovery and Validation of Recurrent Structural Variation at the TERT Promoter in MEC.
A) The coordinates for the nine linked high and low confidence structural events associated with a structural rearrangement in which the 5’ region of the PPP2R1B gene is rearranged to replace the TERT promoter in NCI-H292 are listed. Additional structural variations to Chr11 include potential deletions and duplications of UBASH3B, ARHGAP32, and the BARX2 genes as well as translocation of ARHGAP3 and SIK2. Linked read estimated breakpoints are shown. B) Sanger sequencing was used to validate the PPP2R1B to TERT rearrangement breakpoint in NCI-H292 C) TERT locus visualized by FISH with TERT break apart probe with orange (5-TAMRA) fluorophore adjacent to the 5’ region of TERT and green (5-Fluoresceine) fluorophore adjacent to the 3’ region (schematic top panel). Nucleus is blue (DAPI). Scale bar=20 μm. Right panel shows quantification of TERT locus FISH, N>50 cells per cell line. D) Genome-wide view of the chained structural events leading to the PPP2R1B to TERT translocation, E) Structure of individual breakpoint events in NCI-H292, identified by linked read sequencing. F) Sanger sequencing presenting the chromosome der(5) (left) and chromosome der(7) (right) junction at single base pair resolution of the TERT rearrangement identified in the IHG-360 MEC cell line.
Figure 4.
Figure 4.. MAML2 and TERT structural variation detected by FISH.
A) Representative images of each structural variant. Nuclei are stained with DAPI (blue). MAML2 break apart is characterized by an orange (5-TAMRA, 5’) puncta separated from a green (5-Fluorescein, 3’) puncta. For the second copy of MAML2, the 5’ and 3’ signal overlap, indicating a wild-type structure. TERT variants include amplification, break apart, and 5’/3’ alteration (bar=5 micron). Wild type and break apart punctae are characterized as with MAML2. Amplification is characterized by more than 2 wild type punctae in a single cell, or two wild type punctae if a break apart is present and represents the presence of either a focal TERT amplicon or a larger amplicon from the 5p region containing the TERT gene. TERT break apart is characterized by separated orange (5’) and green (3’) punctae. 5’ or 3’ alteration is characterized by a single orange (5’) or green (3’) signal, without the other color also being present. Due to the frequency of TERT amplification, the same event could be described as a 3’ amplification or a 5’ deletion, which is why the descriptor “alteration” was chosen. B) Proportion of tumors containing each kind of MAML2 (top, N=56) or TERT (bottom, N=49) structural variation. Scale bar=5μm. C) Overlap between tumors containing MAML2 and TERT structural variants. There is significant overlap between tumors containing mutations in each gene (Fisher’s exact test, p=0.0283) D) Kaplan-Meier survival analysis shows that presence of MAML2, but not TERT, structural variants are associated with increased disease-specific survival (DSS) and overall survival (OS). E) Oncoplot highlighting recurrent single nucleotide variants and insertions/deletions (INDELs) in the cohort. CRTC1/3::MAML2 fusion status of each tumor is shown in the top bar. F) Copy number annotation of each of the highlighted genes from panel C, along with CRTC1/3::MAML2 fusion status. G) Representative Manhattan plots of Chromosome 5 from the three tumors with called focal TERT amplification.
Figure 5.
Figure 5.. Translocations identified by targeted capture sequencing.
A) Genes and intergenic regions associated with a called translocation. 26/33 samples contain one or more translocations captured by the targeted panel, and are pictured. B) Venn diagram of samples containing TERT (red) and MAML2 (blue) translocations. Translocations involving either locus were not detected in 12/33 samples. There is significant overlap between TERT and MAML2 translocations (Fisher’s exact test p=0.0005). C) Translocations associated with MAML2 (blue). D) Translocations associated with genes and the intergenic region within the genomic locus flanking TERT by 50,000 base pairs (red). E-F) genomic positions of breakpoints associated with E) MAML2 and F) TERT genetic loci.
Figure 6.
Figure 6.. Functional Evaluation of the Role of TERT in NCI-H292.
A) Dependency Score. The CERESdepletion score was based on data from a depletion assay. A lower CERESscore indicates a higher likelihood that the gene is essential in each cell line. A score of zero indicates that a gene is not essential, and a score of −1 is comparable to the median of all pan-essential genes. Dropout CRISPR screening data were downloaded from the Avana 19Q3 public release. MAML2 and TERT are essential for survival in NCI-H292. B and C) TERT shRNA was used to infect NCI-H292 or UM-SCC-104 cells, and changes in telomerase protein expression were detected by Western blot. D) Cells from D & E were re-plated into clonogenic cell survival assays after 48 hours and grown in culture in parallel for >10 days, at which point plates were imaged to show relative colony formation for each condition.

References

    1. Dombrowski ND, Wolter NE, Irace AL, Cunningham MJ, Mack JW, Marcus KJ, et al. Mucoepidermoid carcinoma of the head and neck in children. Int J Pediatr Otorhinolaryngol. 2019;120:93–9. - PubMed
    1. Granic M, Suton P, Mueller D, Cvrljevic I, Luksic I. Prognostic factors in head and neck mucoepidermoid carcinoma: experience at a single institution based on 64 consecutive patients over a 28-year period. Int J Oral Maxillofac Surg. 2018;47:283–8. - PubMed
    1. Nance MA, Seethala RR, Wang Y, Chiosea SI, Myers EN, Johnson JT, et al. Treatment and survival outcomes based on histologic grading in patients with head and neck mucoepidermoid carcinoma. Cancer. 2008;113:2082–9. - PMC - PubMed
    1. Spiro RH. Salivary neoplasms: overview of a 35-year experience with 2,807 patients. Head Neck Surg. 1986;8:177–84. - PubMed
    1. McHugh CH, Roberts DB, El-Naggar AK, Hanna EY, Garden AS, Kies MS, et al. Prognostic factors in mucoepidermoid carcinoma of the salivary glands. Cancer. 2012;118:3928–36. - PubMed