. 2025 Mar;87(3):342-354.
doi: 10.1016/j.eururo.2024.10.024. Epub 2024 Nov 16.

Molecular Heterogeneity and Immune Infiltration Drive Clinical Outcomes in Upper Tract Urothelial Carcinoma

Affiliations

Molecular Heterogeneity and Immune Infiltration Drive Clinical Outcomes in Upper Tract Urothelial Carcinoma

Kwanghee Kim et al. Eur Urol. 2025 Mar.

Abstract

Background and objective: Molecular classification of upper tract urothelial carcinoma (UTUC) can provide insight into divergent clinical outcomes and provide a biological rationale for clinical decision-making. As such, we performed multi-omic analysis of UTUC tumors to identify molecular features associated with disease recurrence and response to immune checkpoint blockade (ICB).

Methods: Targeted DNA and whole transcriptome RNA sequencing was performed on 100 UTUC tumors collected from patients undergoing nephroureterectomy. Consensus non-negative matrix factorization was used to identify molecular clusters associated with clinical outcomes. Gene set enrichment and immune deconvolution analyses were performed. Weighted gene co-expression network analysis was employed for unsupervised identification of gene networks in each cluster.

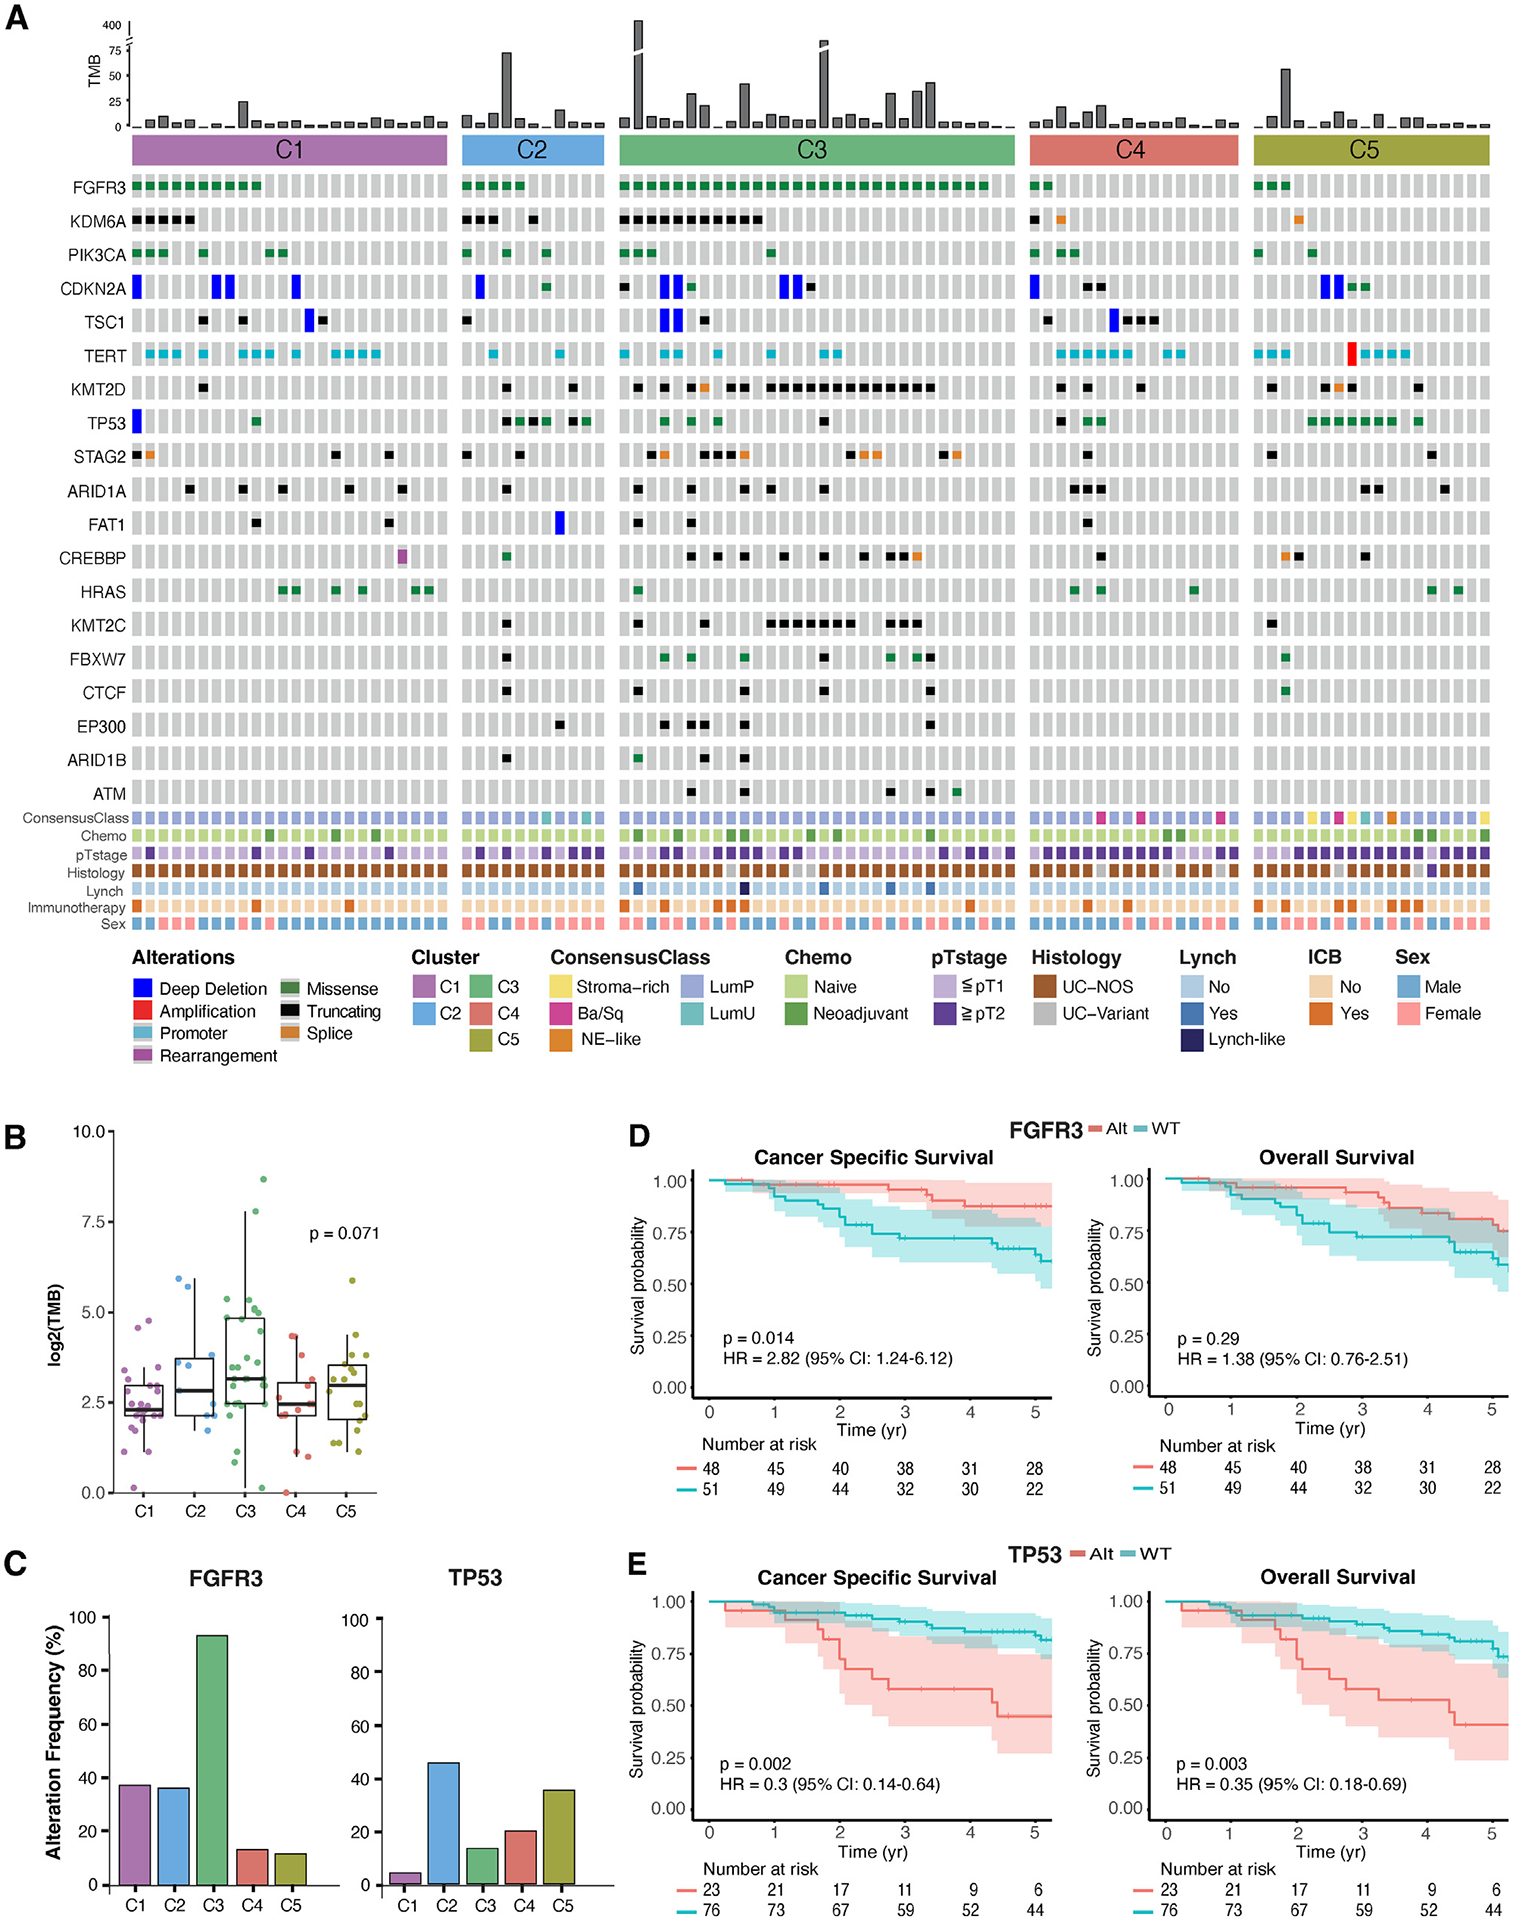
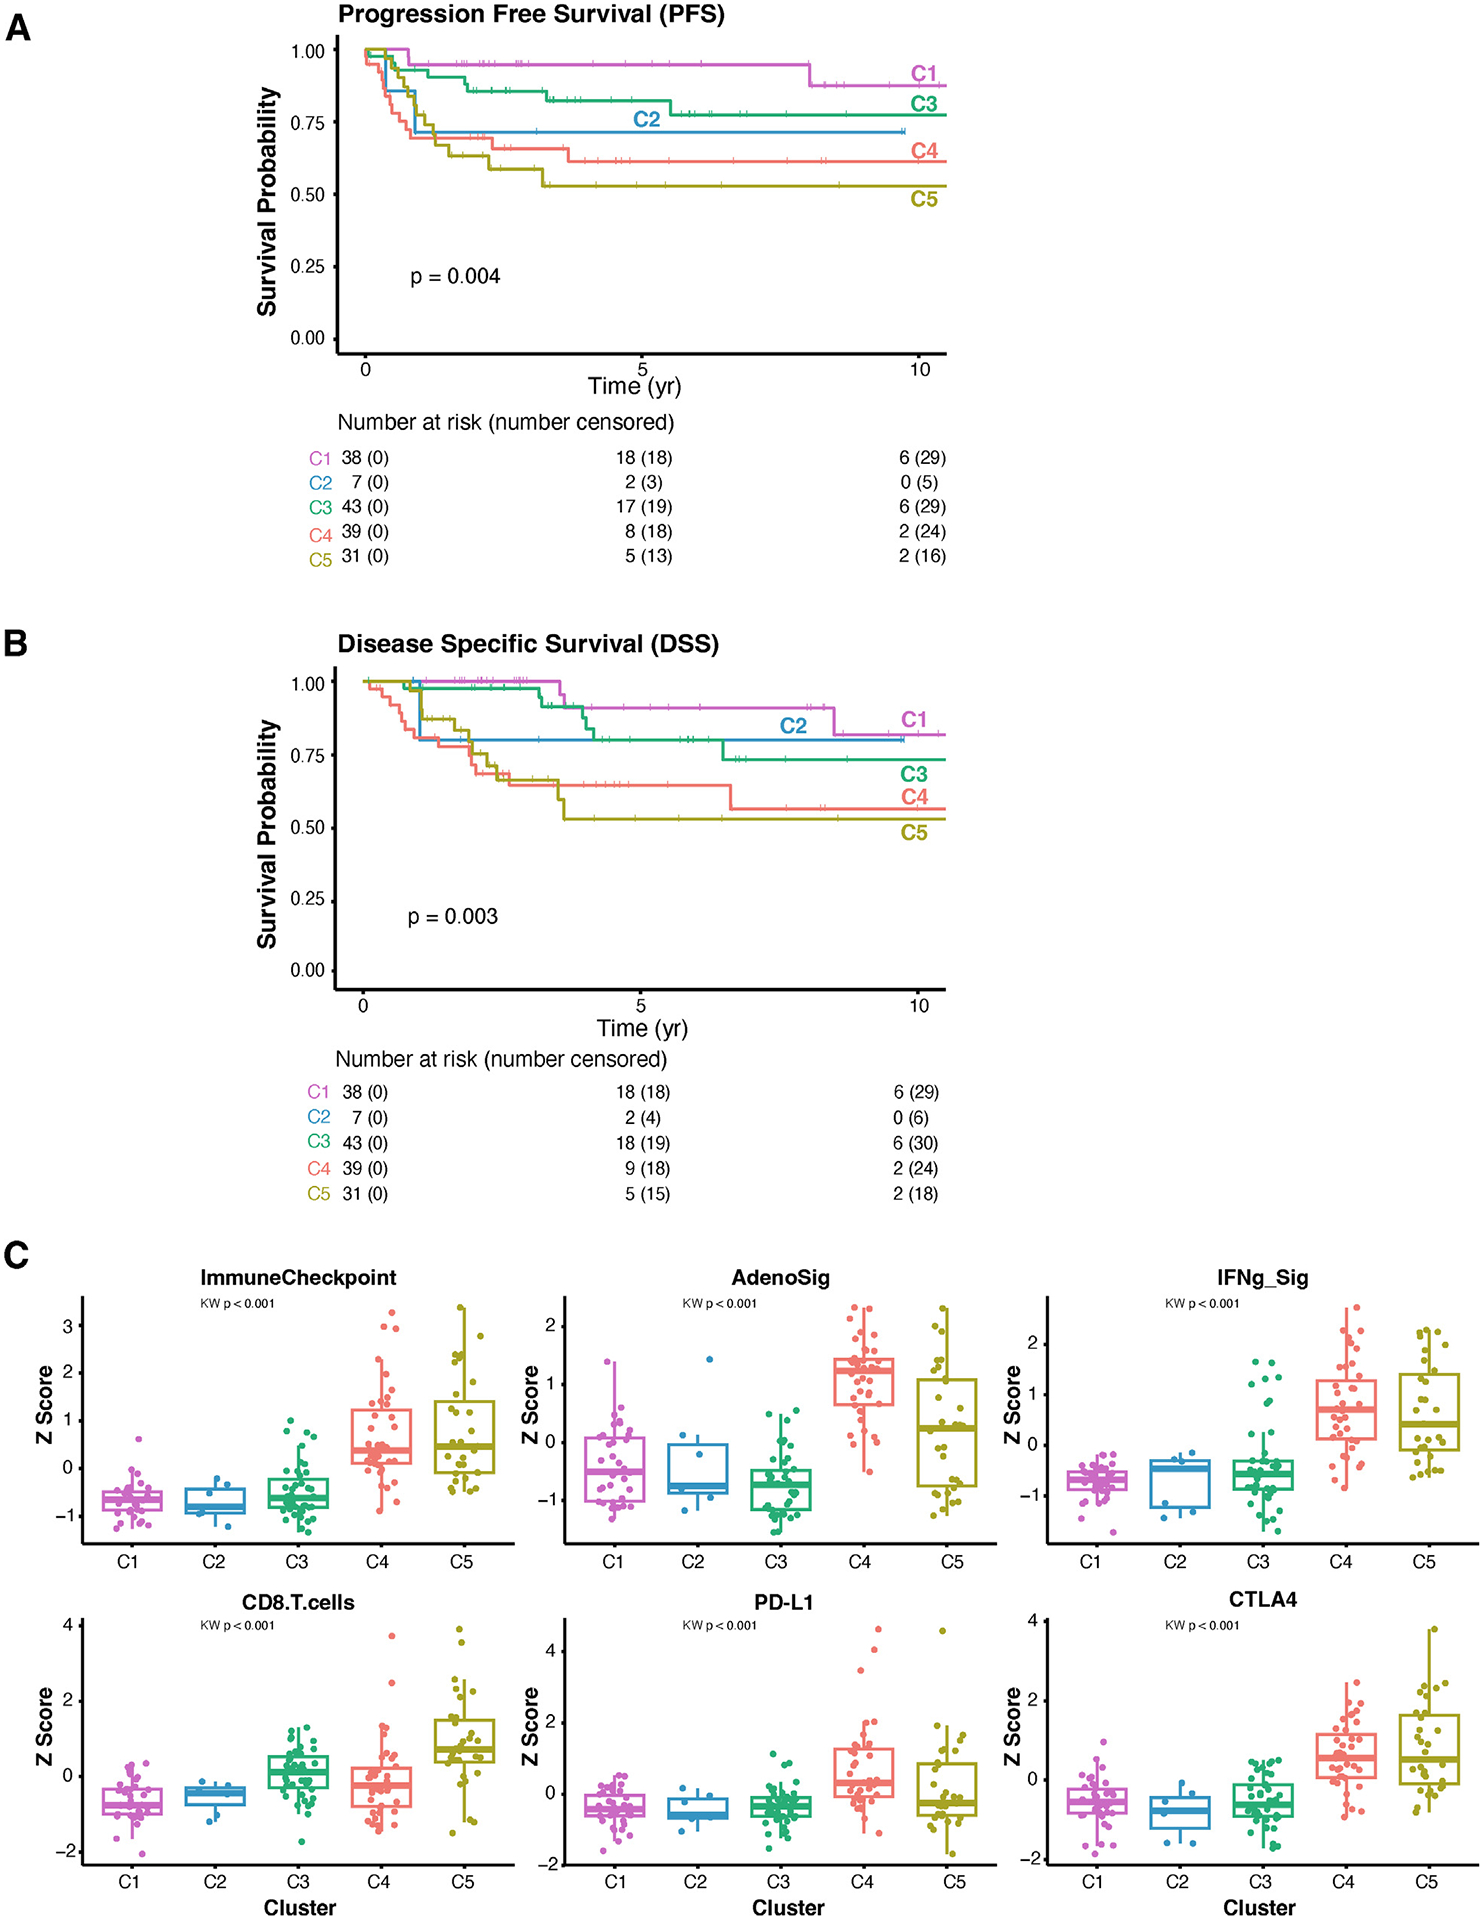
Key findings and limitations: Five molecular clusters with distinct clinical outcomes were identified. Favorable subtypes (C1 and C2) were characterized by a luminal-like signature and an immunologically depleted tumor microenvironment (TME). Subtype C3 was characterized by FGFR3 alterations and a higher tumor mutational burden, and included all tumors with microsatellite instability. Despite higher rates of recurrence and inferior survival, subtypes C4 and C5 harbored an immunologically rich TME favoring response to ICB. Limitations include extrapolation of molecular features of tumors from the primary site to determine response to systemic immunotherapy and the limited resolution of bulk sequencing to distinguish gene expression in the tumor, stroma, and immune compartments.

Conclusions and clinical implications: RNA sequencing identified previously underappreciated UTUC molecular heterogeneity and suggests that UTUC patients at the highest risk of metastatic recurrence following surgery include those most likely to benefit from perioperative ICB.

Keywords: Immune checkpoint blockade; Molecular clusters; Targeted exome sequencing; Tumor microenvironment; Upper tract urothelial cancer; Whole transcriptomic sequencing.


Figures

Fig. 1 –
Fig. 1 –
Whole transcriptomic analysis of UTUC tumors identifies five molecular clusters associated with clinical outcomes. (A) Clinical characteristics and transcriptional profiles based on the consensus classification schema for bladder cancers developed by the Bladder Cancer Molecular Taxonomy Group for 100 UTUC tumors (MSK100 cohort) and The Cancer Genome Atlas (TCGA) muscle-invasive bladder urothelial carcinoma cohort. (B) Clustering analysis of RNA-seq data for the MSK100 cohort based on consensus non-negative matrix factorization (cNMF) revealed five distinct clusters (C1: n = 24; C2: n = 11; C3: n = 30; C4: n = 17; and C5: n = 18). The top 10% of most varied genes (n = 2260 genes) determined by median absolute deviation were used for cNMF analysis. (C) Progression-free survival showing the association of transcriptional subtypes and metastatic recurrence. Recurrence was defined as any metastatic disease recurrence following nephroureterectomy. (D) Cancer-specific survival and (E) overall survival based on transcriptional subtype. The median time frame of the follow-up period post-nephroureterectomy was 60 mo, and IQR was 32.3–86.3 mo. Ba/Sq = basal/squamous; IQR = interquartile range; LumNS = luminal nonspecified; LumP = luminal papillary; LumU = luminal unstable; N = no; NE = neuroendocrine; RNA-seq = RNA sequencing; UTUC = upper tract urothelial carcinoma; Y = yes.
Fig. 2 –
Fig. 2 –
Integrated analysis of DNA and RNA sequencing of UTUC tumors identifies differences in somatic mutational profiles among transcriptionally defined molecular clusters. (A) Oncoprint showing oncogenic/likely oncogenic somatic alterations in select frequently mutated genes in the MSK100 cohort. Samples were grouped based on the five transcriptomic clusters identified in Figure 1. (B) Mean tumor mutation burden of each transcriptionally defined cluster. The box represents the interquartile range (IQR) and the line indicates the median. Whiskers extend from the box to the smallest and largest values within 1.5 times the IQR from the lower and upper quartiles, respectively, delineating the range of typical data values. (C) Frequency of FGFR3 and TP53 mutations as a function of transcriptomic cluster. FGFR3 mutations were most common in C3 (93%), whereas TP53 mutations were most common in C2 (55%) and C5 (47%). Clinical outcome as a function of (D) FGFR3 and (E) TP53 mutational status. DNA sequencing results were not available for one tumor in the C2 cluster due a lack of sufficient tissue. Ba/Sq = basal/squamous; CI = confidence interval; HR = hazard ratio; ICB = immune checkpoint blockade; LumP = luminal papillary; LumU = luminal unstable; NE = neuroendocrine; NOS = not otherwise specified; TMB = tumor mutational burden.
Fig. 3 –
Fig. 3 –
Increased immune infiltration in transcriptional clusters associated with a higher risk for disease recurrence following nephroureterectomy. (A) Tumor intrinsic characteristics of each transcriptional cluster. (B) Weighted correlation network analysis (WGCNA) heatmap demonstrating gene set expression as a function of transcriptional subtypes. (C) Association between gene modules and disease-free and overall survival. (D) Immune signatures derived from immune deconvolution analysis stratified by clusters: p value by Kruskal-Wallis (KW) test. The ImmuneCheckpoint signature, which includes immune checkpoint blockade target genes including CTLA-4, LAG-3, PD-1, PD-L1, PD-L2, TIM3, and TIGIT, was used for evaluating potential immune checkpoint signaling based on RNA-seq analysis [21]. The immune marker signature scores including ImmuneCheckpoint, IFN-γ, CD8 T cells, PD-L1, CTLA4, and AdenoSig were derived through single-sample gene set enrichment analysis. AdenoSig is a signature of adenosine signaling, which has been associated with suppression of NK and CD8 function and recruitment of immunosuppressive cells [41]. CI = confidence interval; DFS = disease-free survival; HR = hazard ratio; NK = natural killer cell..
Fig. 4 –
Fig. 4 –
Comparison of the MSK100 and Fujii158 cohorts. (A) Progression-free survival showing the association of transcriptional subtypes and metastatic recurrence. (B) A Kaplan-Meier plot of DSS as a function of transcriptional clusters for the 158 UTUC tumors in the Fujii et al [7] cohort. DSS, not CSS, was utilized, as only DSS was reported for the Fujii et al’s [7] cohort. (C) Select immune features as a function of transcriptional cluster for tumors in the Fujii et al’s [7] cohort. A log transformed expression matrix of the top 10% most varied genes that were included in the cNMF molecular clustering was built by integrating the RNA sequencing data from the MSK100 cohort, the 13 patients in the immune checkpoint inhibitor–treated expansion cohort, and the 158 patients in the Fujii158 cohort after batch correction using the ComBat function from the Rsva package. cNMF = consensus non-negative matrix factorization; CSS = cancer-specific survival; DSS = disease-specific survival.
Fig. 5 –
Fig. 5 –
Molecular phenotypes are associated with divergent response to immune checkpoint blockade (ICB) in metastatic UTUC. (A) A swimmer’s plot depicting the clinical response of individual patients with UTUC to ICB treatment for metastatic disease. Patient responses were ordered using the cytolytic activity (CYT) score inferred from RNA sequencing data, and progression of disease (POD) was determined by imaging. The CYT score was calculated based on the mRNA expression levels of granzyme A (GZMA) and perforin (PRF1). The median of the CYT score was 2.265 and used for the CYT-high cutoff. Tumor mutation count is shown on the left. Arrows represent patients who are alive at the time of last assessment. (B) Clinical response of patients with UTUC to ICB stratified by transcriptional cluster. The median time frame of the first axial imaging following initiation of treatment when determining CR/PR/SD/PD was 9.7 wk (IQR 7.4–11.6 wk). (C) Enrichment of immune effector cell infiltration among patients with CR/PR (n = 10) compared with those with PD (n = 18). For two-group comparison, Mann-Whitney U test (Wilcoxon-Mann-Whitney U test) was used. (D) Disease course and systemic therapies received for two patients with UTUC who had durable responses to ICB. PT12 ([cluster 5], TMB-H [10.8], microsatellite stable) was treated with gemcitabine/carboplatin (Gem/Carbo), BGJ398, and nivolumab followed by intravesical BCG for a subsequent high-grade T1 bladder lesion. BGJ398 was discontinued because of toxicity (abnormal kidney function). PT23 ([cluster 3], TMB-H [27.5], MSI-H), in the setting of Lynch syndrome, was treated with gemcitabine/cisplatin (Gem/Cis) and radiation therapy for brain metastasis, followed by pembrolizumab. Treatment with pembrolizumab was recently resumed after the patient developed a urothelial tumor in the right ureter. BCG = bacillus Calmette-Guerin; CR = complete response; IQR = interquartile range; MSI-H = microsatellite instability high; PD = progression of disease; PR = partial response; RT = radiation therapy; SD = stable disease; TMB = tumor mutational burden.

References

    1. Roupret M, Babjuk M, Comperat E, et al. European Association of Urology guidelines on upper urinary tract urothelial cell carcinoma: 2015 update. Eur Urol 2015;68:868–79. - PubMed
    1. Siegel RL, Miller KD, Jemal A. Cancer statistics, 2016. CA Cancer J Clin 2016;66:7–30. - PubMed
    1. Audenet F, Isharwal S, Cha EK, et al. Clonal relatedness and mutational differences between upper tract and bladder urothelial carcinoma. Clin Cancer Res 2019;25:967–76. - PMC - PubMed
    1. Sfakianos JP, Cha EK, Iyer G, et al. Genomic characterization of upper tract urothelial carcinoma. Eur Urol 2015;68:970–7. - PMC - PubMed
    1. Kamoun A, de Reynies A, Allory Y, et al. A consensus molecular classification of muscle-invasive bladder cancer. Eur Urol 2020;77:420–33. - PMC - PubMed

MeSH terms

Substances