. 2024 Nov 16;11(1):1238.
doi: 10.1038/s41597-024-04081-7.

Temporal single-cell RNA sequencing dataset of gastroesophagus development from embryonic to post-natal stages

Affiliations

Temporal single-cell RNA sequencing dataset of gastroesophagus development from embryonic to post-natal stages

Pon Ganish Prakash et al. Sci Data. .

Abstract

Gastroesophageal disorders and cancers impose a significant global burden. Particularly, the prevalence of esophageal adenocarcinoma (EAC) has increased dramatically in recent years. Barrett's esophagus, a precursor of EAC, features a unique tissue adaptation at the gastroesophageal squamo-columnar junction (GE-SCJ), where the esophagus meets the stomach. Investigating the evolution of GE-SCJ and understanding dysregulation in its homeostasis are crucial for elucidating cancer pathogenesis. Here, we present the technical quality of the comprehensive single-cell RNA sequencing (scRNA-seq) dataset from mice that captures the transcriptional dynamics during the development of the esophagus, stomach and the GE-SCJ at embryonic, neonatal and adult stages. Through integration with external scRNA-seq datasets and validations using organoid and animal models, we demonstrate the dataset's consistency in identified cell types and transcriptional profiles. This dataset will be a valuable resource for studying developmental patterns and associated signaling networks in the tissue microenvironment. By offering insights into cellular programs during homeostasis, it facilitates the identification of changes leading to conditions like metaplasia and cancer, crucial for developing effective intervention strategies.


Conflict of interest statement

Competing interests The authors declare no competing interests.

Figures

Fig. 1
Fig. 1
Schematic overview of experimental design. Graphics depict the esophagus, stomach, and the GE-SCJ tissue regions from mice at distinct developmental stages, including gestational days 15 and 19, newborn (2 days old), and adult (8 weeks old). Further, esophagus and stomach organoids were derived from adult epithelial stem cells to validate and complement physiological relevance. (i). single-cell preparation and capture: The initial step involves tissue or organoid digestion to obtain single cells and subsequent multiplexing of samples using the CMO (cell multiplexing oligos) technique followed by single-cell capture and barcoding using the 10X Genomics Chromium controller. (ii). Library preparation and sequencing: High-quality libraries for 3′ scRNA-seq are prepared and subjected to sequencing. (iii). Data processing and analysis: Upon sequencing, reads are aligned to the reference genome, and samples are demultiplexed, yielding a gene-by-cell count matrix. This matrix is then utilized in the Seurat workflow, facilitating robust data integration and spatial evaluation to measure the consistency and reliability of observations across datasets.
Fig. 2
Fig. 2
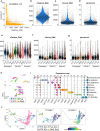
Technical evaluation of scRNA-seq data from E15, E19, pup and adult mice GE-SCJ tissues. (a) Scatter plot illustrating the distribution of genes per cell (nFeature_RNA) relative to the percentage of mitochondrial genes (percent. mt). The dotted rectangle emphasizes the region indicating the optimal quality threshold. A Pearson correlation coefficient of −0.4 was observed between nFeature_RNA and percent.mt. (bd) Following the quality control (QC) step, violin plots depict the distribution of gene count (nFeature_RNA) (b), unique molecular identifier (UMI) count (nCount_RNA) (c), and the percentage of mitochondrial genes (percent.mt) (d). (eg) Violin plots showing the distribution of gene count (nFeature_RNA) (e), unique molecular identifier (UMI) count (nCount_RNA) (f), and the percentage of mitochondrial genes (percent.mt) (g), similar to (ce) but at the individual sample level. (h) UMAP visualization of all indicated samples showing the cell cluster distribution; cells color-coded by developmental time point. (i) Stacked violin plot highlighting the various cell types present in the data along with the expression levels of their respective marker genes. Sq and Co represent squamous and columnar epithelia, respectively. (j) UMAP visualization of the pseudotime developmental trajectories observed in esophageal fibroblast cells, originating from the E15 time point; cells arranged according to pseudotime values, progressing from early (dark blue) to late stages (yellow).
Fig. 3
Fig. 3
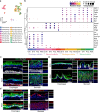
Integration of scRNA-seq datasets reveals consistent cell clustering and gene expression patterns. (a) UMAP visualization of epithelial and stromal cell clusters after data integration; cells are color-coded based on their dataset of origin. (b) Feature plots showing normalized expression levels of stromal markers Acta2 and Dcn; columnar epithelial marker Krt8 and squamous epithelial marker Krt5/Krt13; Basal (red) and differentiated (purple) squamous cells are highlighted by dotted circles. (c) Clustered dot plot illustrating the relative expression levels of epithelial and stromal marker genes across the epithelial and stromal cells obtained from their respective scRNA-seq datasets. Each specific cell type from a dataset expresses only markers unique to them. Dot size indicates the percentage of cells expressing a gene, while color represents the scaled mean expression level from high (dark blue) to low (yellow).
Fig. 4
Fig. 4
Spatial evaluation of the identified markers from scRNA-seq data. (a) UMAP visualization depicting epithelial and stromal cell clusters of esophagus and stomach from various developmental stages; cells are colored according to cell type and time point. (b) Clustered dot plot highlighting the relative expression of genes across epithelial and stromal cells of gastroesophageal tissue at developmental stages. Dot size denotes the percentage of cells expressing a gene, while color indicates the scaled mean expression level from high (dark blue) to low (yellow). (ce) IHC images of mouse esophagus (left panel) and stomach (right panel) tissue sections at embryonic day 19 (E19, upper panel) and adult stages (lower panel) for various markers. (c) CDH1 (green) for epithelia, POSTN (red) for fibroblasts, and ACTA2 (white) for smooth muscle cells. (d, left panel) KRT5 (green) for squamous epithelia, P63 (white) for basal progenitor cells, and LORICRIN (red) for squamous differentiated cells. (d, right panel) CHGA (white) for enteroendocrine cells of the stomach base region, and KRT7 (red) for columnar epithelia. (e) CDH1 (green) for epithelia, GATA6 (red) for columnar epithelial-specific transcription factor, and SOX2 (white) for squamous epithelial-specific transcription factor, along with nuclei staining (blue). Images represent three biological replicates.
Fig. 5
Fig. 5
Technical evaluation of the gastroesophageal organoid scRNA-seq data. (a) Scatter plot showing the distribution of genes per cell (nFeature_RNA) relative to the percentage of mitochondrial genes (percent. mt). The dotted rectangle indicates the region of optimal quality threshold. A Pearson correlation coefficient of −0.3 was observed between nFeature_RNA and percent.mt. (bd) Violin plots depicting the distribution of gene count (nFeature_RNA) (b), unique molecular identifier (UMI) count (nCount_RNA) (c), and the percentage of mitochondrial genes (percent.mt) (d) following the QC step. (eg) Violin plots showing the distribution of gene count (nFeature_RNA) (e), unique molecular identifier (UMI) count (nCount_RNA) (f), and the percentage of mitochondrial genes (percent.mt) (g), similar to (bd) but at the individual sample level. (h) UMAP visualization of gastroesophageal epithelial organoids showing the cellular subtypes; cells color-coded by epithelial cell type. (i) Feature plots depicting the absolute expression levels of squamous (Krt5/Krt13) and columnar (Krt8/Krt18) epithelia; Sq and Co represent squamous and columnar epithelia, respectively.

References

    1. Boeckxstaens, G. E. Alterations confined to the gastro-oesophageal junction: the relationship between low LOSP, TLOSRs, hiatus hernia and acid pocket. Best Pract Res Clin Gastroenterol24, 821–829, 10.1016/j.bpg.2010.08.011 (2010). - PubMed
    1. Xie, C. et al. Esophagogastric Junction Contractility Integral Reflect the Anti-reflux Barrier Dysfunction in Patients with Gastroesophageal Reflux Disease. J Neurogastroenterol Motil23, 27–33, 10.5056/jnm16008 (2017). - PMC - PubMed
    1. Zheng, Z. et al. Current Advancement on the Dynamic Mechanism of Gastroesophageal Reflux Disease. Int J Biol Sci17, 4154–4164, 10.7150/ijbs.65066 (2021). - PMC - PubMed
    1. Spechler, S. J. & Souza, R. F. Barrett’s esophagus. N Engl J Med371, 836–845, 10.1056/NEJMra1314704 (2014). - PubMed
    1. Mikolasevic, I., Bokun, T. & Filipec Kanizaj, T. Gastroesophageal reflux disease, Barrett esophagus, and esophageal adenocarcinoma - where do we stand? Croat Med J59, 97–99, 10.3325/cmj.2018.59.97 (2018). - PMC - PubMed

LinkOut - more resources