. 2024 Nov 16;15(1):9945.
doi: 10.1038/s41467-024-54407-7.

NOTCH1 mitochondria localization during heart development promotes mitochondrial metabolism and the endothelial-to-mesenchymal transition in mice

Affiliations

NOTCH1 mitochondria localization during heart development promotes mitochondrial metabolism and the endothelial-to-mesenchymal transition in mice

Jie Wang et al. Nat Commun. .

Abstract

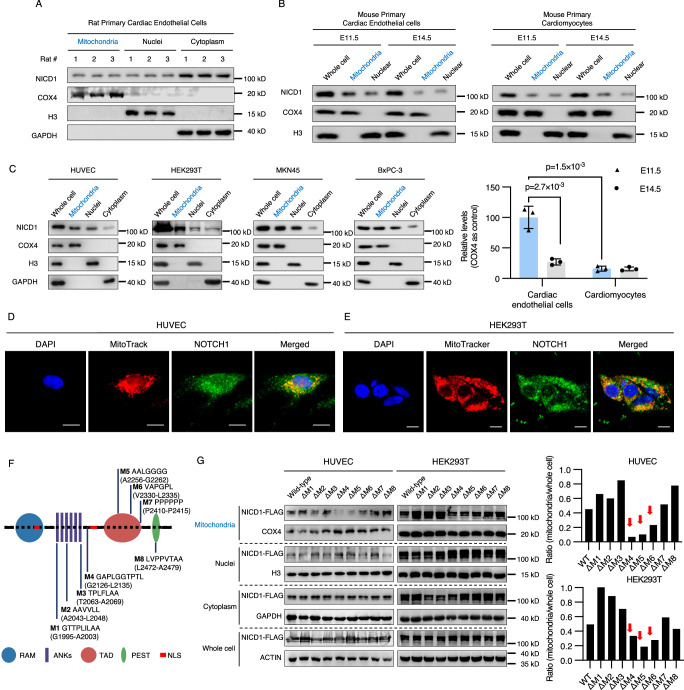
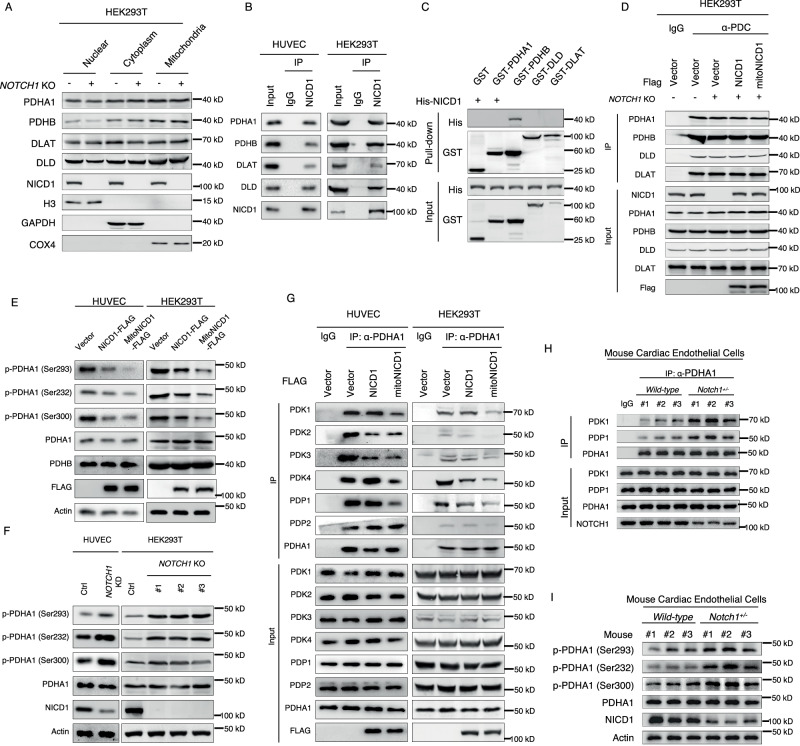
Notch signaling activation drives an endothelial-to-mesenchymal transition (EndMT) critical for heart development, although evidence suggests that the reprogramming of endothelial cell metabolism can regulate endothelial function independent of canonical cell signaling. Herein, we investigated the crosstalk between Notch signaling and metabolic reprogramming in the EndMT process. Biochemically, we find that the NOTCH1 intracellular domain (NICD1) localizes to endothelial cell mitochondria, where it interacts with and activates the complex to enhance mitochondrial metabolism. Targeting NICD1 to mitochondria induces more EndMT compared with wild-type NICD1, and small molecule activation of PDH during pregnancy improves the phenotype in a mouse model of congenital heart defect. A NOTCH1 mutation observed in non-syndromic tetralogy of Fallot patients decreases NICD1 mitochondrial localization and subsequent PDH activity in heart tissues. Altogether, our findings demonstrate NICD1 enrichment in mitochondria of the developing mouse heart, which induces EndMT by activating PDH and subsequently improving mitochondrial metabolism.


Conflict of interest statement

Competing interests The authors declare no competing interests.

Figures

Fig. 1
Fig. 1. Intracellular distribution pattern of NOTCH1 intracellular domain (NICD1) in mouse cardiac endothelial cells and cultured cell lines.
A Representative western blot illustrating NICD1 levels in subcellular fractions from rat primary cardiac endothelial cells. Mitochondrial (Cytochrome C oxidase subunit 4, COX 4), nuclear (Histone H3, H3), and cytoplasmic (glyceraldehyde-3-phosphate dehydrogenase, GAPDH) markers were used. Three experiments were repeated independently with similar results. B Top: representative western blot illustrating NICD1 levels in whole-cell lysates and subcellular fractions from mouse primary cardiac endothelial cells and cardiomyocytes from mouse embryo hearts at E11.5 and E14.5. Bottom: Relative levels of mitochondrial NICD1 in mouse primary cardiac endothelial cells and cardiomyocytes (n = 3). Data are presented as mean values ± SD. P values were calculated by unpaired Student’s t test with two-tailed analysis without adjustments. C Representative western blot illustrating NICD1 levels in cultured human umbilical vein endothelial cell (HUVEC), human embryonic kidney 293 cells (HEK293T), MKN45 gastric cancer cells, and BxPC-3 pancreatic cancer cells. Three experiments were repeated independently with similar results. D, E Immunofluorescence confocal microscopy images showing the colocalization of NOTCH1 (green) and mitochondria (red) in HUVEC and HEK293T cells. Results are representative of three different experiments. Scale bars: 20 μm for HUVEC and 10 μm for HEK293T. F Location and sequences of putative internal signals (M1–8) in NICD1. RAM Rbp-associated molecule domain, ANKs ankyrin repeats, TAD transcription activation domain, PEST proline (P), glutamic acid (E), serine (S), threonine (T) degradation domain, NLS nuclear localization signals. G Left: representative western blot of NICD1 levels in subcellular fractions from HUVEC and HEK293T cells overexpressing FLAG-tagged wild-type NICD1 or internal signal-deleted NICD1 (ΔM1–8). Three experiments were repeated independently with similar results. Right: Ratio of NICD1 level in mitochondria to whole-cell lysate in HUVEC and HEK293T cells. Source data are provided as a Source Data file.
Fig. 2
Fig. 2. Interaction between NOTCH1 intracellular domain (NICD1) and mitochondrial pyruvate dehydrogenase E1 subunit beta (PDHB).
A Co-immunoprecipitation (CO-IP) of exogenous NICD1 and PDHB in human embryonic kidney 293T (HEK293T) cells. B, CO-IP of endogenous NICD1 and PDHB in rat cardiac endothelial cells. C Left: Schematic of truncated NICD1. RAM, Rbp-associated molecule domain; ANKs, ankyrin repeats; TAD, transcription activation domain; PEST, proline (P), glutamic acid (E), serine (S), threonine (T) degradation domain; NLS, nuclear localization signals. Right: CO-IP of exogeneous truncated NICD1 and PDHB in HEK293T cells. D Left: Schematic of recombinant proteins constructed for bimolecular fluorescence complementation (BiFC) assays: PDHB fused with N-terminus of Venus (VN-PDHB) and NICD1 fused with C-terminus of Venus (VC-NICD1) in reaction 1, NICD1 fused with VN (VN-NICD1) and PDHB fused with VC (VC-PDHB) in reaction 2, and bJun (the binding domain of Jun [the 257–318 amino acids]) fused with VN (VN-bJun) and bFos (the binding domain of Fos [the 118–210 amino acids]) fused with VC (VC-bFos) in positive control. Right: Representative western blot illustrating the expression level of recombinant proteins in HEK293T cells. EG BiFC assay exhibiting the interactions of VN-PDHB and VC-NICD1 in reaction 1(E), VC-PDHB and VN-NICD1 in reaction 2 (F), and VN-bJun and VC-bFos in positive control (G) in green dots and their intracellular distribution (Scale bar = 20 μm). Three experiments were repeated independently with similar results for AG. Source data are provided as a Source Data file.
Fig. 3
Fig. 3. Mitochondria-located NOTCH1 intracellular domain (NICD1) activation of pyruvate dehydrogenase (PDH) and mitochondrial respiration.
A Enzymatic activity of PDH, CS, and IDH in mouse cardiac ECs isolated from mice (n = 5). B Enzymatic activity of PDH, CS, and IDH in cells (n = 5). C Enzymatic activity of PDH, CS, and IDH in cells transfected with siNC or NOTCH1 siRNA (siNOTCH1) (n = 5). D Top: schematic of recombinant mitoNICD1 protein containing a presequence of cytochrome oxidase subunit 8 (COX8). Bottom: representative western blot illustrating intracellular distribution of wild-type NICD1 and mitoNICD1 (left) and quantification of mitochondrial NICD1 (n = 3) (right). E Representative immunofluorescence confocal microscopy illustrating intracellular distribution of NICD1 and mitoNICD1 (left) and the quantification of mitochondrial NICD1 (n = 3) (right) (Scale bar = 20 μm). F Representative western blot illustrating NICD1 levels (Top) and PDH activities (Bottom) in cells with different treatments (n = 5). G Relative ratio of citrate to pyruvate in wild-type (WT) cells, NOTCH1 KO cells and NOTCH1 KO cells expressing mitoNICD1 (n = 4). H Relative lactate level in WT cells, NOTCH1 KO cells and NOTCH1 KO cells expressing mitoNICD1 (n = 4). I Relative ratio of citrate to pyruvate in mouse cardiac endothelial cells isolated from wild-type and Notch1+/− mice (n = 10). J Schematic of possible fates for [U-13C]glucose. K Fraction enrichment of lactate [m+3], alanine [m+3], acetyl-CoA [m+2], and citrate [m+2] in cells expressing exogenous wild-type NICD1 or not (n = 5). L Fraction enrichment of lactate [m+3], alanine [m+3], acetyl-CoA [m+2], and citrate [m+2] in cells transfected with scramble siNC or siNOTCH1 (n = 5). M Left: profile of oxygen consumption rate (OCR) of WT cells, NOTCH1 KO cells, and NOTCH1 KO cells expressing mitoNICD1. Oligomycin (Oligo), 2-[2-[4-(trifluoromethoxy)phenyl] hydrazinylidene]-propanedinitrile (FCCP), antimycin and rotenone (Rot/AA) were supplemented at 20, 50, and 80 min during the test. Right: Quantification of basal respiration (n = 9) and maximal respiration indicated by OCR (n = 6). N ATP levels of WT cells, NOTCH1 KO cells, and NOTCH1 KO cells expressing mitoNICD1 as indicated by luminescence (n = 6). Source data are provided as a Source Data file. For AI and KN, data are presented as mean values ± SD; P values were calculated by unpaired Student’s t-test with two-tailed analysis without adjustments.
Fig. 4
Fig. 4. NOTCH1 intracellular domain (NICD1) impedes the binding of pyruvate dehydrogenase kinases (PDKs) to pyruvate dehydrogenase E1 subunit alpha 1 (PDHA1) and decreases the phosphorylation of PDHA1 (p-PDHA1).
A Representative western blot illustrating the intracellular distribution of pyruvate dehydrogenase complex (PDC) components in wild-type and NOTCH1 knockout (NOTCH1 KO) human embryonic kidney 293T (HEK293T) cells. PDHB pyruvate dehydrogenase E1 subunit beta, DLAT dihydrolipoamide S-acetyltransferase; DLD dihydrolipoyl transacetylase. B Endogenous co-immunoprecipitation (CO-IP) of NICD1 with PDC components in human umbilical vein endothelial cells (HUVEC) and HEK293T cells. C GST pull-down assay to determine in vitro binding of NICD1 to PDHA1, PDHB, DLD, and DLAT. D Representative western blot illustrating the level of each PDC component collected by endogenous immune-precipitation (IP) from wild-type HEK293T cells, NOTCH1 KO HEK293T cells, NOTCH1 KO HEK293T cells expressing exogenous NICD1, or recombinant mitochondria-targeted NICD1 (mitoNICD1). E Representative western blot illustrating the level of p-PDHA1 at serine 293 (Ser293), serine 232 (Ser232), and serine 300 (Ser300) in HUVEC cells expressing NICD1 or mitoNICD1 (left) and in HEK293T cells expressing NICD1 or mitoNICD1 (right). F Representative western blot illustrating the level of p-PDHA1 at Ser293, Ser232, and Ser300 in wild type and NOTCH1 knockdown (NOTCH1 KD) HUVEC cells (left), and wild-type and NOTCH1 KO HEK293T cells (right). G Representative western blot illustrating the affinity of PDKs, including PDK1, PDK2, PDK3, and PDK4, and pyruvate dehydrogenase phosphatases (PDPs), including PDP1 and PDP2, to endogenous PDHA1 collected by endogenous IP from HUVEC cells expressing NICD1, mitoNICD1 or not (left), and HEK293T cells expressing NICD1, mitoNICD1, or not (right). H Representative western blot illustrating the affinity of PDK1 and PDP1 to endogenous PDHA1 collected by endogenous IP from wild-type mice and Notch1 heterozygous knockout (Notch1+/−) mice. I Representative western blot illustrating the p-PDHA1 level at Ser293, Ser232, and Ser300 in mouse cardiac endothelial cells isolated from wild-type and Notch1+/− mice. Three experiments were repeated independently with similar results for AI. Source data are provided as a Source Data file Source data are provided as a Source Data file.
Fig. 5
Fig. 5. Mitochondria-targeted NOTCH1 intracellular domain (mitoNICD1)-induced pyruvate dehydrogenase (PDH) activation promotes endothelial-to-mesenchymal transition.
A Left: representative immunofluorescence confocal microscopy showing the endothelial cell marker CD31 (red) and the mesenchymal cell marker α smooth muscle actin (α-SMA) (green) in human umbilical vein endothelial cells (HUVEC) treated with cytokines (10 mg/μL transforming growth factor β [TGF-β1] and 1 ng/μL interleukin-1β [IL-1β]), expressing exogenous NOTCH1 intracellular domain (NICD1), or mitoNICD1 in low-power field (LPF) (10×) (top, scale bar=200 μm) and high-power field (HPF) (×40) (bottom, scale bar = 50 μm)). Nuclei are stained with DAPI (blue). Right: Quantification of α-SMA positive (α-SMA+) cells per LPF (n = 5 biological samples per group). B Representative western blot illustrating endothelial cell markers, including CD31, vascular endothelial cadherin (VE-Cad), and vascular endothelial growth factor receptor (VEGFR), and mesenchymal cell markers, including α-SMA, N-Cadherin (N-Cad), Vimentin, and Actin, in HUVEC expressing exogenous NICD1, mitoNICD1, or not. C Representative western blot illustrating the phosphorylation of pyruvate dehydrogenase E1 subunit alpha 1 (PDHA1) (p-PDHA1) at serine 293 (Ser293) in HUVEC treated with PDH-activator dichloroacetate (DCA) (10 mmol/L), expressing mitoNICD1, or expressing mitoNICD1 and supplemented with PDH inhibitor PS-48 (100 μmol/L) as well. D Top: profile of oxygen consumption rate (OCR) of HUVEC treated with DCA (10 mmol/L), expressing mitoNICD1, or expressing mitoNICD1 and supplemented with PS-48 (100 μmol/L) as well. Bottom: Quantification of basal respiration and maximal respiration indicated by OCR (n = 3 biological samples per group). E Left: representative immunofluorescence confocal microscopy showing CD31 (red) and α-SMA (green) in HUVEC treated with DCA (10 mmol/L), expressing mitoNICD1, or expressing mitoNICD1 and supplemented with PS-48 (100 μmol/L) as well (Scale bar=200 μm). Right: quantification of α-SMA+ cells per LPF (n = 5 biological samples per group). F Representative immunofluorescence confocal microscopy of CD31 (red) and α-SMA (green) in HUVEC treated with 5, 10, or 20 mmol/L DCA (Scale bar = 200 μm). Right: quantification of α-SMA+ cells per LPF (n = 5 biological samples per group). Source data are provided as a Source Data file. For A, DF, data are presented as mean values ± SD; P values were calculated by unpaired Student’s t test with two-tailed analysis without adjustments.
Fig. 6
Fig. 6. NOTCH1 deficiency-induced pyruvate dehydrogenase (PDH) inactivation contributes to congenital heart defect (CHD) onset in mouse and human.
A Incidence of CHD in embryos of wild-type C57/Bl6 mice (WT), Notch1+/− mice (KO), WT mice treated with low-dose homocysteine (Hcy) (0.5 g/L Hcy in drinking water orally administered to pregnant mice during E0.5 to E13.5) (WT+HCY), Notch1+/− mice treated with Hcy (KO+HCY), WT mice treated with both Hcy and dichloroacetate (DCA) (10 mmol/L) (WT+HCY+DCA), and Notch1+/− mice treated with both Hcy and DCA (KO+HCY+DCA). B PDH activity in mouse heart tissue isolated from WT, KO, WT+HCY, KO+HCY, WT+HCY+DCA, and KO+HCY+DCA mice (n = 5). C Schematic of NOTCH1 protein showing the location of 15 missense mutations identified in 300 tetralogy of Fallot (TOF) patients. EGF epidermal growth factor, LNR Lin-12/Notch repeats, HD-N N-terminus of heterodimerization, HD-C C-terminus of heterodimerization, TM transmembrane domain, RAM Rbp-associated molecule domain, ANKs ankyrin repeats, TAD transcription activation domain, PEST proline, glutamic acid, serine, threonine degradation domain, NLS nuclear localization signals. D Representative western blot illustrating the level of exogenously expressed wild-type NICD1 and NICD1 mutants G1814R, A2077P, R2263Q, V2285I, and I2456V, in cytoplasm or mitochondria of human umbilical vein endothelial cells (HUVEC). Cytochrome C oxidase subunit 4 (COX 4) and glyceraldehyde-3-phosphate dehydrogenase (GAPDH) were adopted as markers of mitochondria and cytoplasm fractions, respectively (n = 3). E Co-immunoprecipitation (CO-IP) of exogenous pyruvate dehydrogenase E1 subunit beta (PDHB) and G1814R, A2077P, R2263Q, V2285I, and I2456V mutants, in HUVEC (left) and human embryonic kidney 293T (HEK293T) (right) cells (n = 3). F Representative western blot illustrating the phosphorylation level of pyruvate dehydrogenase E1 subunit alpha 1 (p-PDHA1) at serine 293 (Ser293), serine 232 (Ser232), and serine 300 (Ser300) in wild-type and NOTCH1 knockout (NOTCH1 KO) HEK293T cells (left) and in wild type and NOTCH1 knockdown (NOTCH1 KD) HUVEC (right) expressing exogenous wild-type NICD1 or NICD1 mutants (n = 3). G PDH activity detected in wild-type and NOTCH1 KO HEK293T cells (left) and in wild-type and NOTCH1 KD HUVEC (right) expressing exogenous wild-type NICD1 or NICD1 mutants (n = 5). H Relative PDH activity detected in heart tissue isolated from mouse and TOF patients carrying NOTCH1 mutations or not (WT1, WT2, WT3, and WT4) (n = 3). For B, D, E, G, data are presented as mean values ± SD; P values were calculated by unpaired Student’s t test with two-tailed analysis without adjustments.

References

    1. McKellar, S. H. et al. Novel NOTCH1 mutations in patients with bicuspid aortic valve disease and thoracic aortic aneurysms. J. Thorac. Cardiovasc Surg.134, 290–296 (2007). - PubMed
    1. Garg, V. et al. Mutations in NOTCH1 cause aortic valve disease. Nature437, 270–274 (2005). - PubMed
    1. Page, D. J. et al. Whole exome sequencing reveals the major genetic contributors to nonsyndromic tetralogy of fallot. Circ. Res.124, 553–563 (2019). - PMC - PubMed
    1. Andersson, E. R., Sandberg, R. & Lendahl, U. Notch signaling: simplicity in design, versatility in function. Development138, 3593–3612 (2011). - PubMed
    1. D’Amato, G. et al. Sequential Notch activation regulates ventricular chamber development. Nat. Cell Biol.18, 7–20 (2016). - PMC - PubMed

Publication types

LinkOut - more resources