. 2024 Nov 16;15(1):9944.
doi: 10.1038/s41467-024-54345-4.

Defective kinase activity of IKKα leads to combined immunodeficiency and disruption of immune tolerance in humans

Affiliations

Defective kinase activity of IKKα leads to combined immunodeficiency and disruption of immune tolerance in humans

Gökhan Cildir et al. Nat Commun. .

Abstract

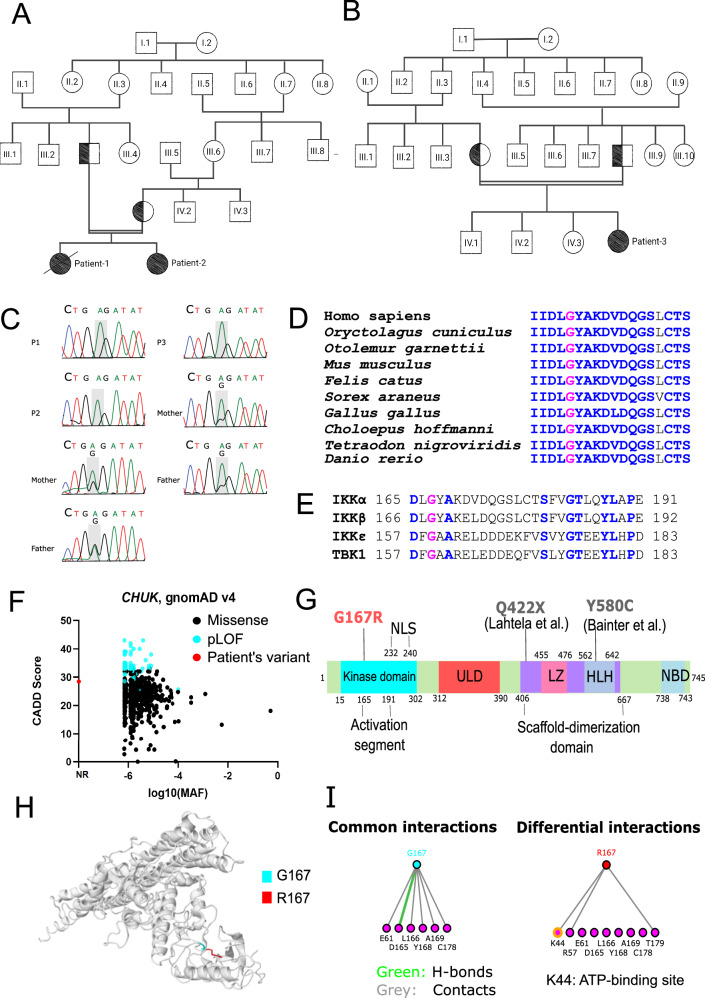
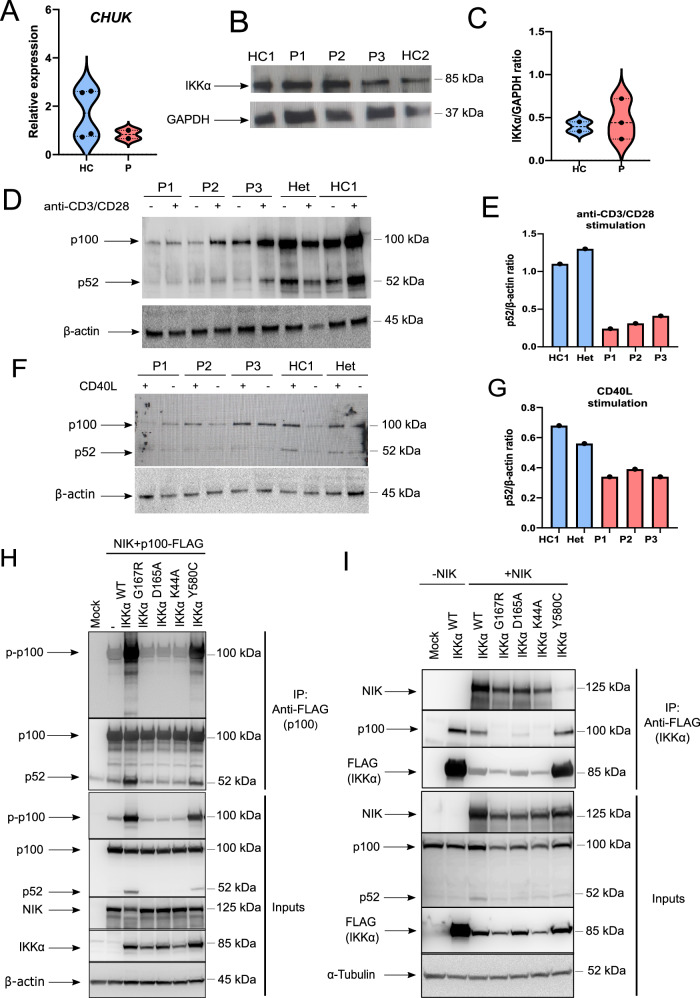
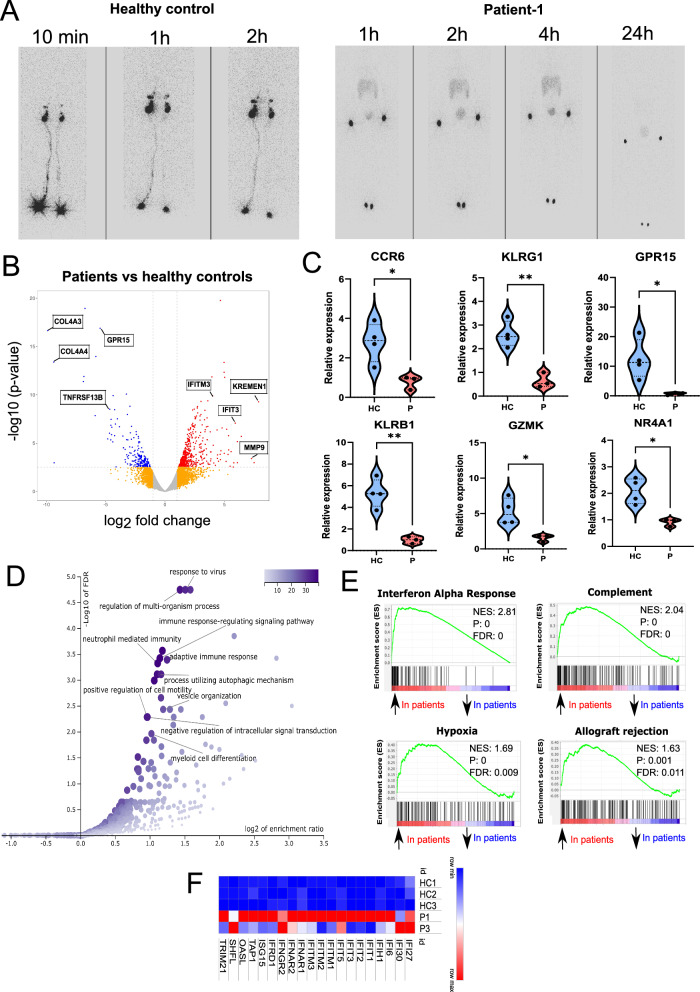
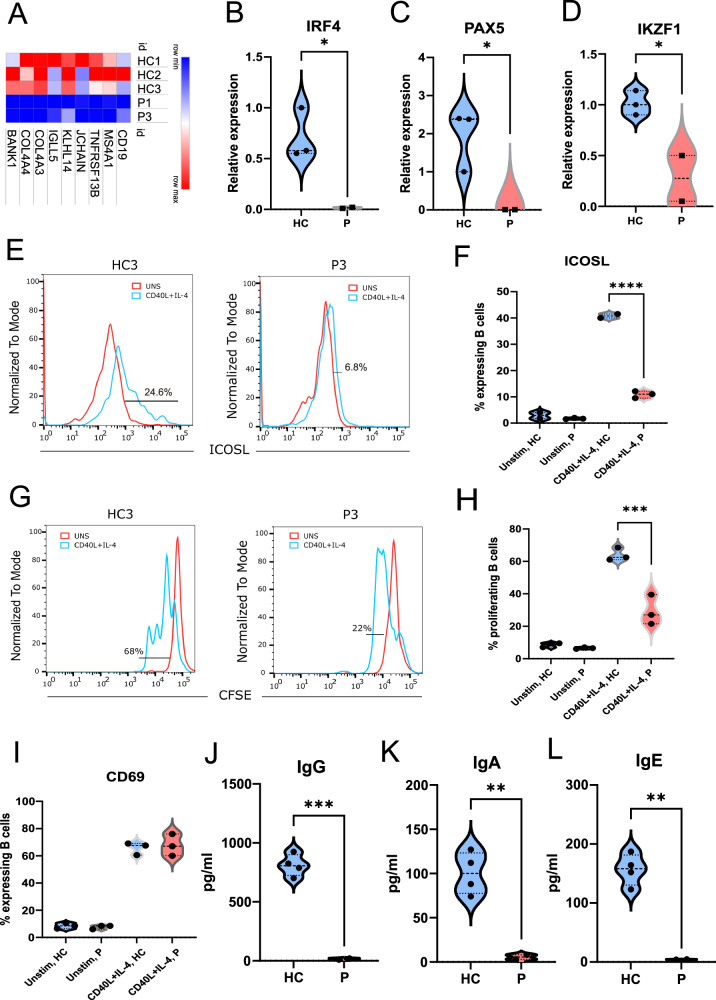
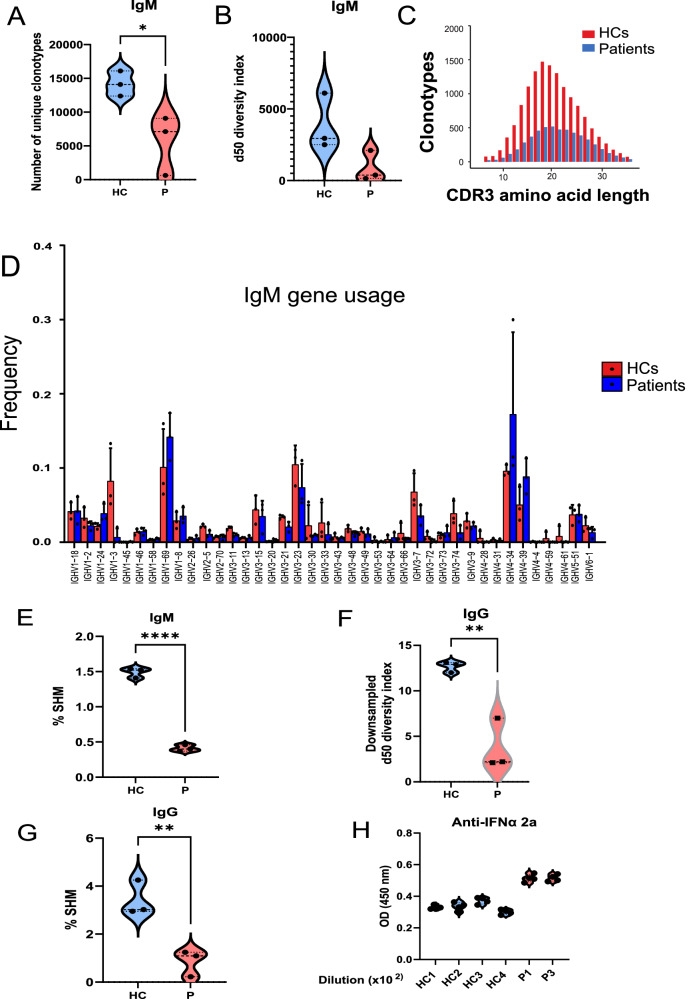
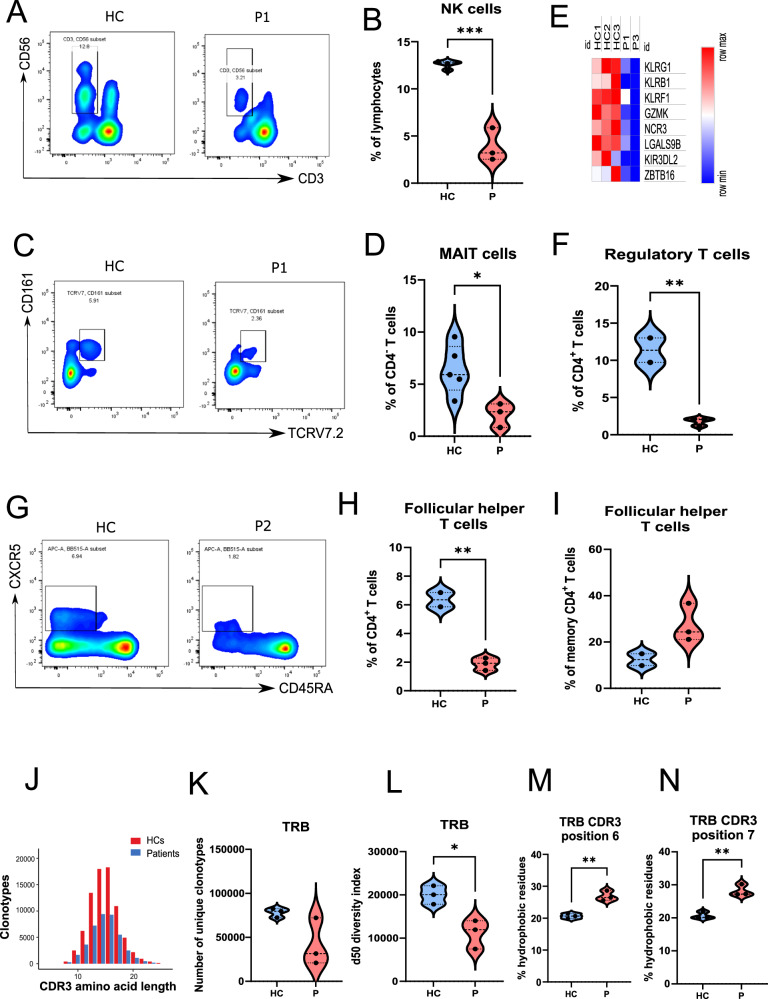
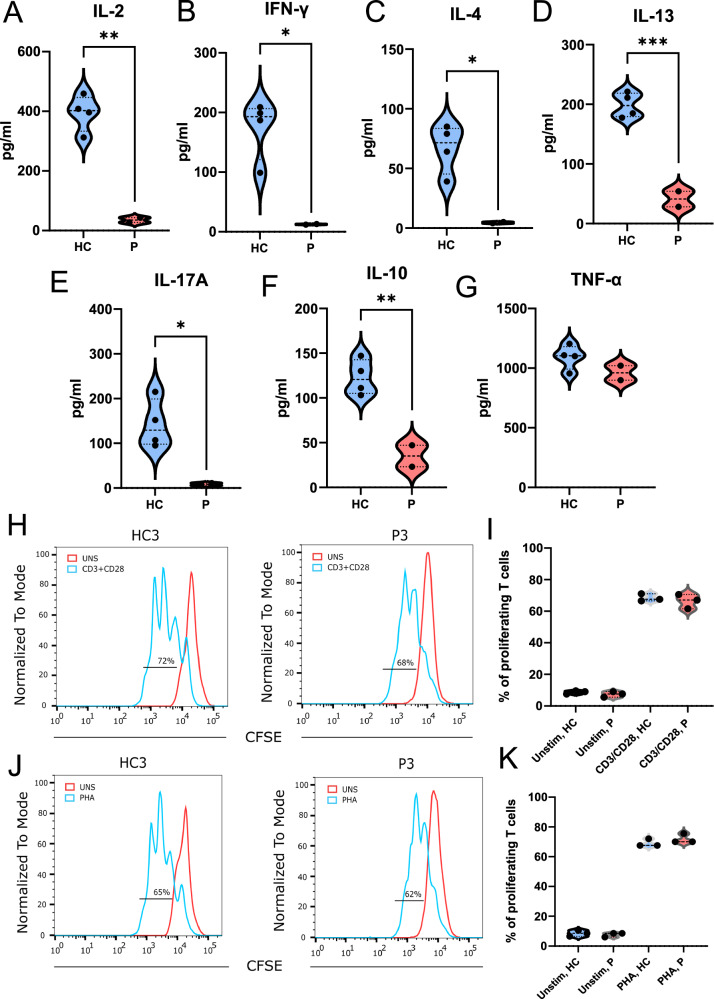
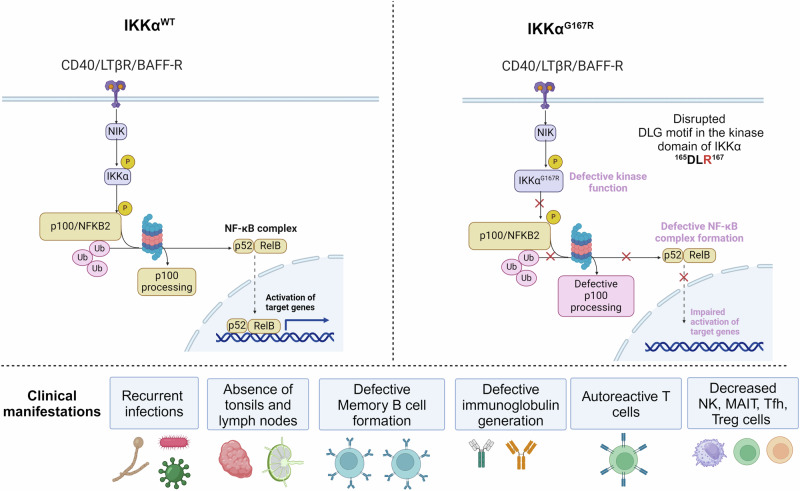
IKKα is a multifunctional serine/threonine kinase that controls various biological processes, either dependent on or independent of its kinase activity. However, the importance of the kinase function of IKKα in human physiology remains unknown since no biallelic variants disrupting its kinase activity have been reported. In this study, we present a homozygous germline missense variant in the kinase domain of IKKα, which is present in three children from two Turkish families. This variant, referred to as IKKαG167R, is in the activation segment of the kinase domain and affects the conserved (DF/LG) motif responsible for coordinating magnesium atoms for ATP binding. As a result, IKKαG167R abolishes the kinase activity of IKKα, leading to impaired activation of the non-canonical NF-κB pathway. Patients carrying IKKαG167R exhibit a range of immune system abnormalities, including the absence of secondary lymphoid organs, hypogammaglobulinemia and limited diversity of T and B cell receptors with evidence of autoreactivity. Overall, our findings indicate that, unlike a nonsense IKKα variant that results in early embryonic lethality in humans, the deficiency of IKKα's kinase activity is compatible with human life. However, it significantly disrupts the homeostasis of the immune system, underscoring the essential and non-redundant kinase function of IKKα in humans.


Conflict of interest statement

Competing interests The authors declare no competing interests.

Figures

Fig. 1
Fig. 1. Identification of IKKαG167R homozygous germline missense variant in three patients.
A, B Family pedigree of P1, P2 and P3 showing the consanguineous marriage. All parents of patients are heterozygous for this variant and germline transmission is responsible for the homozygosity. Patient-1 is deceased as indicated by the black diagonal line. Double horizontal lines in pedigree indicate consanguinity. C Sanger sequencing results of patients and their parents, showing the nucleotide change 499 G > A in the component of inhibitor of nuclear factor kappa B kinase complex (CHUK) gene coding for IKKα. D Evolutionary conservation of G167 residue in IKKα of different species is shown based on the multiple sequence alignment. G167 is indicated by pink, conserved residues are indicated by blue and non-conserved residues are indicated by black. E G167 residue in IKKα (indicated by pink) is conserved in the kinase domain of other IKK and IKK-related kinases (IKKβ, IKKε and TANK binding kinase 1 (TBK1)). Other conserved residues are indicated by blue and non-conserved residues are indicated by black. F CADD vs MAF plot of patient’s variant together with all missense and predicted loss-of-function (pLOF) CHUK gene variants (797 variants in total) obtained from the Genome Aggregation Database (gnomAD) v4 datasets. NR: Not reported. G Different domains and previously reported homozygous variants in human IKKα. Kinase domain, ULD: ubiquitin-like domain, LZ: Leucine zipper, HLH: Helix-Loop-Helix, NBD: NEMO-binding domain, NLS: Nuclear localization signal. Q422X and Y580C variants were previously reported in other studies. H The impact of IKKαG167R on previously reported structure of IKKαWT (PDB: 5EBZ) was indicated using Missense3D tool. G167 is indicated by blue and R167 is by red. I The effect of IKKαG167R variant on interactions of different residues was investigated using I see in 3D (iCn3D) Structure Viewer (PDB: 5EBZ). Common and different interactions between IKKαWT and IKKαG167R were indicated. A notable differential interaction between residue G167 and ATP-binding site K44 (yellow in colour) was indicated. Green colour indicates H-bonds and grey colour indicates contacts with residues.
Fig. 2
Fig. 2. Testing non-canonical NF-κB pathway activation in patient cells and genome-edited HEK293T cells.
A Transcript levels of CHUK in PBMCs were quantified with qRT-PCR. Glyceraldehyde 3-phosphate dehydrogenase (GAPDH) levels were used as a normalisation control (n = 4 healthy controls and 2 patients. Two-tailed, non-paired t-test was used for statistical analysis). B Protein levels of IKKα in PBMCs of healthy controls and patients, as determined by western blotting. GAPDH was used as a loading control. Data are representative of three independent experiments. C Quantification of protein levels of IKKα as determined by IKKα/GAPDH ratio in quantitative analysis of band intensities (n = 2 healthy controls and 3 patients. Two-tailed, non-paired t-test was used for statistical analysis). D PBMCs were stimulated with anti-CD3 and anti-CD28 antibodies for 2 days and immunoblotting was performed to analyse p100 to p52 conversion (n = 3 patients and 2 healthy controls. β-Actin was used as a loading control). E Ratio of p52 to β-actin in healthy controls and patient samples, as determined by quantitative image analysis of band intensities (in stimulated conditions) in western blotting in (D). F PBMCs were stimulated with recombinant CD40L (200 ng/ml) and IL-4 (100 ng/ml) for 18 h and p100 to p52 conversion was analysed with immunoblotting (n = 3 patients and 2 healthy controls. β-actin was used as a loading control). G Ratio of p52 to β-actin in healthy controls and patient samples, as determined by quantitative image analysis of band intensities (in stimulated conditions) in western blotting in (F). H Phosphorylation of p100 at Ser 866 and 870 was assessed by co-immunoprecipitation of p100-FLAG with anti-FLAG antibodies and immunoblotting in IKKα KO-HEK293T cells reconstituted with different mutants. Data are representative of four independent experiments. I The interaction between different IKKα mutants and p100 and NIK was investigated using co-immunoprecipitation of IKKα-FLAG with anti-FLAG antibodies in HEK293T cells. Data are representative of three independent experiments.
Fig. 3
Fig. 3. Defective SLO and peripheral B cell development in IKKαG167R patients.
A Lymphoscintigraphy analysis in a healthy paediatric control and P1 showing the absence of lymphatic flow and therefore lymph nodes in the patient. Images were taken 10 min, 1-, 2-, 4- and 24 h post injection of radiotracer. B Volcano plot analysis of differentially expressed genes (DEGs) in healthy controls (n = 3) vs IKKαG167R patients (P1 and P3). Differential gene expression analysis was conducted using the likelihood ratio test within the edgeR package, which is based on a negative binomial distribution model. P-values were adjusted for multiple testing using the Benjamini-Hochberg procedure. Genes with FDR-adjusted p-values less than 0.05 were considered statistically significant. C qRT-PCR analysis of C-C motif chemokine receptor 6 (CCR6) (p = 0.0212), killer cell lectin like receptor G1 (KLRG1) (p = 0.0027), G protein-coupled receptor 15 (GPR15) (p = 0.0322), killer cell lectin like receptor B1 (KLRB1) (p = 0.0028), granzyme K (GZMK) (p = 0.0215), and nuclear receptor subfamily 4 group A member 1 (NR4A1) (p = 0.0105) transcripts. GAPDH levels were used as a normalisation control (n = 4 healthy controls and n = 3 patients, two-tailed, non-paired t-test was used for statistical analysis). D Over representation analysis (ORA) of DEGs, as performed by WebGestalt, showing biological processes significantly associated with DEGs. E Selected hits of Gene Set Enrichment Analysis (GSEA) of DEGs. Weighted Kolmogorov–Smirnov test was used for statistical analysis. F Heatmap analysis of DEGs involved in interferon response based on normalized CPM values in RNA-seq analysis.
Fig. 4
Fig. 4. Defective SLO and memory B cell development in IKKαG167R patients.
A Heatmap analysis of DEGs involved in B cell function based on normalized CPM values in RNA-seq analysis. BD Differential expression of interferon regulatory factor 4 (IRF4) (p = 0.0342), paired box 5 (PAX5) (p = 0.0489), IKAROS family zinc finger 1 (IKZF1) (p = 0.0303) in purified B cells using qRT-PCR. GAPDH levels were used as a normalisation control (n = 3 healthy controls and 2 patients, two-tailed, non-paired t-test was used for statistical analysis). E, F Flow cytometric analysis of the cell surface expression of inducible T cell costimulator ligand (ICOSL) in B cells. Patient and healthy control PBMCs were either unstimulated or stimulated with recombinant CD40L and IL-4 in vitro. One-way ANOVA was used for statistical analysis, p < 0.0001. G, H Proliferation analysis of B cells from healthy controls (n = 3) and patients (n = 3). Carboxyfluorescein succinimidyl ester (CFSE) staining in flow cytometry was used for proliferation analysis. One-way ANOVA was used for statistical analysis, p < 0.0001. I Flow cytometric analysis of the cell surface expression of CD69 in B cells. Patient and healthy control PBMCs were either unstimulated or stimulated with recombinant CD40L and IL-4 in vitro. One-way ANOVA was used for statistical analysis. JL In vitro class switching of naïve B cells isolated from the PBMCs of patients (n = 2) and healthy controls (n = 4) upon in vitro stimulation with recombinant CD40L and IL-4 for 7 days. IgG (p = 0.0003), IgA (p = 0.0061) and IgE (p = 0.0016) levels in culture supernatant were measured with multiplexed bead-based assay. Two-tailed, non-paired t-test was used for statistical analysis.
Fig. 5
Fig. 5. BCR gene usage analysis in patients and healthy controls.
AC Number of unique clonotypes, d50 diversity index (number of clonotypes occupying 50% of the repertoires), and complementarity-determining region 3 (CDR3) amino acid length of the BCR IgM (B cell receptor μ heavy chain) repertoire in healthy controls (n = 3) and patients (n = 3). Although the d50 diversity index did not reach statistical significance, possibly due to the sample size, there was a trend of limited BCR IgM diversity (p = 0.08). D BCR IgM (B cell receptor μ heavy chain) gene usage comparison between patients and healthy controls. Red bars indicate healthy controls (n = 3), and blue bars indicate IKKαG167R patients (n = 3). Two-tailed, non-paired t-test was used for statistical analysis. Data are presented as mean values and SD. E Somatic hypermutation (SHM) rate was calculated in rearranged variable regions of the IgM heavy chain (IGHV) genes and given as the percentage of insertions and/or deletions in total number of sequences in patients and healthy controls. Two-tailed, non-paired t-test was used for statistical analysis, p < 0.0001. F Downsampled d50 diversity index (number of clonotypes occupying the 50% of repertoires) and complementary-determining region 3 (CDR3) amino acid length of BCR IgG (B cell receptor γ heavy chain) repertoire of healthy controls and patients. Normalization was performed by downsampling the data to the smallest number of clones. Two-tailed, non-paired t-test was used for statistical analysis, p = 0.0057. G Somatic hypermutation (SHM) rate was calculated in rearranged variable regions of the IgG heavy chain (IGHV) genes and given as the percentage of insertions and/or deletions in total number of sequences in patients and healthy controls. Two-tailed, non-paired t-test was used for statistical analysis, p = 0.0084. H Auto-antibodies against interferon alfa (IFNα) 2a were tested by enzyme-linked immunosorbent assay (ELISA) using plasma samples from 4 healthy controls and 2 patients (P1 and P3). OD measurements at 450 nm were shown from 1/100 diluted plasma samples.
Fig. 6
Fig. 6. Analyses of NK, MAIT, Treg, and Tfh cell populations and TCR repertoire in IKKαG167R patients compared to the healthy controls.
A Representative flow cytometric analysis of natural killer (NK) cells (CD3-CD56+) in a healthy control and patient-1 PBMCs. B Graphical representation of NK cells (CD3-CD56+) in healthy controls (n = 4) and patients (n = 3). Two-tailed, non-paired t-test was used for statistical analysis, p = 0.0002. C Flow cytometric analysis of Mucosal Associated Invariant T (MAIT) cells (CD3+CD4- CD161+TCRV7.2+) in a healthy control and patient-1 PBMCs. D Graphical representation of MAIT cells (CD3+CD4- CD161+TCRV7.2+) in healthy controls (n = 5) and patients (n = 3). Two-tailed, non-paired t-test was used for statistical analysis, p = 0.0266. E Heatmap analysis of selected MAIT and NK cell associated genes in healthy controls (n = 3) and patients (n = 2), based on normalized CPM values in RNA-seq analysis. F Graphical representation of Tregs (CD3+ CD4+ CD25+ FoxP3+) in healthy controls (n = 2) and patients (n = 3). Two-tailed, non-paired t-test was used for statistical analysis, p = 0.0050. G Flow cytometric analysis of follicular helper T (Tfh) cells (CD3+CD4+CD45RA-CXCR5+) in a healthy control and patient-2 PBMCs. H Graphical representation of Tfh cells as a percentage of total CD4+ T cells in healthy controls (n = 2) and patients (n = 3). A two-tailed, unpaired t-test was used for statistical analysis, p = 0.0028. I Graphical representation of Tfh cells as a percentage of memory CD4+ T cells in healthy controls (n = 2) and patients (n = 3). A two-tailed, unpaired t-test was used for statistical analysis. JL CDR3 amino acid length, number of unique clonotypes and d50 diversity index (number of clonotypes occupying the 50% of repertoires) of TRB (T cell receptor beta chain) repertoire of healthy controls (n = 3) and patients (n = 3). Two-tailed, non-paired t-test was used for statistical analysis, p = 0.0179 (d50 diversity index). M, N Hydrophobicity of the amino acids in positions 6 and 7 in TRB CDR3 region of healthy controls (n = 3) and patients (n = 3). Two-tailed, non-paired t-test was used for statistical analysis, p = 0.0034 (position 6) and p = 0.0032 (position 7).
Fig. 7
Fig. 7. Naïve CD4+ T cell activation and cytokine release in patient cells and healthy controls.
AG Analysis of the cytokine release from purified naïve CD4+ T cells 72 h post stimulation with anti-CD3 and anti-CD28 antibodies. Soluble IL-2 (p = 0.0015), IFN-γ (p = 0.0131), IL-4 (p = 0.0155), IL-13 (p = 0.0008), IL-17A (p = 0.0305), IL-10 (p = 0.0060) and TNF-α (p = 0.1966) (n = 2 patients vs n = 4 healthy controls) levels were measured with multiplexed bead-based assay. Two-tailed, non-paired t-test was used for statistical analysis. H, I Proliferation analysis of T cells from healthy controls (n = 3) and patients (n = 3) from PBMCs 48 h post stimulation with anti-CD3/CD28. CFSE staining in flow cytometry was used for proliferation analysis. One-way ANOVA was used for statistical analysis. J, K Proliferation analysis of T cells from PBMCs 48 h post stimulation with PHA, healthy controls (n = 3) and patients (n = 3). CFSE staining in flow cytometry was used for proliferation analysis. One-way ANOVA was used for statistical analysis.
Fig. 8
Fig. 8. Figure summarizing the molecular mechanisms of IKKαG167R and its clinical manifestations in patients.
Created in BioRender. Tumes, D. (2024) BioRender.com/k75q726.

References

    1. Cildir, G., Low, K. C. & Tergaonkar, V. Noncanonical NF-kappaB Signaling in Health and Disease. Trends Mol. Med.22, 414–429 (2016). - PubMed
    1. Israel, A. The IKK complex, a central regulator of NF-kappaB activation. Cold Spring Harb. Perspect. Biol.2, a000158 (2010). - PMC - PubMed
    1. Kinoshita, D. et al. Essential role of IkappaB kinase alpha in thymic organogenesis required for the establishment of self-tolerance. J. Immunol.176, 3995–4002 (2006). - PubMed
    1. Onder, L. et al. Alternative NF-kappaB signaling regulates mTEC differentiation from podoplanin-expressing precursors in the cortico-medullary junction. Eur. J. Immunol.45, 2218–2231 (2015). - PubMed
    1. Baik, S., Sekai, M., Hamazaki, Y., Jenkinson, W. E. & Anderson, G. Relb acts downstream of medullary thymic epithelial stem cells and is essential for the emergence of RANK(+) medullary epithelial progenitors. Eur. J. Immunol.46, 857–862 (2016). - PMC - PubMed

Publication types

Associated data

LinkOut - more resources