. 2024 Nov 16;15(1):9940.
doi: 10.1038/s41467-024-54294-y.

Autoinflammatory patients with Golgi-trapped CDC42 exhibit intracellular trafficking defects leading to STING hyperactivation and ER stress

Affiliations

Autoinflammatory patients with Golgi-trapped CDC42 exhibit intracellular trafficking defects leading to STING hyperactivation and ER stress

Alberto Iannuzzo et al. Nat Commun. .

Abstract

Most autoinflammatory diseases are caused by mutations in innate immunity genes. Previously, four variants in the RHO GTPase CDC42 were discovered in patients affected by syndromes generally characterized by neonatal-onset of cytopenia and auto-inflammation, including hemophagocytic lymphohistiocytosis and rash in the most severe form (NOCARH syndrome). However, the mechanisms responsible for these phenotypes remain largely elusive. Here, we show that the recurrent p.R186C CDC42 variant, which is trapped in the Golgi apparatus, elicits a block in both anterograde and retrograde transports. Consequently, it favours STING accumulation in the Golgi in a COPI-dependent manner. This is also observed for the other Golgi-trapped p.*192 C*24 CDC42 variant, but not for the p.Y64C and p.C188Y variants that do not accumulate in the Golgi. We demonstrate that the two Golgi-trapped CDC42 variants are the only ones that exhibit overactivation of the STING pathway and the type I interferon response, and elicit endoplasmic reticulum stress. Consistent with these results, patients carrying Golgi-trapped CDC42 mutants present very high levels of circulating IFNα at the onset of their disease. In conclusion, we report further mechanistic insights on the impact of the Golgi-trapped CDC42 variants. This increase in STING activation provides a rationale for combination treatments for these severe cases.


Conflict of interest statement

Competing interests The authors declare no competing interests.

Figures

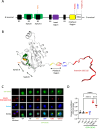
Fig. 1
Fig. 1. Localization of CDC42 variants identified in patients.
A Organization of CDC42 domains and indication of the positions of the pathogenic variants under study. B Three-dimensional structure of CDC42 showing the CDC42 mutations of amino acids Y64, R186 and C188, and the insertion of the 24 amino acids at the C terminus highlighted in orange, red, blue, and dark red, respectively. The switch regions are indicated by black arrows and green colour, and the polybasic region is represented in yellow. C Subcellular localization of GFP-CDC42 variants in THP-1 cells co-stained for the Golgi and nucleus. Scale bars: 10 µm. D Quantification of the degree of Golgi—CDC42 co-localization for different variants using the Pearson’s Coefficient. One dot represents the mean value from about 15 cells from one independent experiment. Results are shown as means +/- SEM of four biological replicates (n = 4) and the significance levels were calculated using ordinary one-way ANOVA (***P = 0.0003; ****P < 0.0001). Source data are provided as a Source Data file.
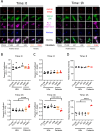
Fig. 2
Fig. 2. Impact of CDC42 variants on anterograde transport.
A Immunofluorescence analyses of PC-1, ER, Golgi and nucleus localizations in 4 different healthy donor (HDs) fibroblasts, patients Y64C and R186C at 0 and 1 h. Images are representative of at least 3 independent experiments. Scale bars: 10 µm. Quantifications of the colocalizations between PC-1 and the ER (B) or the Golgi (C) at the indicated times for each cell type. D Analysis of total PC-1 fluorescence intensity following anterograde transport. The relative intensity of PC-1 expression was normalized to 100 from the mean values of the 4 HDs at time 0. In all graphs, one dot represents the mean value from about 15 cells from one independent experiment. Results are shown as means +/- SEM of at least three biological replicates and the significance levels were calculated using ordinary one-way ANOVA (***P = 0.0006, ****P < 0.0001). Source data are provided as a Source Data file.
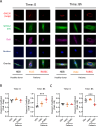
Fig. 3
Fig. 3. Impact of CDC42 variants on retrograde transport.
A Immunofluorescence analyses of retrograde transport assay of Cholera toxin B subunit (CtxB) in fibroblasts from the HD8 healthy donor and from the Y64C and R186C CDC42 patients at times 0 and 8 h. Co-stainings for Golgi, ER and nuclei were performed. Images are representative of at least 3 independent experiments. Scale bars: 10 µm. Quantifications of microscopy images are shown for the CtxB—Golgi (B) and CtxB—ER (C) colocalizations at the indicated times. Transport assay data from 4 healthy donors were pooled. In all graphs, one dot represents the mean value from about 15 cells from one independent experiment. Results are shown as means +/- SEM of at least three biological replicates and the significance levels were calculated using ordinary one-way ANOVA (***P < 0.007). Source data are provided as a Source Data file.
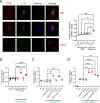
Fig. 4
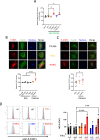
Fig. 4. Impact of CDC42 variants on ER stress.
A Immunofluorescence analyses of ER stress in fibroblasts from the HD16 healthy donor and from the Y64C and R186C CDC42 patients. Left: co-stainings for BiP, F-actin and nuclei are shown. Images are representative of 3 independent experiments. Scale bars: 10 µm. Right: quantification of microscopy images. One dot represents the mean value from about 15 cells from one independent experiment. Results are shown as means +/- SEM of three biological replicates and the significance levels were calculated using ordinary one-way ANOVA (*: P = 0.0358). B Western blot analysis of BiP and CDC42 expression in HD8, Y64C and R186C fibroblasts treated with DMSO (vehicle, -) or thapsigargin (+). GAPDH is shown as a loading control. The Molecular Weights (kDa) are indicated. C, Flow cytometry analyses of BiP expression in THP-1 cells expressing WT or mutant CDC42. Left: examples of BiP expression FACS profiles in cells treated with DMSO (vehicle; turquoise) or thapsigargin (red). Right: quantifications of the BiP Mean Fluorescence Intensity (MFI) in cells treated with DMSO (-) or thapsigargin (+). One dot represents the MFI from one independent experiment. Results are shown as means +/-  SEM from three biological replicates and the significance levels were calculated using two-way ANOVA (*P < 0.0359). D Expression levels of HSPA5 (left) and ATF4 (right) mRNA in healthy donors (HDs) or CDC42 patients’ fibroblasts treated with DMSO (-) or thapsigargin (+). E Expression levels of HSPA5 (left), ATF4 (center), and DDIT3 (right) mRNA in THP-1 cells expressing WT or variants CDC42 upon DMSO (-) or thapsigargin (+) treatment. NI: non infected. For panels D and E, each dot represents the mean value of three technical replicates from one independent experiment. Results are shown as means +/- SEM from at least three biological replicates and the significance levels were calculated using ordinary one-way ANOVA (*P < 0.0328; **P < 0.0081; ***P < 0.0004; ****P < 0.0001). Source data are provided as a Source Data file.
Fig. 5
Fig. 5. Golgi-trapped CDC42 variants induce STING accumulation in the Golgi in a COPI-dependent manner.
A Left: Subcellular stainings of STING, Golgi and nuclei in control and patients’ fibroblasts. Scale bars: 10 µm. Right: Quantification of the degree of STING—Golgi co-localization in each condition. B Measurement of STING—Golgi co-localization in THP-1 cells expressing different forms of CDC42. Quantifications of the degrees of STING—Golgi (C) or CDC42—Golgi (D) co-localizations in THP-1 cells expressing different mutants of CDC42, including some with the K183S/K184S double mutation which inhibits COPI binding. NT: non transfected. In all the graphs, each dot represents the mean value from about 15 cells from one independent experiment. Results are shown as means +/- SEM from at least three biological replicates and the significance levels were calculated using ordinary one-way ANOVA (*P < 0.0192; **P < 0.0098; ***P < 0.0006; ****P < 0,0001). Source data are provided as a Source Data file.
Fig. 6
Fig. 6. Golgi-trapped CDC42 variants induce STING pathway activation.
A Measurement of P-IRF3 intensity in the nuclei of THP-1 cells expressing GFP-CDC42 variants. Immunocytochemistry stainings and quantifications of P-IRF3 (B) and P-STAT1 (C) intensities in healthy donors (HDs) or CDC42 patients’ fibroblasts. Scale bars: 10 µm. In all graphs, one dot represents the mean value of fluorescence intensities from about 15 cells from one independent experiment. D Flow cytometry analyses of P-STAT1 expression in THP-1 cells expressing WT or mutant CDC42. Left: examples of P-STAT1 expression profiles in cells non stimulated (turquoise) or stimulated with IFNα (red). Right: quantifications of the P-STAT1 Mean Fluorescence Intensity (MFI) in cells upon IFNα stimulation. Each dot represents the MFI from one independent experiment. For all graphs, results are shown as means +/- SEM of at least three biological replicates and the significance levels were calculated using ordinary one-way ANOVA (*P < 0.0424; **P < 0.0086; ***P = 0.0004; ****P < 0.0001). Source data are provided as a Source Data file.
Fig. 7
Fig. 7. Golgi-trapped CDC42 variants are associated with high IFNα levels in the blood.
Quantification of IFNα in sera or plasma from R186C (P1-4) and *192 C*24 (P5-6) CDC42 patients at the onset of the disease or after different treatments: P1 → 1: probable virosis (ongoing glucocorticoids and anakinra), 2: infection by adenovirus and rhinovirus (ongoing glucocorticoids, anakinra and cyclosporine), 3: ongoing cyclosporine, glucocorticoids and anakinra, 4: bone marrow transplantation. P2 → 1: high dose of glucocorticoids and anakinra. P3 → Onset: improved state. 1: Re-inflammatory state, anti-TNF treatment. P4 → 1: anakinra, 2: glucocorticoids and canakinumab. P5 → 1: anakinra, 2: high dose of anakinra. P6 → 1 and 2: corticosteroids and intravenous Ig (Immunoglobulin response therapy). Each dot represents the mean value of three technical replicates from one independent experiment. HDs measurements were performed in three or four biological replicates and the results are shown as means +/- SEM. Source data are provided as a Source Data file.
Fig. 8
Fig. 8. Golgi-trapped CDC42 variants induce increased Interferon signature gene expression in a STING-dependent way.
IFN scores (ISG: IFI27, IFI44L, IFIT1, ISG15, RSAD2 and SIGLEC1) from 4 independent experiments were quantified in patients’ fibroblasts (A), THP-1 (B, C), THP-1 cGAS KO (D) and THP-1 STING KO (E) cells expressing different CDC42 mutants. Panels B and C are partly duplicated. NI: non-infected. For each gene, an expression mean value was obtained from three technical replicates. An IFN score was then obtained from the median values for the 6 ISG and corresponds to one dot from one independent experiment. Results are shown as means +/- SEM from four biological replicates and the significance levels were calculated using ordinary one-way ANOVA (*P < 0.0295; **P < 0.0080; ***P < 0.0003). Source data are provided as a Source Data file.

References

    1. Georgin-Lavialle, S. et al. Systemic autoinflammatory diseases: clinical state of the art. Best. Pract. Res. Clin. Rheumatol.34, 101529 (2020). - PubMed
    1. Aksentijevich, I. & Schnappauf, O. Molecular mechanisms of phenotypic variability in monogenic autoinflammatory diseases. Nat. Rev. Rheumatol.17, 405–425 (2021). - PubMed
    1. Alehashemi, S. & Goldbach-Mansky, R. Human autoinflammatory diseases mediated by NLRP3-, Pyrin-, NLRP1-, and NLRC4-inflammasome dysregulation updates on diagnosis, treatment, and the respective roles of IL-1 and IL-18. Front. Immunol.11, 1840 (2020). - PMC - PubMed
    1. El Masri, R. & Delon, J. RHO GTPases: from new partners to complex immune syndromes. Nat. Rev. Immunol.21, 499–513 (2021). - PubMed
    1. Lam, M. T. et al. A novel disorder involving dyshematopoiesis, inflammation, and HLH due to aberrant CDC42 function. J. Exp. Med.216, 2778–2799 (2019). - PMC - PubMed

Publication types