. 2024 Nov 16;15(1):9949.
doi: 10.1038/s41467-024-54364-1.

Single cell and spatial transcriptomics highlight the interaction of club-like cells with immunosuppressive myeloid cells in prostate cancer

Affiliations

Single cell and spatial transcriptomics highlight the interaction of club-like cells with immunosuppressive myeloid cells in prostate cancer

Antti Kiviaho et al. Nat Commun. .

Abstract

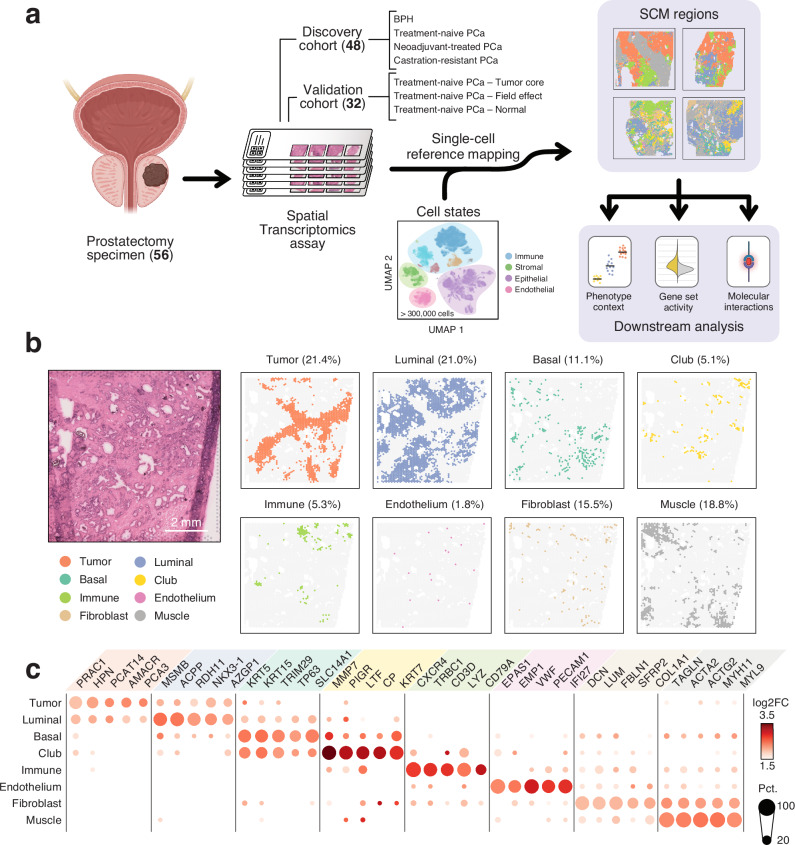
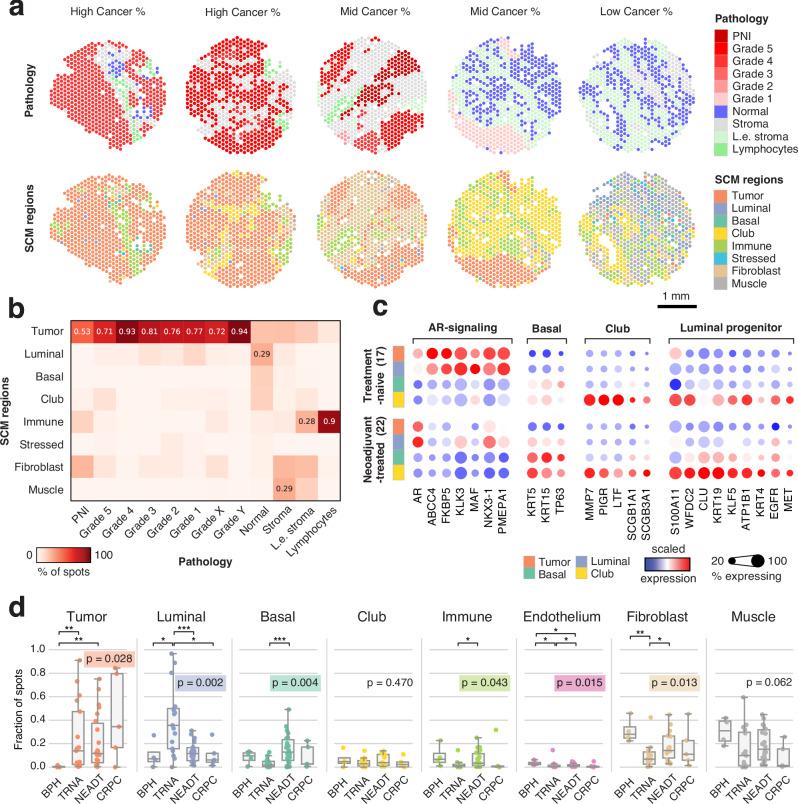
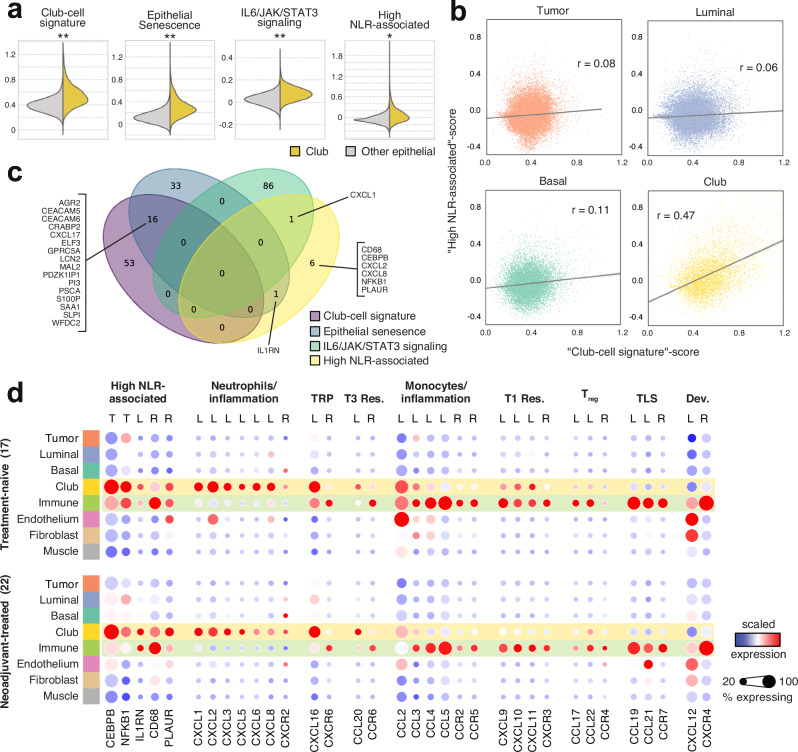
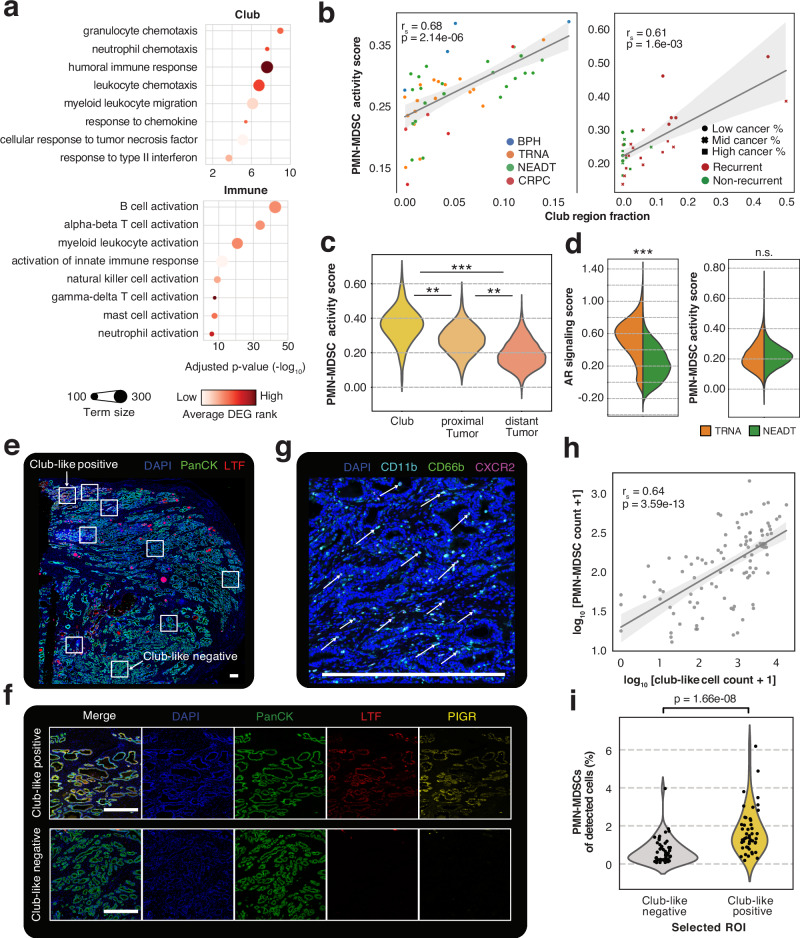
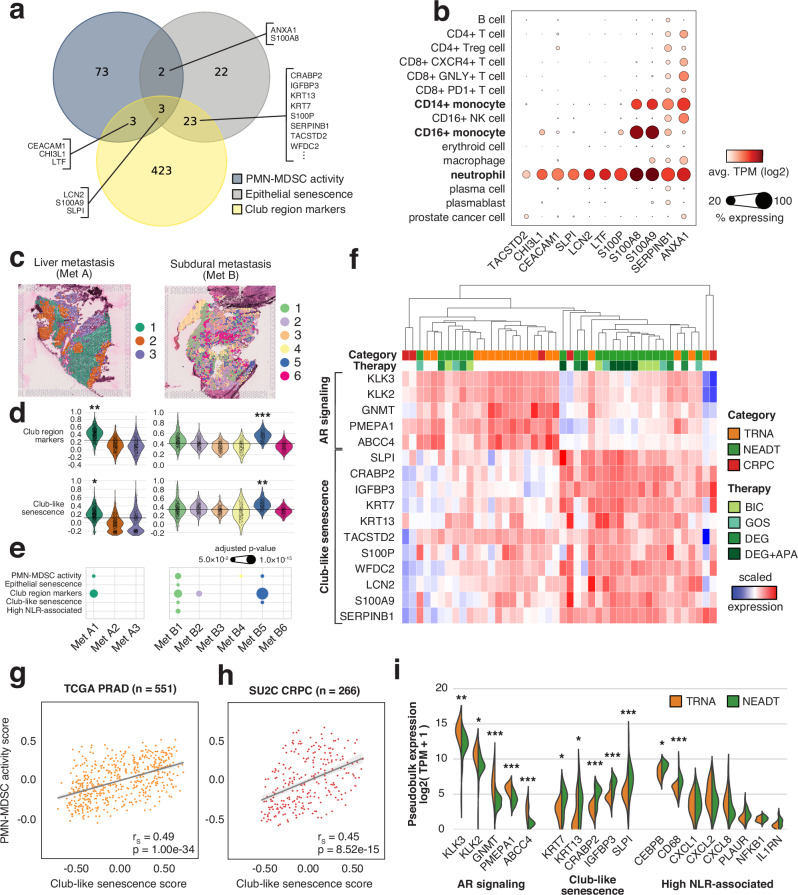
Prostate cancer treatment resistance is a significant challenge facing the field. Genomic and transcriptomic profiling have partially elucidated the mechanisms through which cancer cells escape treatment, but their relation toward the tumor microenvironment (TME) remains elusive. Here we present a comprehensive transcriptomic landscape of the prostate TME at multiple points in the standard treatment timeline employing single-cell RNA-sequencing and spatial transcriptomics data from 120 patients. We identify club-like cells as a key epithelial cell subtype that acts as an interface between the prostate and the immune system. Tissue areas enriched with club-like cells have depleted androgen signaling and upregulated expression of luminal progenitor cell markers. Club-like cells display a senescence-associated secretory phenotype and their presence is linked to increased polymorphonuclear myeloid-derived suppressor cell (PMN-MDSC) activity. Our results indicate that club-like cells are associated with myeloid inflammation previously linked to androgen deprivation therapy resistance, providing a rationale for their therapeutic targeting.


Conflict of interest statement

Competing interests C.T.A.P.’s employer may gain commercially from licensing data to Artera AI. G.A. received personal fees, grants, and travel support from Janssen and Astellas Pharma; personal fees or travel support from Pfizer, Novartis/AAA, Bayer Healthcare Pharmaceuticals, AstraZeneca, and Sanofi-Aventis; in addition, G.A.’s former employer, The Institute of Cancer Research, receives royalty income from abiraterone and G.A. receives a share of this income through the Institute’s Rewards to Discoverers Scheme. G.A. has received research funding (institutional) from Janssen, Astellas Pharma, and Novartis. All other authors declare no potential conflicts of interest.

Figures

Fig. 1
Fig. 1. Integration of scRNA-seq and ST data reveals the organizational patterns of the prostate TME.
a Sample collection and analysis pipeline overview. Brackets indicate the number of samples in each category. The cell state reference was assembled from previously published single-cell RNA-sequencing data–,,,. Created in BioRender. Nykter, M. (2023) https://BioRender.com/n30i289b) An untreated primary tumor sample with eight SCM regions shown separately. Percentages represent the share of spots across the discovery cohort. For details on how the SCM regions were calculated see Methods. Scale bar is 2 mm. c Expression of cell type gene markers across the discovery cohort. Each region was tested for differentially expressed genes individually in all samples. Dot size represents the percentage of samples in which the gene was overexpressed (Wilcoxon rank-sum test padj < 0.05 & log2 fold change ≥ 1). Dot color represents the average log-fold change. Region-specific marker, and their enrichment test padj (one-sided Fisher’s exact test), and region-specific marker status are indicated in Supplementary Data S5. The number of region-specific markers for each region: Tumor (569), Luminal (1,776), Basal (46), Club (452), Immune (594), Endothelium (139), Fibroblast (294), Muscle (280). SCM regions single-cell mapping-based regions.
Fig. 2
Fig. 2. SCM regions match histopathological features and reflect treatment-dependent shifts in gene expression.
a Histopathology classes and SCM regions of five representative samples from the validation cohort. Grade X and Grade Y are cancer spots with indecisive grading (see Methods). PNI: perineural invasion; L.e. stroma: lymphocyte-enriched stroma. Scale bar is 1 mm. b Percentage of SCM regions in each histopathology category in the validation cohort. Values are shown for each region with the highest percentage. c Scaled gene expression in SCM regions grouped by ADT exposure. d Sample-specific SCM region fractions divided according to sample category: BPH: Benign prostatic hyperplasia (n = 4); TRNA: Treatment-naïve prostate cancer (n = 17); NEADT: Neoadjuvant-treated prostate cancer (n = 22); CRPC: Castration-resistant prostate cancer (n = 5). A Kruskal-Wallis test p-value is displayed for each category, while asterisks indicate two-sided Wilcoxon rank-sum test significance level; *p < 0.05; **p < 0.01; ***p < 0.001. Boxes span the interquartile range (IQR) and whiskers extend to points that lie within 1.5 IQRs of the lower and upper quartile. Center line is drawn at the median.
Fig. 3
Fig. 3. The Club region has increased expression of genes linked to a senescence-associated secretory phenotype.
a Spotwise gene set activity scores in the Club region (n = 5595) compared to other epithelial regions (n = 59,198). Asterisks indicate two-sided independent samples t-test p-value (p < 0.05) and effect size: *Other 70th percentile <Club region mean; **Other 80th percentile <Club region mean; ***Other 90th percentile <Club region mean b Gene set score correlation for club-cell signature and high neutrophil-to-lymphocyte ratio-associated (NLR) signature in epithelial regions. c A Venn diagram of gene sets shown in (a). d Scaled gene expression in SCM regions divided by sample category. Genes are grouped according to immunological function. TRP: tissue-resident program, T3 Res: Type 3 immune response, T1 Res: Type 1 immune response, Treg: regulatory T cells, TLS: Tertiary lymphoid structure, Dev.: Developmental program, T: transcription factor, L: chemokine ligand, R: chemokine receptor.
Fig. 4
Fig. 4. Club-like cell enriched regions are associated with increased myeloid-derived suppressor cell infiltration.
a GO:BP term enrichments for genes with upregulated expression in the Club (top) and Immune (bottom) regions. One-sided Fisher’s exact test was used. b Correlation between Club region fraction and PMN-MDSC activity scores in pseudo-bulk for the discovery (left) and the validation (right) cohorts. Two-sided Spearman correlation coefficient and p-value are shown. Error bands in light grey span the 95% confidence interval calculated using a bootstrap. BPH: benign prostatic hyperplasia (n = 4), TRNA: treatment-naïve prostate cancer (n = 17); NEADT: neoadjuvant-treated prostate cancer (n = 22); CRPC: Castration-resistant prostate cancer (n = 5). Low cancer% n = 11, Mid cancer % n = 11, High cancer % n = 10. c PMN-MDSC activity score in treatment-naïve spots grouped according to their proximity to the Club region. Asterisks indicate two-sided independent samples t-test significance levels (p < 0.05) and effect size: *70th percentile <mean; **80th percentile <mean; ***90th percentile <mean. Club region (n = 278), proximal Tumor (n = 687), distant Tumor (n = 8751). d Violin plots of gene set activity scores across all regions in treatment-naïve (n = 36,198) and neoadjuvant-treated (n = 59,259) samples. Asterisks are the same as in (c). e A representative immunostained prostate tissue section (total n = 16) with selected regions of interest (ROIs). f Representative images of club-like positive (n = 47) and club-like negative (n = 54) ROIs corresponding to those annotated in (e). g A representative image of a club-like positive ROI (n = 47) with a three-colour stain showing CD66b+CD11b+CXCR2+ PMN-MDSCs. Arrows point to example cases. Scale bars in white are 500 μm in each panel. h Scatterplot of log-transformed club-like cell and PMN-MDSC cell counts. Each dot represents a ROI (n = 101). Correlation coefficient, p-value, and error bands were calculated the same as in (b). i Violinplot of PMN-MDSC percentage of all detected cells in club-like negative (n = 54) and club-like positive (n = 47) ROIs. A Wilcoxon rank-sum test p-value is shown.
Fig. 5
Fig. 5. Club-like senescence is associated with immunosuppressive PMN-MDSC activity in primary and metastatic tumors.
a Venn diagram showing overlaps between PMN-MDSC activity, epithelial senescence, and club-region upregulated gene sets. b Dot plot of normalized gene expression in metastatic castration-resistant prostate cancer samples. Data and clusters as reported in He et al. 2021. c Expression-based clustering overlaid on two prostate cancer metastasis ST samples. d Cluster-specific gene set scores in MET A (n = 2190) and MET B (n = 2346) ST spots. The dashed line marks the overall score median. Asterisks indicate two-sided independent samples t-test p-value (p < 0.05) and effect size (*cluster 30th percentile > overall median; **cluster 20th percentile > overall median; *cluster 10th percentile > overall median) e Log-transformed overrepresentation padj among each clusters overexpressed genes. One-sided Fisher’s exact test was used. f Scaled gene expression of pseudo-bulk spatial transcriptomics samples. g, h Score correlation for the Club-like senescence and PMN-MDSC activity signatures in TCGA PRAD (n = 551) and SU2C (n = 266) cohorts. Two-sided Spearman correlation coefficient and p-value are shown. Error bands in light grey span the 95% confidence interval calculated using a bootstrap. i Violin plot of normalized gene expression in pseudo-bulk spatial transcriptomics samples. Asterisks indicate differential gene expression test significance levels between treatment-naïve (n = 17) and neoadjuvant-treated (n = 22) prostate cancer samples (*padj <0.05, **padj < 0.01, ***padj < 0.001, two-sided Wald test). PMN-MDSC: polymorphonuclear myeloid-derived suppressor cell; TRNA: treatment-naïve protate cancer (n = 17), NEADT: neoadjuvant-treated prostate cancer (n = 22); CRPC castration-resistant prostate cancer (n = 5), BIC bicalutamide, GOS goserelin, DEG degarelix, APA apalutamide.

References

    1. Attard, G. et al. Prostate cancer. Lancet387, 70–82 (2016). - PubMed
    1. Taylor, B. S. et al. Integrative genomic profiling of human prostate cancer. Cancer Cell18, 11–22 (2010). - PMC - PubMed
    1. Cancer Genome Atlas Research Network. The molecular taxonomy of primary prostate cancer. Cell163, 1011–1025 (2015). - PMC - PubMed
    1. Gundem, G. et al. The evolutionary history of lethal metastatic prostate cancer. Nature520, 353–357 (2015). - PMC - PubMed
    1. Robinson, D. et al. Integrative clinical genomics of advanced prostate cancer. Cell161, 1215–1228 (2015). - PMC - PubMed

Publication types

MeSH terms