. 2024 Nov 16;7(1):1520.
doi: 10.1038/s42003-024-07165-7.

Chrysalis: decoding tissue compartments in spatial transcriptomics with archetypal analysis

Affiliations

Chrysalis: decoding tissue compartments in spatial transcriptomics with archetypal analysis

Demeter Túrós et al. Commun Biol. .

Abstract

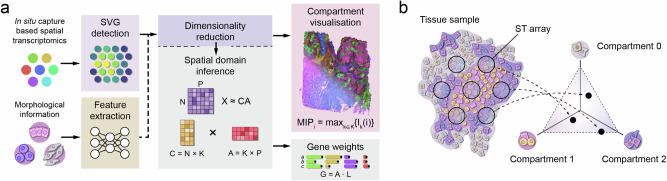
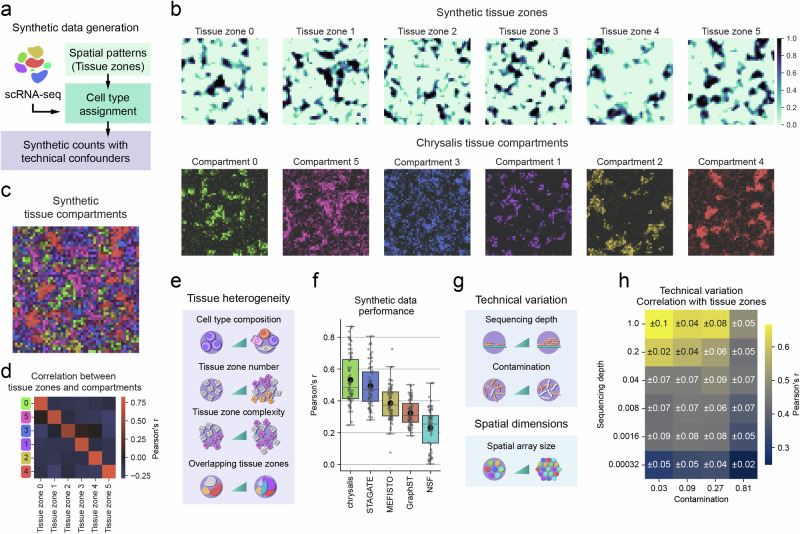
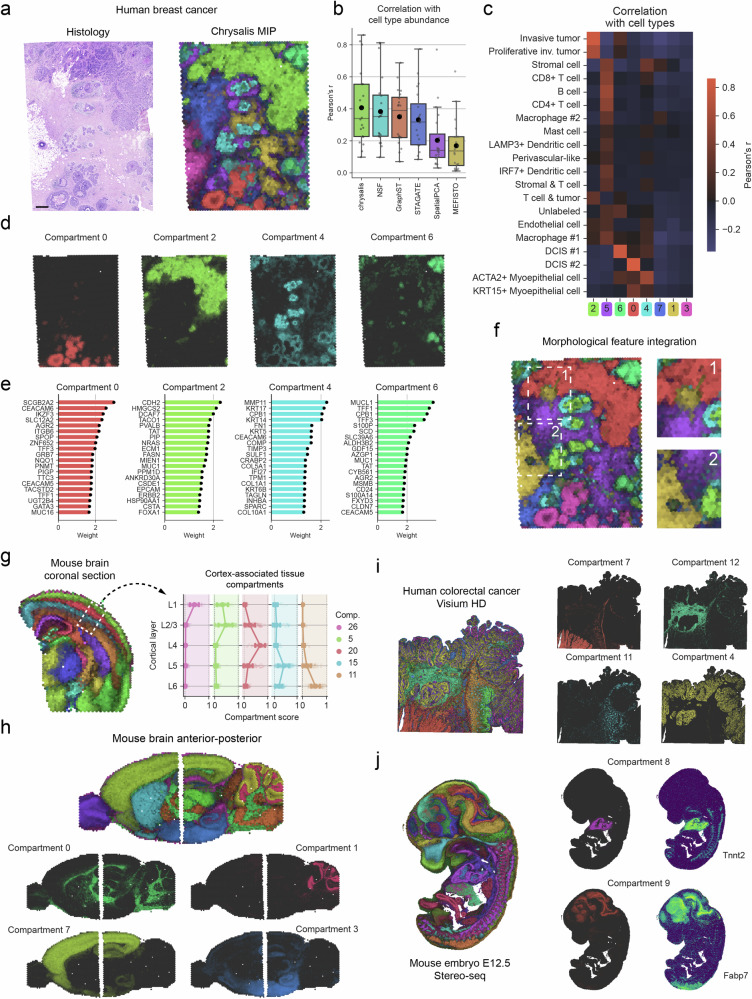
Dissecting tissue compartments in spatial transcriptomics (ST) remains challenging due to limited spatial resolution and dependence on single-cell reference data. We present Chrysalis, a computational method that rapidly uncovers tissue compartments through spatially variable gene (SVG) detection and archetypal analysis without requiring external reference data. Additionally, it offers a unique visualisation approach for swift tissue characterisation and provides access to the underlying gene expression signatures, enabling the identification of spatially and functionally distinct cellular niches. Chrysalis was evaluated through various benchmarks and validated against deconvolution, independently obtained cell type abundance data, and histopathological annotations, demonstrating superior performance compared to other algorithms on both in silico and real-world test examples. Furthermore, we showcased its versatility across different technologies, such as Visium, Visium HD, Slide-seq, and Stereo-seq.


Conflict of interest statement

Competing interests J.V., K.H., and A.V. are currently employed by F. Hoffmann-La Roche Ltd. The other authors declare no competing interests.

Figures

Fig. 1
Fig. 1. Chrysalis overview.
a Chrysalis takes SVGs from the gene expression matrix to construct a low-dimensional representation of ST data using dimensionality reduction. This can be augmented by integrating morphological feature vectors extracted from the corresponding H&E image tiles. By leveraging archetypal analysis, the original feature matrix X is decomposed into two matrices, A and C, where C contains the tissue compartment score for each observation and A stores the contributions of the basis vectors for the tissue compartments. A can be used to reconstruct the weights of individual SVGs for K compartments. Finally, SVG weights are calculated by multiplying A with the PCA loading matrix L. Additionally, Chrysalis uses a MIP-based visualisation to project C to the tissue space. b Chrysalis finds discrete tissue compartments that appear as vertex points of a multi-dimensional simplex fitted to the low-dimensional feature space. These correspond to capture spots exclusively covered by one distinct cellular niche, and every other capture spot containing the mixture of these compartments is represented as a linear combination of them.
Fig. 2
Fig. 2. Validation and benchmarking of Chrysalis on synthetic ST data.
a Synthetic data was produced by generating spatial patterns (tissue zones) and assigning cells to these by drawing them from single-cell reference data. Synthetic counts for each capture spot were derived from the assigned single cells after adding the effects of technical variations, such as sequencing depth and contamination. b Synthetic tissue zones generated with Gaussian processes and the tissue compartments estimated by Chrysalis. c MIP of the tissue compartments estimated by Chrysalis of the sample shown in (b). d Heatmap showing the Pearson correlation coefficient between the tissue zones and the tissue compartments predicted by Chrysalis for the sample shown in (b). e Graphical description of the different conditions established for the generation of the main in silico dataset. f Boxplots showing the average Pearson’s r value distributions of the benchmarked methods on the main synthetic dataset of 72 samples (centre line: median, box limits: upper and lower quartiles, whiskers: 1.5x interquartile range, large black dot: average value, small grey dots: individual values). g Graphical description of the different conditions established for the generation of the technical variation and array size in silico datasets. h Heatmaps showing the effect of technical variation on the performance of Chrysalis across the 24 conditions (three samples per condition were averaged, and standard deviations are reported inside the heatmap tiles).
Fig. 3
Fig. 3. Chrysalis identifies tissue compartments from ST data in the human lymph node.
a Human lymph node H&E image and the projection of the tissue compartments identified by Chrysalis (scale bar: 500 µm). b Jensen–Shannon distance between domain score distributions in the annotated germinal centre and the remainder of the sample across the applied methods (inset). c Boxplots of Pearson’s r values calculated between the 34 reference cell type abundances, inferred with cell2location, and the domain scores for the six methods applied to the lymph node dataset (centre line: median, box limits: upper and lower quartiles, whiskers: 1.5x interquartile range, diamonds: outliers, black dot: average value). d Chrysalis Compartments 0, 3, 4, and 6 and their respective cell type abundances with the highest correlation. e Heatmap showing Pearson correlation coefficients between the cell type deconvolution results of the 34 reference cell types and the tissue compartments (DC cDC1: dendritic cell conventional type 1, DC cDC2: dendritic cell conventional type 2, DC pDC: plasmacytoid dendritic cells, DC: dendritic cell, FDC: follicular dendritic cell, GC-DZ: germinal centre-dark zone, GC-LZ: germinal centre-light zone, ILC: innate lymphoid cell, NK: natural killer cell, preGC: pre-germinal centre, prePB: pre-plasmablast, TfH: follicular regulatory T cell, TfR: follicular regulatory T cell, VSCM: vascular smooth muscle cell). f 20 top contributing genes for Compartments 0, 3, 4, and 6. Bold characters were used to highlight the names of the genes referred to in the main text.
Fig. 4
Fig. 4. Chrysalis uncovers distinct tissue compartments across various tissue types and spatial technologies.
a Human breast cancer H&E image and the projection of the tissue compartments identified by Chrysalis (scale bar: 500 µm). b Boxplots of Pearson’s r values calculated between the reference cell type abundances from the Xenium measurement and the tissue compartment scores for the six methods applied to the human breast cancer dataset (centre line: median, box limits: upper and lower quartiles, whiskers: 1.5x interquartile range, diamonds: outliers, black dot: average value). c Correlation heatmap showing Pearson’s r between the cell type abundance data of 20 cell types derived from the subsequent tissue section measured with Xenium and the tissue compartments inferred by Chrysalis. d Individual Chrysalis Compartments 0, 2, 4, and 6 denoting DCIS #1, invasive tumour, myoepithelial, and DCIS #2 signatures, respectively. e Top 20 genes that contribute the most to Compartments 0, 2, 4, and 6 in the human breast cancer dataset. f Chrysalis compartments with integrated morphological features extracted with a deep autoencoder. Morphological features improved the separation between the adipose tissue (yellow), invasive tumour (red), and stroma (purple; right panels). g Tissue compartments within the mouse brain identified by Chrysalis. The white rectangle highlights the 5 cortical layer-associated tissue compartments. Cortical layer-associated tissue compartment scores in expert-annotated regions. h Chrysalis MIP plot of the two-sample mouse brain dataset and individual compartments corresponding to the fibre tracts (Compartment 0), internal granular layer of the cerebellum (Compartment 1), and ventral (Compartment 7) and dorsal (Compartment 3) cortex. i Chrysalis MIP of a human colorectal cancer sample captured with Visium HD and individual compartments showcasing distinct cellular niches: muscular layer (Compartment 7), fibroblastic stroma (Compartment 12), stromal immune infiltrates (Compartment 11), neoplastic epithelium (Compartment 4). j MIP of Chrysalis compartments in the mouse embryo (E12.5) captured with Stereo-seq and the compartments corresponding to the developing heart (Compartment 8) and brain (Compartment 9) alongside their corresponding top-weighted genes.

References

    1. Longo, S. K., Guo, M. G., Ji, A. L. & Khavari, P. A. Integrating single-cell and spatial transcriptomics to elucidate intercellular tissue dynamics. Nat. Rev. Genet. 1–18 10.1038/s41576-021-00370-8 (2021). - PMC - PubMed
    1. Ståhl, P. L. et al. Visualization and analysis of gene expression in tissue sections by spatial transcriptomics. Science353, 78–82 (2016). - PubMed
    1. Vickovic, S. et al. High-definition spatial transcriptomics for in situ tissue profiling. Nat. Methods16, 987–990 (2019). - PMC - PubMed
    1. Fu, X. et al. Polony gels enable amplifiable DNA stamping and spatial transcriptomics of chronic pain. Cell185, 4621–4633.e17 (2022). - PMC - PubMed
    1. Cao, J. et al. Decoder-seq enhances mRNA capture efficiency in spatial RNA sequencing. Nat. Biotechnol. 1–12 10.1038/s41587-023-02086-y (2024). - PubMed