. 2024 Nov 16;24(1):1415.
doi: 10.1186/s12885-024-13186-6.

Exploring the impact of mitochondrial-targeting anthelmintic agents with GLUT1 inhibitor BAY-876 on breast cancer cell metabolism

Affiliations

Exploring the impact of mitochondrial-targeting anthelmintic agents with GLUT1 inhibitor BAY-876 on breast cancer cell metabolism

Tanner J Schumacher et al. BMC Cancer. .

Abstract

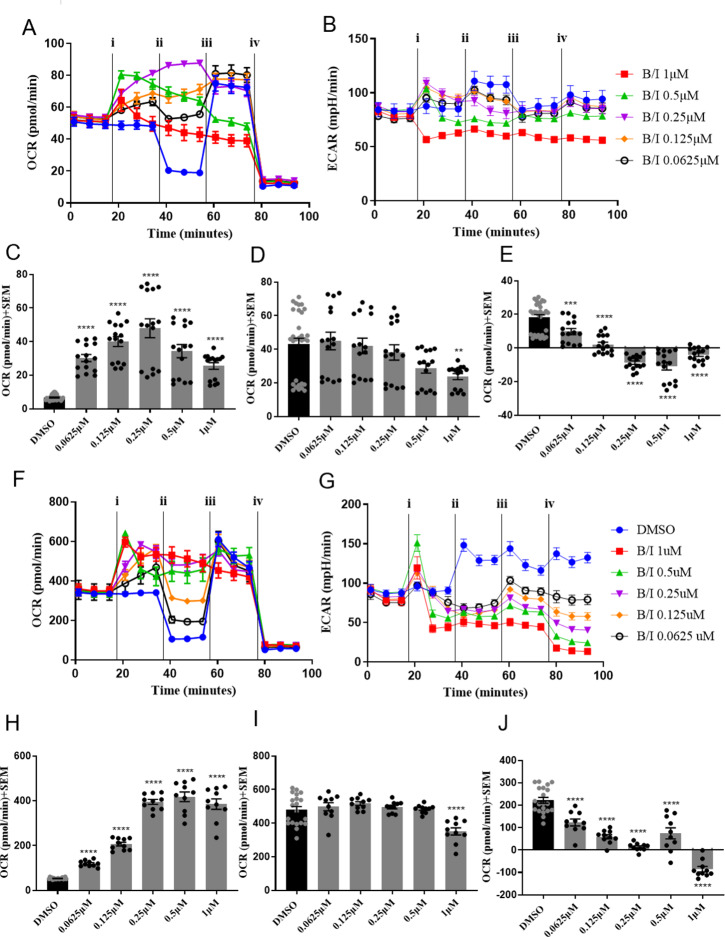
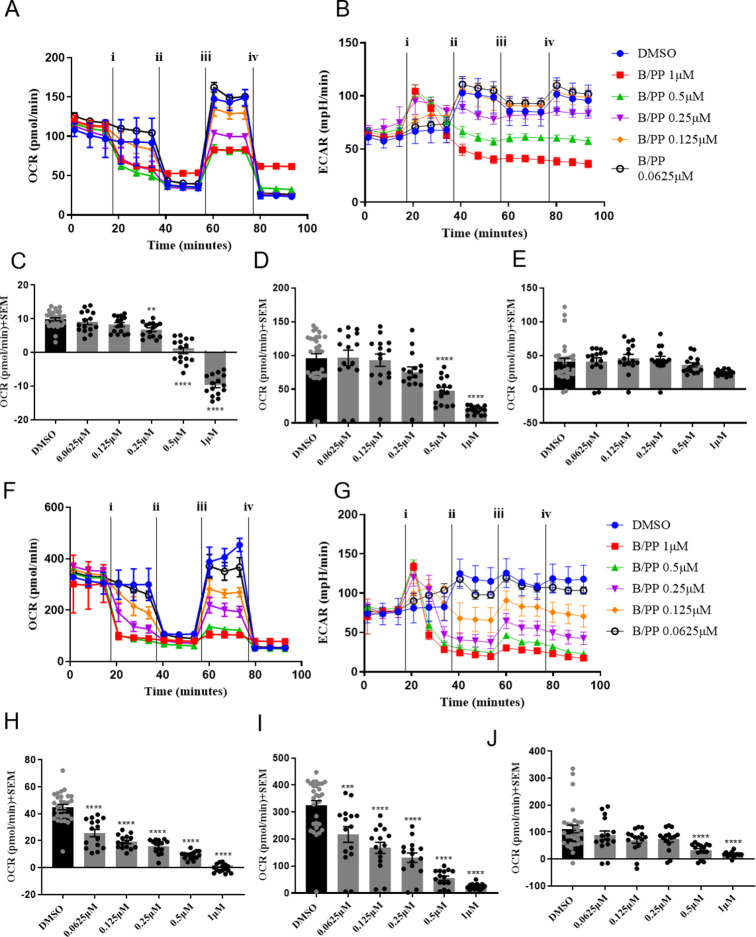
Background: Cancer cells alter their metabolic phenotypes with nutritional change. Single agent approaches targeting mitochondrial metabolism in cancer have failed due to either dose limiting off target toxicities, or lack of significant efficacy in vivo. To mitigate these clinical challenges, we investigated the potential utility of repurposing FDA approved mitochondrial targeting anthelmintic agents, niclosamide, IMD-0354 and pyrvinium pamoate, to be combined with GLUT1 inhibitor BAY-876 to enhance the inhibitory capacity of the major metabolic phenotypes exhibited by tumors.

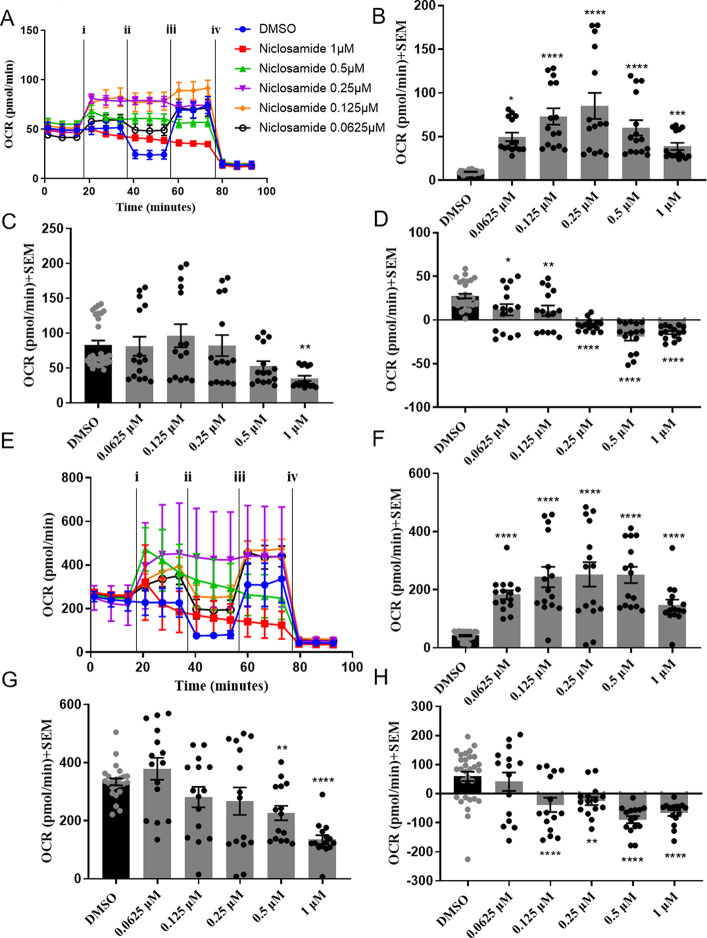
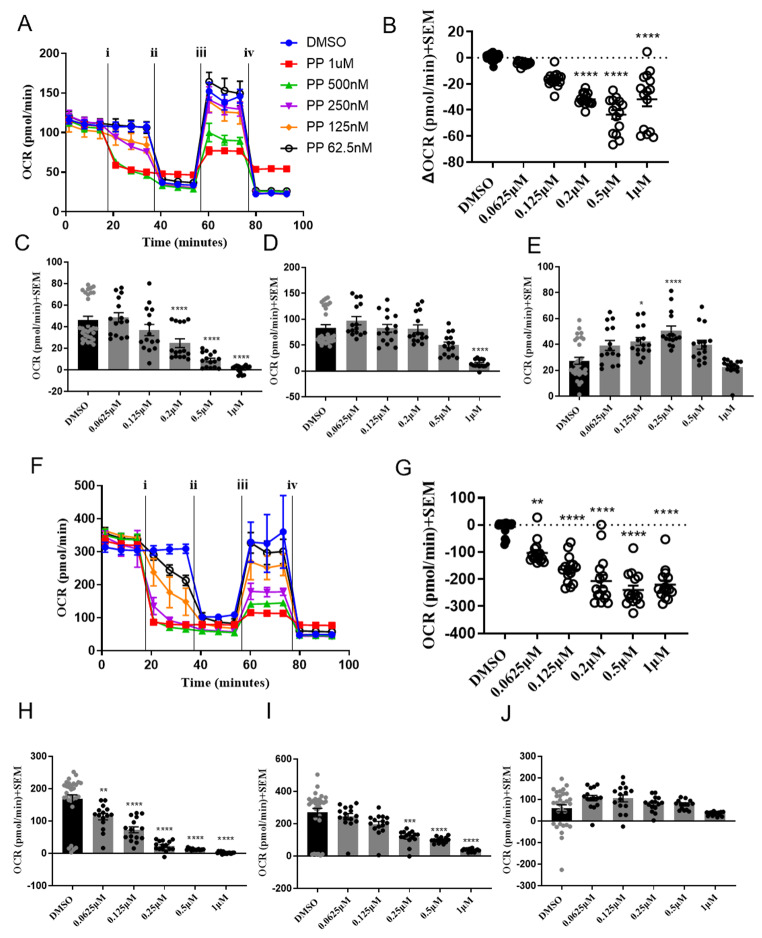
Methods: To test this, we used breast cancer cell lines MDA-MB-231 and 4T1 which exhibit differing basal metabolic rates of glycolysis and mitochondrial respiration, respectively. Metabolic characterization was carried out using Seahorse XFe96 Bioanalyzer and statistical analysis was carried out via ANOVA.

Results: Here, we found that specific responses to mitochondrial and glycolysis targeting agents elicit responses that correlate with tested cell lines basal metabolic rates and fuel preference, highlighting the potential to cater metabolism targeting treatment regimens based on specific tumor nutrient handling. Inhibition of GLUT1 with BAY-876 potently inhibited glycolysis in both MDA-MB-231 and 4T1 cells, and niclosamide and pyrvinium pamoate perturbed mitochondrial respiration that resulted in potent compensatory glycolysis in the cell lines tested.

Conclusion: In this regard, combination of BAY-876 with both mitochondrial targeting agents resulted in inhibition of compensatory glycolysis and subsequent metabolic crisis. These studies highlight targeting tumor metabolism as a combination treatment regimen that can be tailored by basal and compensatory metabolic phenotypes.

Keywords: Anthelmintic; Anticancer; BAY-876; Drug repurposing; Niclosamide; Pyrvinium.


Conflict of interest statement

Declarations Ethics approval and consent to participate Not applicable. Consent for publication Not applicable. Competing interests The authors declare no competing interests.

Figures

Fig. 1
Fig. 1
(A) Seahorse XFe96® ATP rate assay. Rates indicative of ATP production rate + SEM (pmol/min) from glycolysis (black) or mitochondria. Results are from three separate experiments and are normalized to total protein using bicinchoninic acid (BCA). (B) Growth curve for 4T1 and MDA-MB-231 cells. Each data point represents 6 technical replicates. On each day, media was aspirated, rinsed three times with cold PBS and allowed to dry fix for a minimum of 24 h. After all wells have dry fixed for 24 h, 0.5% w/v SRB in 1% acetic acid was added to the wells for 45 min, aspirated and rinsed three times with 1% acetic acid, allowed to dry, solubilized in 10mM Tris bas (pH 10.2) and absorbance was measured at 540 nm. (C) MDA-MB-231 extracellular acidification rates (ECAR (mpH/min)) vs. time after injection of (i) treatment or DMSO (ii) glucose (iii) oligomycin and (iv) 2-deoxyglucose. D. Calculated ECAR after addition of glucose which indicates extent of cellular glycolysis and inhibition from treatment of BAY-876 (10-0.625µM) in MDA-MB-231 cells E. ECAR indicating glycolytic capacity after uncoupling mitochondrial ATP synthesis after injection of oligomycin and inhibition after treatment with BAY-876 (10-0.625µM) in MDA-MB-231 cells. F. 4T1 extracellular acidification rates (ECAR (mpH/min)) vs. time after injection of (i) treatment or DMSO (ii) glucose (iii) oligomycin and (iv) 2-deoxyglucose. G. Calculated ECAR after addition of glucose which indicates extent of cellular glycolysis and inhibition from treatment of BAY-876 (10-0.625µM) in 4T1 cells. H. ECAR indicating glycolytic capacity after uncoupling mitochondrial ATP synthesis after injection of oligomycin and inhibition after treatment with BAY-876 (10-0.625µM) in 4T1 cells. D,E,G,H: results are representative of 3 biological replicates experiments having a combined total of 15 technical replicates per group ± SEM. Statistical analysis was carried out via Dunnett’s one-way ANOVA compared to DMSO control (*p < 0.05, **p < 0.01, ***p < 0.001, ****p < 0.0001)
Fig. 2
Fig. 2
A. MDA-MB-231 oxygen consumption rates (OCR (pmol/min)) vs. time after injection of (i) treatment or DMSO (ii) oligomycin (iii) FCCP and (iv) Rotenone and Antimycin A after treatment with niclosamide (1-0.0625µM). B. calculated OCR subtracting non-mitochondrial respiration from OCR after oligomycin of DMSO control and after acute niclosamide injection (1-0.0625µM) indicating proton leak in MDA-MB-231 cells. C. Maximal respiration OCR of DMSO control and after treatment with niclosamide (1-0.0625µM) in MDA-MB-231 cells. D. Spare respiratory capacity OCR from subtracting OCR before oligomycin injection from maximal respiration after treatment with niclosamide (1-0.0625µM) in MDA-MB-231 cells. E. 4T1 oxygen consumption rates (OCR (pmol/min) vs. time after injection of (i) treatment or DMSO (ii) oligomycin (iii) FCCP and (iv) Rotenone and Antimycin A after treatment with niclosamide (1-0.0625µM). F. calculated OCR subtracting non-mitochondrial respiration from OCR after oligomycin of DMSO control and after acute niclosamide injection (1-0.0625µM) indicating proton leak in 4T1 cells. G. Maximal respiration OCR of DMSO control and after treatment with niclosamide (1-0.0625µM) in 4T1 cells. H. Spare respiratory capacity OCR from subtracting OCR before oligomycin injection from maximal respiration after treatment with niclosamide (1-0.0625µM) in 4T1 cells. B,C,D,F,G,H: results are representative of 3 biological replicates experiments having a combined total of 15 technical replicates per group ± SEM. Statistical analysis was carried out via Dunnett’s one-way ANOVA compared to DMSO control (*p < 0.05, **p < 0.01, ***p < 0.001, ****p < 0.0001)
Fig. 3
Fig. 3
A. MDA-MB-231 oxygen consumption rates (OCR (pmol/min)) vs. time after injection of (i) treatment or DMSO (ii) oligomycin (iii) FCCP and (iv) Rotenone and Antimycin A after treatment with IMD-0354 (1.25-0.078125µM). B. Calculated OCR subtracting non-mitochondrial respiration from OCR after oligomycin of DMSO control and after acute IMD-0354 injection (1.25-0.078125µM) indicating proton leak in MDA-MB-231 cells. C. Maximal respiration OCR of DMSO control and after treatment with IMD-0354 (1.25-0.078125µM) in MDA-MB-231 cells. D. Spare respiratory capacity OCR from subtracting OCR before oligomycin injection from maximal respiration after treatment with IMD-0354 (1.25-0.078125µM) in MDA-MB-231 cells. E. 4T1 oxygen consumption rates (OCR (pmol/min)) vs. time after injection of (i) treatment or DMSO (ii) oligomycin (iii) FCCP and (iv) Rotenone and Antimycin A after treatment with IMD-0354 (1.25-0.078125µM). F. Calculated OCR subtracting non-mitochondrial respiration from OCR after oligomycin of DMSO control and after acute IMD-0354 injection (1.25-0.078125µM) indicating proton leak in 4T1 cells. G. Maximal respiration OCR of DMSO control and after treatment with IMD-0354 (1.25-0.078125µM) in 4T1 cells. H. Spare respiratory capacity OCR from subtracting OCR before oligomycin injection from maximal respiration after treatment with IMD-0354 (1.25-0.078125µM) in 4T1 cells. B,C,D,F,G,H: results are representative of 3 biological replicates experiments having a combined total of 15 technical replicates per group ± SEM. Statistical analysis was carried out via Dunnett’s one-way ANOVA compared to DMSO control (*p < 0.05, **p < 0.01, ***p < 0.001, ****p < 0.0001)
Fig. 4
Fig. 4
A. MDA-MB-231 oxygen consumption rates (OCR (pmol/min)) vs. time after injection of (i) treatment or DMSO (ii) oligomycin (iii) FCCP and (iv) Rotenone and Antimycin A after treatment with PP (1-0.0625µM). B. ΔOCR after acute injection of PP (1-0.0625µM) in MDA0-MB-231 cells. C. ΔOCR subtracting OCR before injection of FCCP from before oligomycin injection of DMSO control and after acute PP injection (1-0.0625µM) indicating mitochondrial ATP production in MDA-MB-231 cells. D. Maximal respiration OCR of DMSO control and after treatment with PP (1-0.0625µM) in MDA-MB-231 cells. E. Spare respiratory capacity OCR from subtracting OCR before oligomycin injection from maximal respiration after treatment with PP (1-0.0625µM) in MDA-MB-231 cells. F. 4T1 oxygen consumption rates (OCR (pmol/min)) vs. time after injection of (i) treatment or DMSO (ii) oligomycin (iii) FCCP and (iv) Rotenone and Antimycin A after treatment with PP (1-0.0625µM). G. ΔOCR after acute injection of PP (1-0.0625µM) in MDA0-MB-231 cells. H. ΔOCR subtracting OCR before injection of FCCP from before oligomycin injection of DMSO control and after acute PP injection (1-0.0625µM) indicating mitochondrial ATP production in 4T1 cells. I. Maximal respiration OCR of DMSO control and after treatment with PP (1-0.0625µM) in 4T1 cells. J. Spare respiratory capacity OCR from subtracting OCR before oligomycin injection from maximal respiration after treatment with PP (1-0.0625µM) in 4T1 cells. B,C,D,E,H,I,J: results are representative of 3 biological replicates experiments having a combined total of 15 technical replicates per group ± SEM. Statistical analysis was carried out via Dunnett’s one-way ANOVA compared to DMSO control (*p < 0.05, **p < 0.01, ***p < 0.001, ****p < 0.0001)
Fig. 5
Fig. 5
A. MDA-MB-231 oxygen consumption rates (OCR (pmol/min)) vs. time after injection of (i) treatment or DMSO (ii) oligomycin (iii) FCCP and (iv) Rotenone and Antimycin A after treatment with B/N (1-0.0625 µM). B. MDA-MB-231 extracellular acidification rates (ECAR (mpH/min)) vs. time after injection of (i) treatment or DMSO (ii) oligomycin (iii) FCCP and (iv) Rotenone and Antimycin A after treatment with B/N (1-0.0625 µM). C. ΔOCR subtracting non-mitochondrial respiration from OCR after oligomycin of DMSO control and after acute B/N injection (1-0.0625 µM) indicating proton leak in MDA-MB-231 cells. D. Maximal respiration OCR of DMSO control and after treatment with B/N (1-0.0625 µM) in MDA-MB-231 cells. E. Spare respiratory capacity OCR from subtracting OCR before oligomycin injection from maximal respiration in MDA-MB-231 cells. F. 4T1 oxygen consumption rates (OCR (pmol/min)) vs. time after injection of (i) treatment or DMSO (ii) oligomycin (iii) FCCP and (iv) Rotenone and Antimycin A after treatment with B/N (1-0.0625 µM). G. 4T1 extracellular acidification rates (ECAR (mpH/min)) vs. time after injection of (i) treatment or DMSO (ii) oligomycin (iii) FCCP and (iv) Rotenone and Antimycin A after treatment with B/N (1-0.0625 µM). H. ΔOCR subtracting non-mitochondrial respiration from OCR after oligomycin of DMSO control and after acute B/N injection (1-0.0625 µM) indicating proton leak in 4T1 cells. I. Maximal respiration OCR of DMSO control and after treatment with B/N (1-0.0625 µM) in 4T1 cells. J. Spare respiratory capacity OCR from subtracting OCR before oligomycin injection from maximal respiration in 4T1 cells. C,D,E,H,I,J: results are representative of 3 biological replicates experiments having a combined total of 15 technical replicates per group ± SEM. Statistical analysis was carried out via Dunnett’s one-way ANOVA compared to DMSO control (*p < 0.05, **p < 0.01, ***p < 0.001, ****p < 0.0001)
Fig. 6
Fig. 6
A. MDA-MB-231 oxygen consumption rates (OCR (pmol/min)) vs. time after injection of (i) treatment or DMSO (ii) oligomycin (iii) FCCP and (iv) Rotenone and Antimycin A after treatment with B/I (1-0.0625 µM). B. MDA-MB-231 extracellular acidification rates (ECAR (mpH/min)) vs. time after injection of (i) treatment or DMSO (ii) oligomycin (iii) FCCP and (iv) Rotenone and Antimycin A after treatment with B/I (1-0.0625 µM). C. ΔOCR subtracting non-mitochondrial respiration from OCR after oligomycin of DMSO control and after acute B/I injection (1-0.0625 µM) indicating proton leak in MDA-MB-231 cells. D. Maximal respiration OCR of DMSO control and after treatment with B/I (1-0.0625 µM) in MDA-MB-231 cells. E. Spare respiratory capacity OCR from subtracting OCR before oligomycin injection from maximal respiration in MDA-MB-231 cells. F. 4T1 oxygen consumption rates (OCR (pmol/min)) vs. time after injection of (i) treatment or DMSO (ii) oligomycin (iii) FCCP and (iv) Rotenone and Antimycin A after treatment with B/I (1-0.0625 µM). G. 4T1 extracellular acidification rates (ECAR (mpH/min)) vs. time after injection of (i) treatment or DMSO (ii) oligomycin (iii) FCCP and (iv) Rotenone and Antimycin A after treatment with B/I (1-0.0625 µM). H. ΔOCR subtracting non-mitochondrial respiration from OCR after oligomycin of DMSO control and after acute B/N injection (1-0.0625 µM) indicating proton leak in 4T1 cells. I. Maximal respiration OCR of DMSO control and after treatment with B/I (1-0.0625 µM) in 4T1 cells. J. Spare respiratory capacity OCR from subtracting OCR before oligomycin injection from maximal respiration in 4T1 cells. C,D,E,H,I,J: results are representative of 2 biological replicates experiments containing a combined total of 10 technical replicates per group ± SEM. Statistical analysis was carried out via Dunnett’s one-way ANOVA compared to DMSO control (*p < 0.05, **p < 0.01, ***p < 0.001, ****p < 0.0001)
Fig. 7
Fig. 7
A. MDA-MB-231 oxygen consumption rates (OCR (pmol/min)) vs. time after injection of (i) treatment or DMSO (ii) oligomycin (iii) FCCP and (iv) Rotenone and Antimycin A after treatment with B/PP (1-0.0625 µM). B. MDA-MB-231 extracellular acidification rates (ECAR (mpH/min)) vs. time after injection of (i) treatment or DMSO (ii) oligomycin (iii) FCCP and (iv) Rotenone and Antimycin A after treatment with B/PP (1-0.0625 µM). C. ΔOCR subtracting non-mitochondrial respiration from OCR after oligomycin of DMSO control and after acute B/PP injection (1-0.0625 µM) indicating proton leak in MDA-MB-231 cells. D. Maximal respiration OCR of DMSO control and after treatment with B/PP (1-0.0625 µM) in MDA-MB-231 cells. E. Spare respiratory capacity OCR from subtracting OCR before oligomycin injection from maximal respiration in MDA-MB-231 cells. F. 4T1 oxygen consumption rates (OCR (pmol/min)) vs. time after injection of (i) treatment or DMSO (ii) oligomycin (iii) FCCP and (iv) Rotenone and Antimycin A after treatment with B/PP (1-0.0625 µM). G. 4T1 extracellular acidification rates (ECAR (mpH/min)) vs. time after injection of (i) treatment or DMSO (ii) oligomycin (iii) FCCP and (iv) Rotenone and Antimycin A after treatment with B/PP (1-0.0625 µM). H. ΔOCR subtracting non-mitochondrial respiration from OCR after oligomycin of DMSO control and after acute B/PP injection (1-0.0625 µM) indicating proton leak in 4T1 cells. I. Maximal respiration OCR of DMSO control and after treatment with B/PP (1-0.0625 µM) in 4T1 cells. J. Spare respiratory capacity OCR from subtractin`g OCR before oligomycin injection from maximal respiration in 4T1 cells. C,D,E,H,I,J: results are representative of 3 biological replicates experiments having a combined total of 15 technical replicates per group ± SEM. Statistical analysis was carried out via Dunnett’s one-way ANOVA compared to DMSO control (*p < 0.05, **p < 0.01, ***p < 0.001, ****p < 0.0001)

References

    1. Szwed A, Kim E, Jacinto E. Regulation and metabolic functions of mTORC1 and mTORC2. Physiol Rev. 2021;101:1371. - PMC - PubMed
    1. Saxton RA, Sabatini DM. mTOR Signaling in Growth, Metabolism, and Disease. Cell. 2017;168:960. - PMC - PubMed
    1. Kim SG, Buel GR, Blenis J. Nutrient regulation of the mTOR complex 1 signaling pathway. Mol Cells. 2013;35:463. - PMC - PubMed
    1. Tian T, Li X, Zhang J. mTOR Signaling in Cancer and mTOR inhibitors in solid Tumor Targeting Therapy. Int J Mol Sci. 2019;20. - PMC - PubMed
    1. Janzen NR, Whitfield J, Hoffman NJ. Interactive roles for AMPK and Glycogen from Cellular Energy sensing to Exercise Metabolism. Int J Mol Sci. 2018;19. - PMC - PubMed

LinkOut - more resources