. 2024 Nov 16;24(1):381.
doi: 10.1186/s12935-024-03573-1.

Integrated proteomics and metabolomics analyses reveal new insights into the antitumor effects of valproic acid plus simvastatin combination in a prostate cancer xenograft model associated with downmodulation of YAP/TAZ signaling

Affiliations

Integrated proteomics and metabolomics analyses reveal new insights into the antitumor effects of valproic acid plus simvastatin combination in a prostate cancer xenograft model associated with downmodulation of YAP/TAZ signaling

Federica Iannelli et al. Cancer Cell Int. .

Abstract

Background: Despite advancements in therapeutic approaches, including taxane-based chemotherapy and androgen receptor-targeting agents, metastatic castration-resistant prostate cancer (mCRPC) remains an incurable tumor, highlighting the need for novel strategies that can target the complexities of this disease and bypass the development of drug resistance mechanisms. We previously demonstrated the synergistic antitumor interaction of valproic acid (VPA), an antiepileptic agent with histone deacetylase inhibitory activity, with the lipid-lowering drug simvastatin (SIM). This combination sensitizes mCRPC cells to docetaxel treatment both in vitro and in vivo by targeting the cancer stem cell compartment via mevalonate pathway/YAP axis modulation.

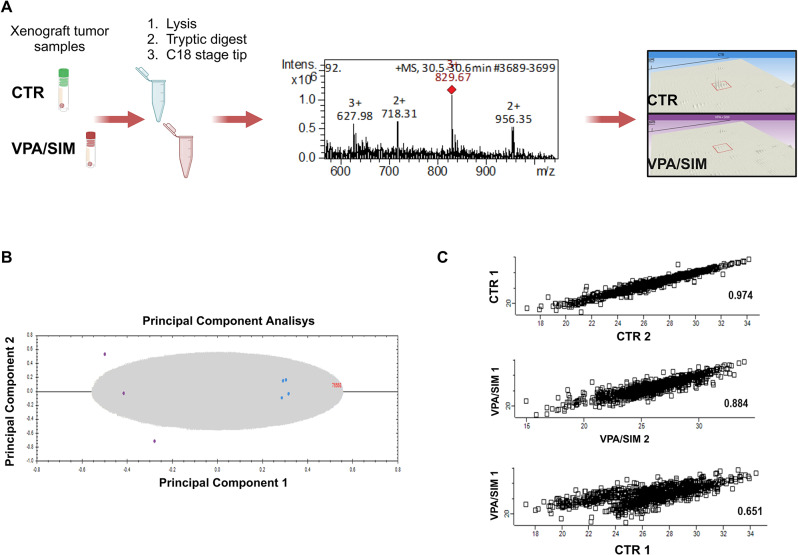
Methods: Here, using a combined proteomic and metabolomic/lipidomic approach, we characterized tumor samples derived from 22Rv1 mCRPC cell-xenografted mice treated with or without VPA/SIM and performed an in-depth bioinformatics analysis.

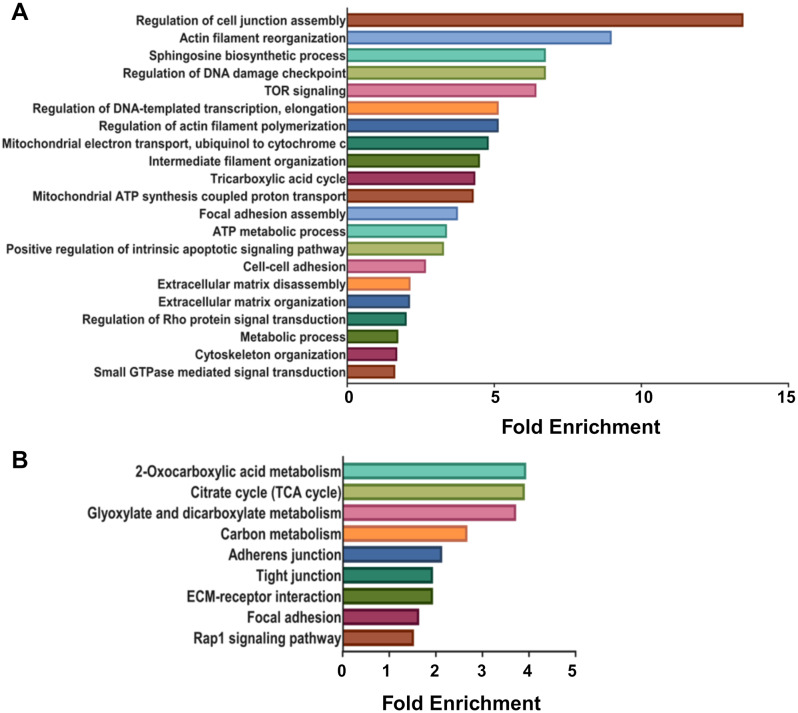
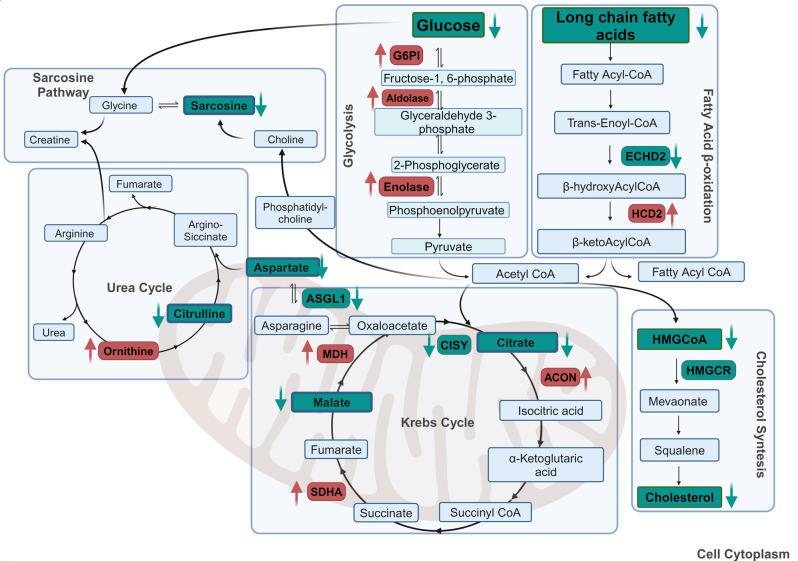
Results: We confirmed the specific impact of VPA/SIM on the Hippo-YAP signaling pathway, which is functionally related to the modulation of cancer-related extracellular matrix biology and metabolic reprogramming, providing further insights into the molecular mechanism of the antitumor effects of VPA/SIM.

Conclusions: In this study, we present an in-depth exploration of the potential to repurpose two generic, safe drugs for mCRPC treatment, valproic acid (VPA) and simvastatin (SIM), which already show antitumor efficacy in combination, primarily affecting the cancer stem cell compartment via MVP/YAP axis modulation. Bioinformatics analysis of the LC‒MS/MS and 1H‒NMR metabolomics/lipidomics results confirmed the specific impact of VPA/SIM on Hippo-YAP.

Keywords: Drug repurposing; Metabolomics; Prostate cancer; Proteomics; Simvastatin; Valproic acid.


Conflict of interest statement

Declarations Ethical approval Not applicable. Competing interests The authors declare no competing interests.

Figures

Fig. 1
Fig. 1
Schematic representation of the label-free LC‒MS/MS-based protein quantification workflow. (A) Digested peptides from 22Rv1 xenograft tumor samples treated with VPA/SIM (treated group) or the control (CTR) are depicted. Peptide profiles are aligned, and their intensities are quantified using Progenesis QI for Proteomics software and visualized through 3D ion peak intensity views. The statistical significance of the peptides was determined by ANOVA (p value < 0.05), false discovery rate (FDR)-adjusted q values (q < 0.05), and the criterion of a fold change (FC) ≥ 2. (B) Unsupervised multivariate analysis of proteomic data conducted using a principal component analysis (PCA) plot. This analysis visualizes the variation among biological replicates of 22Rv1 CTR (represented by light blue circles) and VPA/SIM-treated 22Rv1 (represented by purple circles), which were generated with Progenesis QI for Proteomics software. (C) Biological variability among peptide/protein replicates was assessed by calculating Pearson correlation coefficients using Perseus software (v.1.6.6.0). An absolute value close to 1 indicates a strong linear relationship between replicates. The figure was created using https://www.BioRender.com
Fig. 2
Fig. 2
Functional enrichment analysis using g: Profiler software (version e94_eg41_p11) and western blot analysis. (A) The significantly enriched terms according to the GO and WikiPathways (WP) databases. Statistical significance was determined using a threshold of p < 0.05. (B-C) The normalized abundance values were derived from Progenesis QI for Proteomics software, which quantifies proteins on the basis of peptide ion signal peak intensity. The criteria for significance included a p value < 0.05, a q value < 0.05, and a fold change (FC) ≥ 2. (D) Western blot analysis of phospho-LAT1 (pLATS1) and LATS1 in lysates from three representative xenograft tumor samples from treated and control groups. β-actin served as a loading control. Western blot quantifications were performed with ImageJ software. Densitometric analysis values are reported as ratios relative to the corresponding β-actin levels. The graph represents the means +/- SD of the values for pLATS1 and LATS1 in treated and control groups. The figure was created using https://www.BioRender.com
Fig. 3
Fig. 3
Gene Ontology (GO) enrichment and pathway analyses were performed using the Database for Annotation Visualization and Integrated Discovery (DAVID) v6.8 (https://david.ncifcrf.gov/). (A) Gene Ontology (GO) biological process and (B) Kyoto Encyclopedia of Genes and Genomes (KEGG) pathway analyses. Statistical significance was determined using a threshold of p < 0.05. The figure was created using https://www.BioRender.com
Fig. 4
Fig. 4
Interactomic analysis using Ingenuity Pathway Analysis (IPA) software. Interactomic analysis was performed using Ingenuity Pathway Analysis (IPA) software to visualize protein networks, where proteins are depicted as hubs and their relationships as edges. This figure illustrates a network identified by IPA, highlighting direct interactions involving 11 out of 12 identified proteins (shown in orange). The molecular functions (Fx) associated with the proteins within the network are reported. The figure was created using https://www.BioRender.com
Fig. 5
Fig. 5
Score and loading plots related to 1 H-NMR analysis. Polar (A-B) and lipidic (C-D) fractions obtained by the partial least squares-discriminant analysis (PLS-DA) algorithm were used to compare the spectra obtained for the 22Rv1 VPA/SIM-treated and CTR groups to explain the maximum separation between the defined class samples in the data. The loading plot is obtained by setting H = K − 1, where H is the number of dimensions and k is the number of variables to select on each dimension. In the loading plots, we highlighted the top ten proton signals of metabolites/lipids that were significantly different between the two analyzed groups. The colored boxes on the right indicate the relative proton signal intensity of the identified metabolites in each group under study. The gradient color scheme ranges from blue color for lower abundance to red color for high abundance. The figure was created using https://www.BioRender.com
Fig. 6
Fig. 6
Schematic representation of the metabolic mechanisms modulated in the 22Rv1 VPA/SIM-treated and CTR groups. Metabolic mechanisms altered in the 22Rv1 xenograft tumor samples treated with VPA/SIM compared with those in the control (CTR) group. The enzymes and metabolites highlighted in red are those whose levels increased, whereas the enzymes highlighted in green are those whose levels decreased in the 22Rv1 VPA/SIM-treated group. The figure was created using https://www.BioRender.com

References

    1. Rawla P. Epidemiology of prostate Cancer. World J Oncol. 2019;10(2):63–89. - PMC - PubMed
    1. Jang A, Sartor O, Barata PC, Paller CJ. Therapeutic potential of PARP inhibitors in the treatment of metastatic castration-resistant prostate Cancer. Cancers (Basel). 2020;12(11). - PMC - PubMed
    1. Mehtala J, Zong J, Vassilev Z, Brobert G, Gabarro MS, Stattin P, et al. Overall survival and second primary malignancies in men with metastatic prostate cancer. PLoS ONE. 2020;15(2):e0227552. - PMC - PubMed
    1. Rizzo M. Mechanisms of docetaxel resistance in prostate cancer: the key role played by miRNAs. Biochim Biophys Acta Rev Cancer. 2021;1875(1):188481. - PubMed
    1. Guerrero-Ochoa P, Rodriguez-Zapater S, Anel A, Esteban LM, Camon-Fernandez A, Espilez-Ortiz R et al. Prostate Cancer and the Mevalonate Pathway. Int J Mol Sci. 2024;25(4). - PMC - PubMed

LinkOut - more resources