. 2024 Dec;300(12):108004.
doi: 10.1016/j.jbc.2024.108004. Epub 2024 Nov 16.

Impaired branched-chain amino acid (BCAA) catabolism during adipocyte differentiation decreases glycolytic flux

Affiliations

Impaired branched-chain amino acid (BCAA) catabolism during adipocyte differentiation decreases glycolytic flux

Courtney R Green et al. J Biol Chem. 2024 Dec.

Abstract

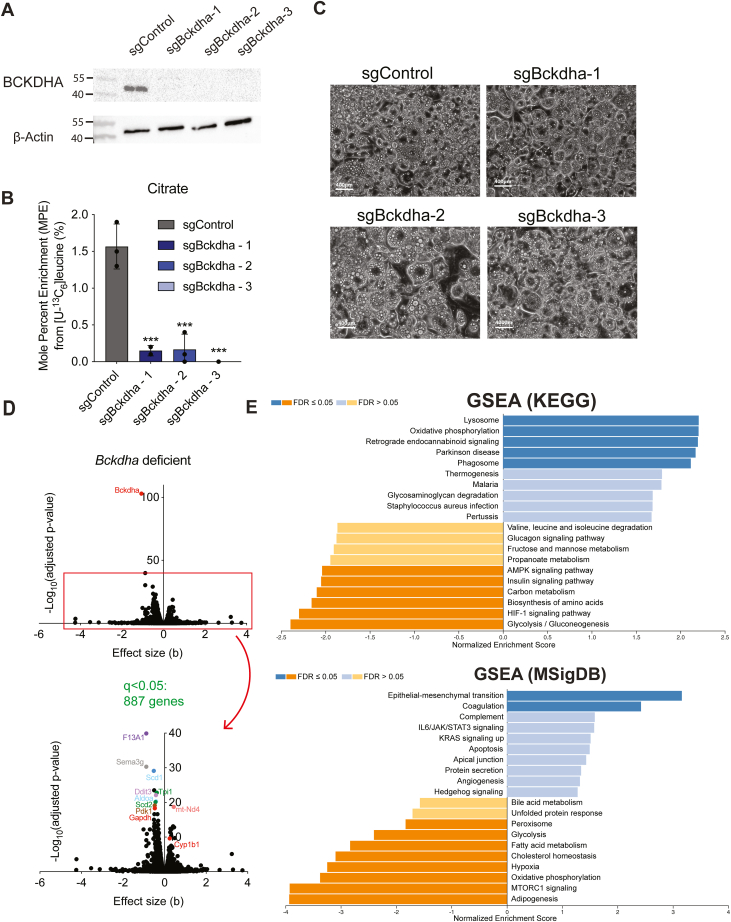
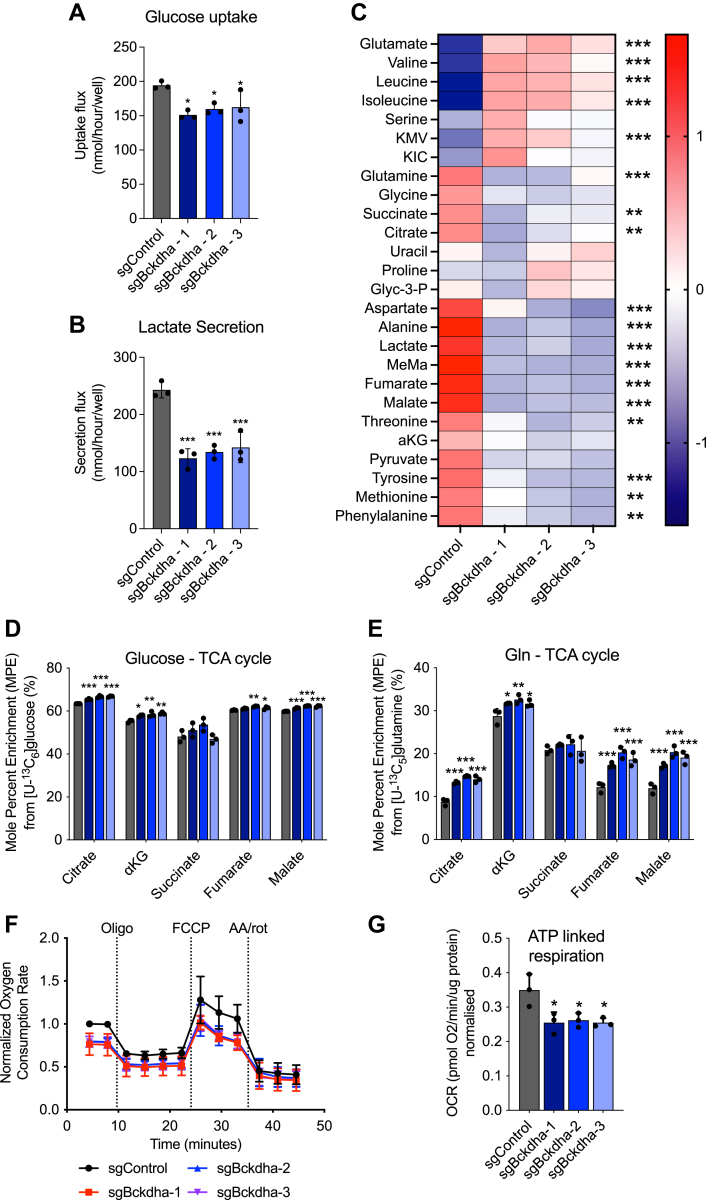
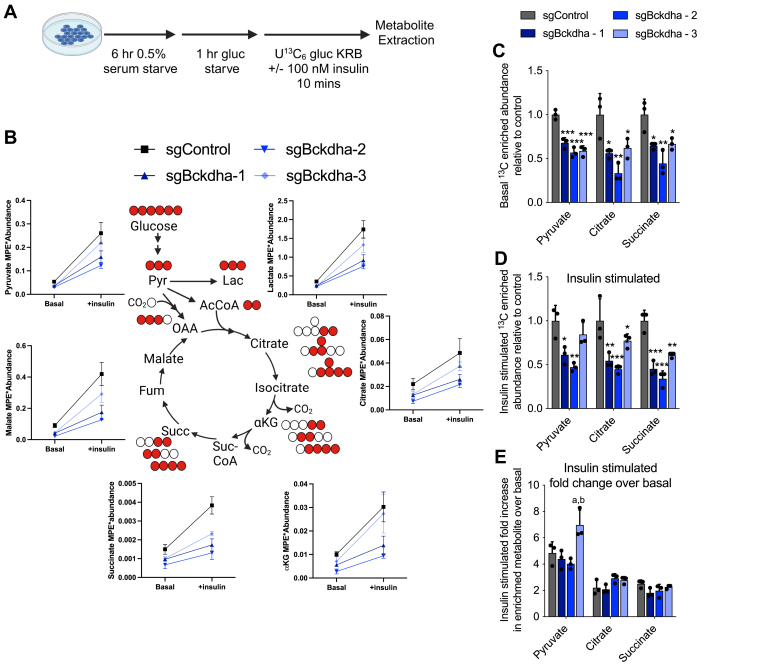
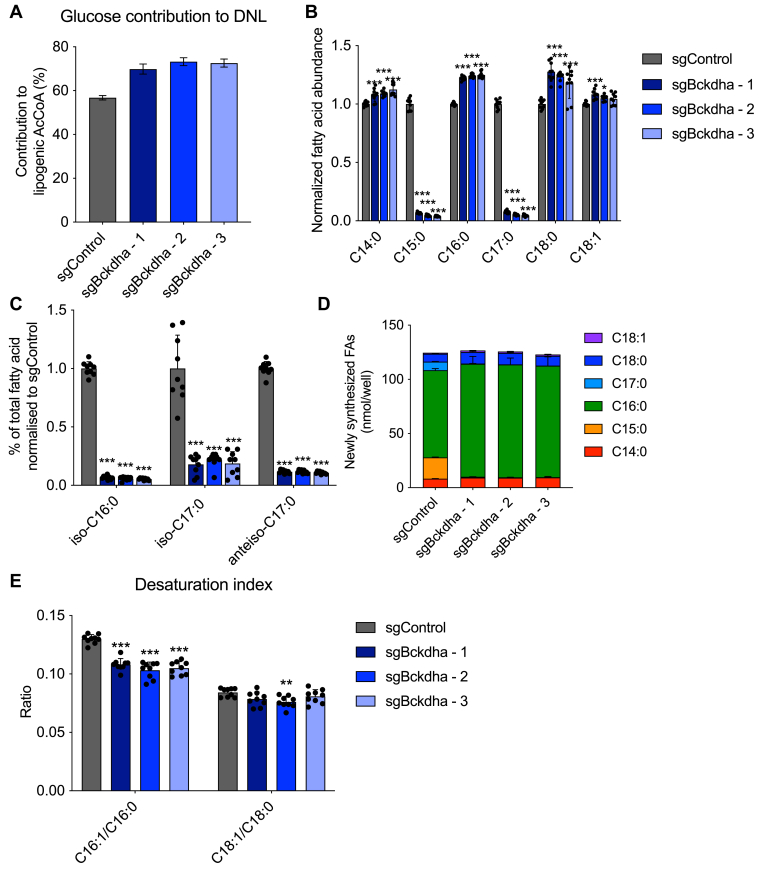
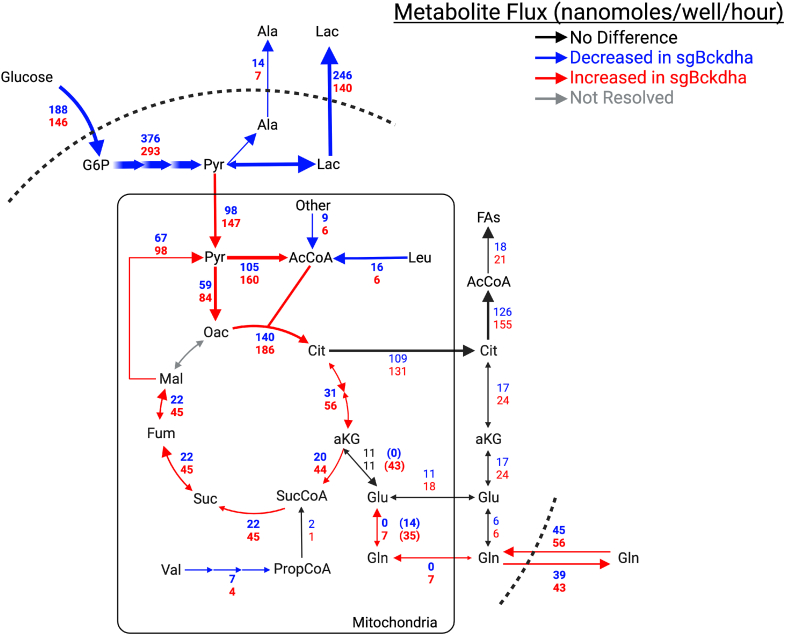
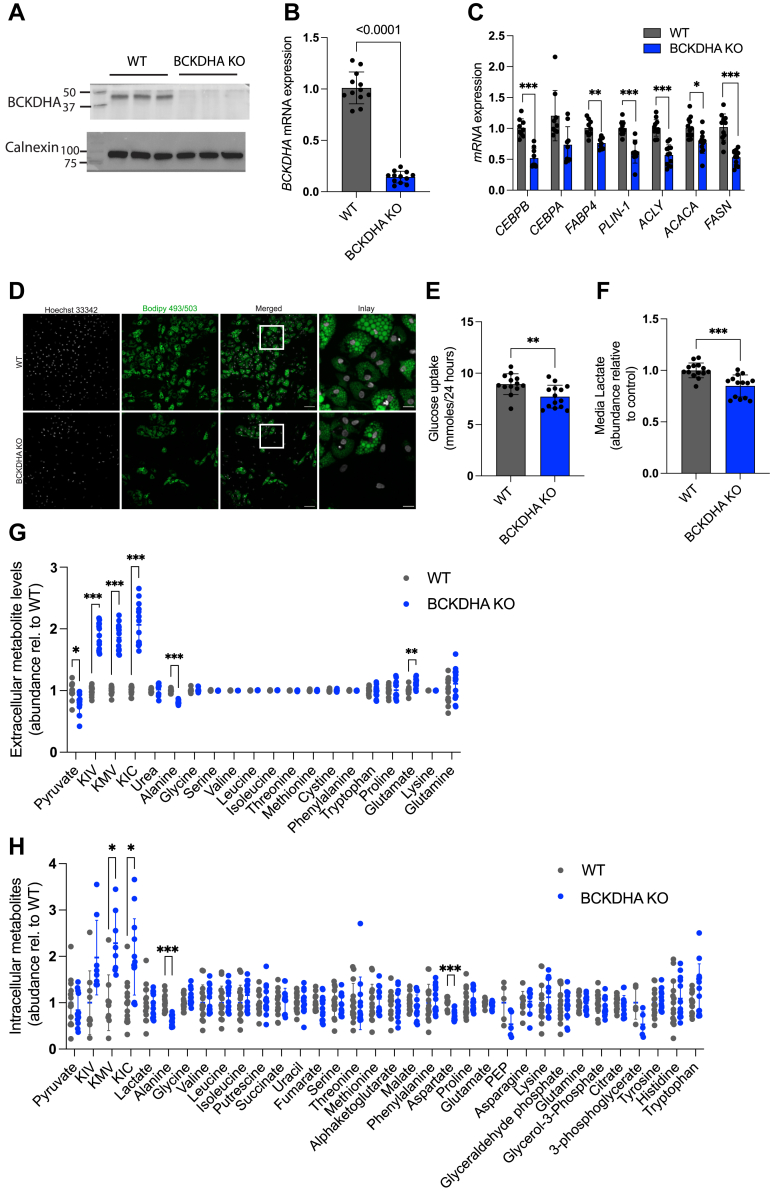
Dysregulated branched-chain amino acid (BCAA) metabolism has emerged as a key metabolic feature associated with the obese insulin-resistant state, and adipose BCAA catabolism is decreased in this context. BCAA catabolism is upregulated early in adipogenesis, but the impact of suppressing this pathway on the broader metabolic functions of the resultant adipocyte remains unclear. Here, we use CRISPR/Cas9 to decrease BCKDHA in 3T3-L1 and human pre-adipocytes, and ACAD8 in 3T3-L1 pre-adipocytes to induce a deficiency in BCAA catabolism through differentiation. We characterize the transcriptional and metabolic phenotype of 3T1-L1 cells using RNAseq and 13C metabolic flux analysis within a network spanning glycolysis, tricarboxylic acid (TCA) metabolism, BCAA catabolism, and fatty acid synthesis. While lipid droplet accumulation is maintained in Bckdha-deficient adipocytes, they display a more fibroblast-like transcriptional signature. In contrast, Acad8 deficiency minimally impacts gene expression. Decreased glycolytic flux emerges as the most distinct metabolic feature of 3T3-L1 Bckdha-deficient cells, accompanied by a ∼40% decrease in lactate secretion, yet pyruvate oxidation and utilization for de novo lipogenesis is increased to compensate for the loss of BCAA carbon. Deletion of BCKDHA in human adipocyte progenitors also led to a decrease in glucose uptake and lactate secretion; however, these cells did not upregulate pyruvate utilization, and lipid droplet accumulation and expression of adipocyte differentiation markers was decreased in BCKDH knockout cells. Overall our data suggest that human adipocyte differentiation may be more sensitive to the impact of decreased BCKDH activity than 3T3-L1 cells and that both metabolic and regulatory cross-talk exist between BCAA catabolism and glycolysis in adipocytes. Suppression of BCAA catabolism associated with metabolic syndrome may result in a metabolically compromised adipocyte.

Keywords: adipogenesis; adipose; branched chain amino acids; glycolysis; metabolic flux.


Conflict of interest statement

Conflict of interest The authors declare that they have no conflicts of interest with the contents of this article.

Figures

Figure 1
Figure 1
Bckdha deficient adipocytes maintain lipid droplet formation but display a metabolically compromised transcriptional profile. Characterization of sgControl and sgBckdha adipocytes 7 days post-induction of differentiation. A, Western blot of BCKDHA levels. B, brightfield images (scale bar = 400 μm). C, Mole percent enrichment of citrate from [U-13C6]leucine (means ± SEM, n = 3, analysed via one-way ANOVA with Tukeys post hoc analysis, ∗∗∗p < 0.001 from post hoc analysis when compared to sgControl.). D, Volcano plots of differentially expressed genes in Bckdha-deficient adipocytes compared to Control adipocytes. E, gene set enrichment analysis of Bckdha-deficient adipocytes generated using WEB-based GEne SeT AnaLysis Toolkit (WebGestalt). AC, results are depicted from one representative experiment which was repeated independently at least three times.
Figure 2
Figure 2
Bckdha deficient adipocytes reprogram central carbon metabolism.A, molar amount of glucose uptake in Control or Bckdha-deficient adipocytes over 48 h. B, molar amount of lactate secretion in Control or Bckdha-deficient adipocytes over 48 h. C, heat map of the abundance of intracellular metabolites in Bckdha-deficient adipocytes, statistical analysis via one-way ANOVA (9 cellular replicates). FDR∗<0.05, ∗∗<0.01, ∗∗∗<0.001. D, mole percent enrichment (MPE) of TCA cycle intermediates after 48 h of incubation with [U-13C6]glucose. E MPE of TCA cycle intermediates after 48 h of incubation with [U-13C5]glutamine. F, normalized oxygen consumption rate of 3T3-L1 Control or Bckdha-deficient adipocytes treated with the indicated pharmacological inhibitors (n = 3 experiments internally normalized to sgControl). G, ATP-linked respiration (n = 3 individual experiments internally normalized to sgControl). A, B, D and E, data are presented as means ± SD with three cellular replicates. Results are depicted from one representative experiment which was repeated independently at least three times. (A, B, DG) One-way ANOVA with Tukeys post hoc analysis for comparison of each groups means. Significance in all is from post hoc analysis and compared to sgControl. ∗p < 0.05, ∗∗p < 0.01, ∗∗∗p < 0.001.
Figure 3
Figure 3
Insulin-stimulated glucose uptake in Bckdha deficient cells.A, schematic of experimental design. BD, levels of 13C enriched metabolite from [U-13C6]glucose in cells under basal and insulin-stimulated conditions. E, fold increase in 13C enriched metabolite between basal and insulin-stimulated conditions. Data are presented as means ± SD with three cellular replicates. One-way ANOVA with Tukey post hoc analysis for comparison of each group means. ∗p < 0.05, ∗∗p < 0.01, ∗∗∗p < 0.001 indicates comparison to sgControl. ap < 0.05 indicates comparison to sgBckdha-1 and bp < 0.05 indicates comparison to sgBckdha-2.
Figure 4
Figure 4
Bckdha deficiency alters lipogenic acetyl-CoA sourcing and fatty acid diversity.A, contribution of [U-13C6]glucose to the lipogenic AcCoA pool used for de novo lipogenesis (DNL) as determined via ISA. B, relative fold change in total odd- and even-straight-chain fatty acids in Bckdha-deficient 3T3-L1 adipocytes normalized to Control adipocytes. C, relative fold change in total branched-chain fatty acids (BCFAs) in Bckdha-deficient 3T3-L1 adipocytes normalized to Control adipocytes. D, molar amount of indicated fatty acids synthesized over 48 h obtained by combining individual FA DNL values with pool size. E, desaturation index in Control and Bckdha-deficient 3T3-L1 adipocytes. Data are presented as means ± SD (BD), means with 95% confidence interval (C.I.) (A), and means ± SEM (E) with three cellular replicates. Each parameter was analysed via one-way ANOVA with Tukeys post hoc analysis except A, where significance is denoted as non-overlapping 95% C.I. Significance in all is compared to sgControl. Results are depicted from one representative experiment which was repeated independently at least three times. ∗p < 0.05, ∗∗p < 0.01, ∗∗∗p < 0.001.
Figure 5
Figure 5
Metabolic flux analysis reveals significant reprogramming of glycolysis and TCA metabolism. Map of core MFA model. Values are presented as net flux (exchange flux). The blue text is sgControl, red text is sgBckdha. Blue arrows indicate a flux is decreased in sgBckdha compared to sgControl, while a red arrow indicates an increase in flux in sgBckdha. Bold text indicates significantly different reactions.
Figure 6
Figure 6
BCKDH deficiency impacts differentiation and glycolytic flux in human adipocytes. Characterization of control (WT) and BCKDHA knock-out (KO) human adipocytes. A, Western blot of BCKDHA (three cellular replicates). B, gene expression of BCKDHA (12 cellular replicates) C, gene expression of differentiation markers (9-12 cellular replicates). D, bodipy staining of lipid droplets. Scale bars, 100 μm and 25 μm (inlay). E, Glucose uptake (13 cellular replicates). F and G Extracellular lactate (14 cellular replicates) and metabolite levels (13 cellular replicates) in media following 24 h of culture. H, intracellular metabolite levels 24 h post media change (14 cellular replicates). Data are presented as means ± SD. For A and D, results are depicted from one representative experiment which was repeated independently at least two-three times. For (BC) and (EH), all cellular replicates were collected over two-three separate differentiation rounds. Two-tailed students t test was used to test significant differences in (BC) and (EH). Multiple unpaired t-tests with correction for multiple comparison using the Holm-Sidak method was used in (GH). ∗p < 0.05, ∗∗p < 0.01, ∗∗∗p < 0.001.

References

    1. Newgard C.B., An J., Bain J.R., Muehlbauer M.J., Stevens R.D., Lien L.F., et al. A branched-chain amino acid-related metabolic signature that differentiates obese and lean humans and contributes to insulin resistance. Cell Metab. 2009;9:311–326. - PMC - PubMed
    1. Wang T.J., Larson M.G., Vasan R.S., Cheng S., Rhee E.P., McCabe E., et al. Metabolite profiles and the risk of developing diabetes. Nat. Med. 2011;17:448–453. - PMC - PubMed
    1. Guasch-Ferré M., Hruby A., Toledo E., Clish C.B., Martínez-González M.A., Salas-Salvadó J., et al. Metabolomics in prediabetes and diabetes: a systematic review and meta-analysis. Diabetes Care. 2016;39:833–846. - PMC - PubMed
    1. Lackey D.E., Lynch C.J., Olson K.C., Mostaedi R., Ali M., Smith W.H., et al. Regulation of adipose branched-chain amino acid catabolism enzyme expression and cross-adipose amino acid flux in human obesity. Am. J. Physiol. Endocrinol. Metab. 2013;304:87. - PMC - PubMed
    1. Boulet M.M., Chevrier G., Grenier-Larouche T., Pelletier M., Nadeau M., Scarpa J., et al. Alterations of plasma metabolite profiles related to adipose tissue distribution and cardiometabolic risk. Am. J. Physiol. Endocrinol. Metab. 2015;309:E736–E746. - PubMed

Publication types

Substances

Associated data