. 2024 Nov 18;43(1):303.
doi: 10.1186/s13046-024-03224-3.

The KLF16/MYC feedback loop is a therapeutic target in bladder cancer

Affiliations

The KLF16/MYC feedback loop is a therapeutic target in bladder cancer

Lisi Zheng et al. J Exp Clin Cancer Res. .

Abstract

Background: Bladder cancer (BLCA) is a common malignancy characterized by dysregulated transcription and a lack of effective therapeutic targets. In this study, we aimed to identify and evaluate novel targets with clinical potential essential for tumor growth in BLCA.

Methods: CRISPR-Cas9 screening was used to identify transcription factors essential for bladder cancer cell viability. The biological functions of KLF16 in bladder cancer were investigated both in vitro and in vivo. The regulatory mechanism between KLF16 and MYC was elucidated through a series of analyses, including RNA sequencing, quantitative polymerase chain reaction (qPCR), RNA immunoprecipitation, Western blotting, Mass spectrometry, Dual-luciferase reporter assays, Cleavage Under Targets and Tagmentation (CUT&Tag) sequencing, OptoDroplets assays, and RNA stability assay. The clinical relevance of KLF16 and MYC in bladder cancer was evaluated through analyses of public databases and immunohistochemistry.

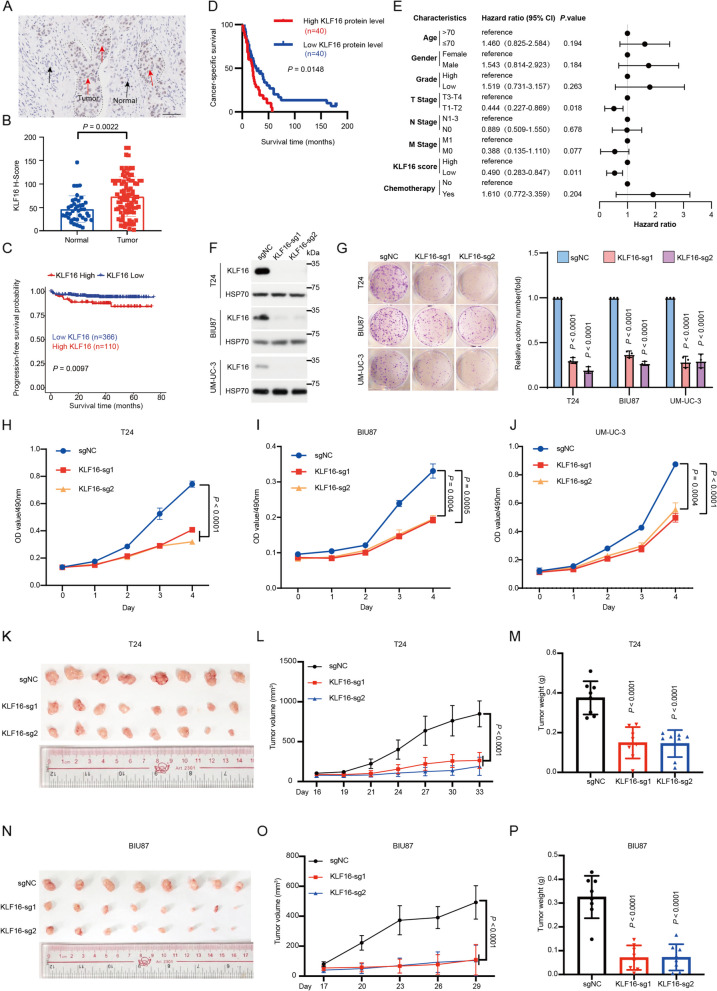
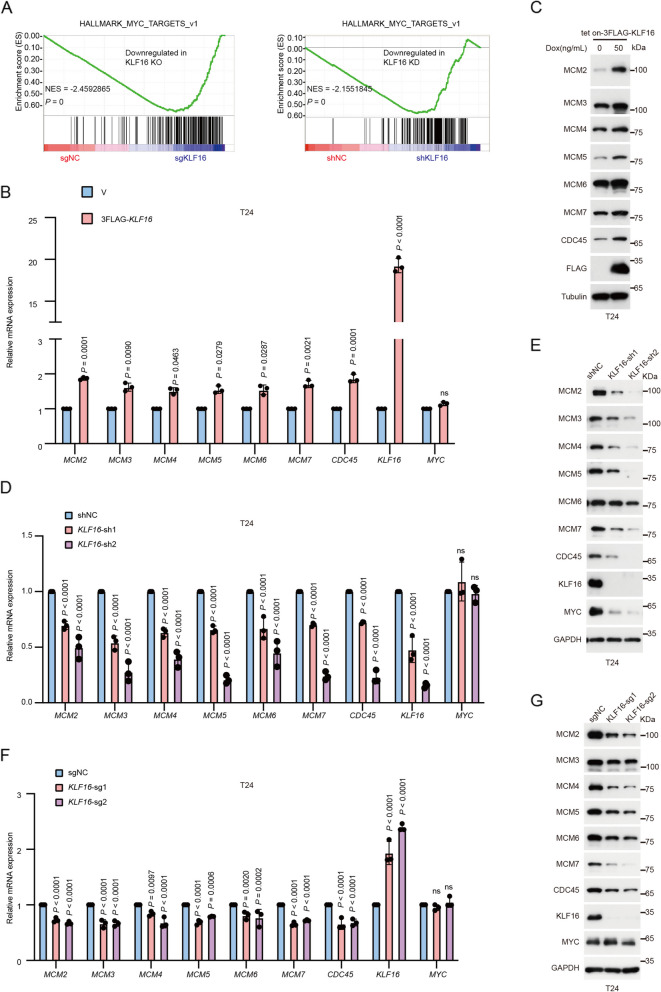
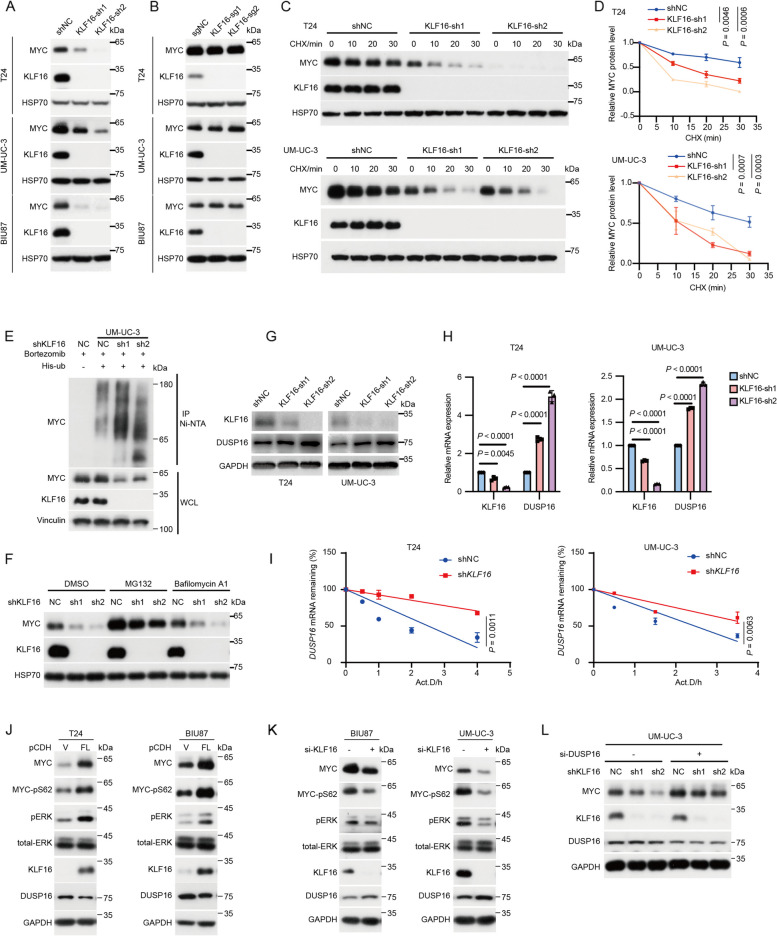
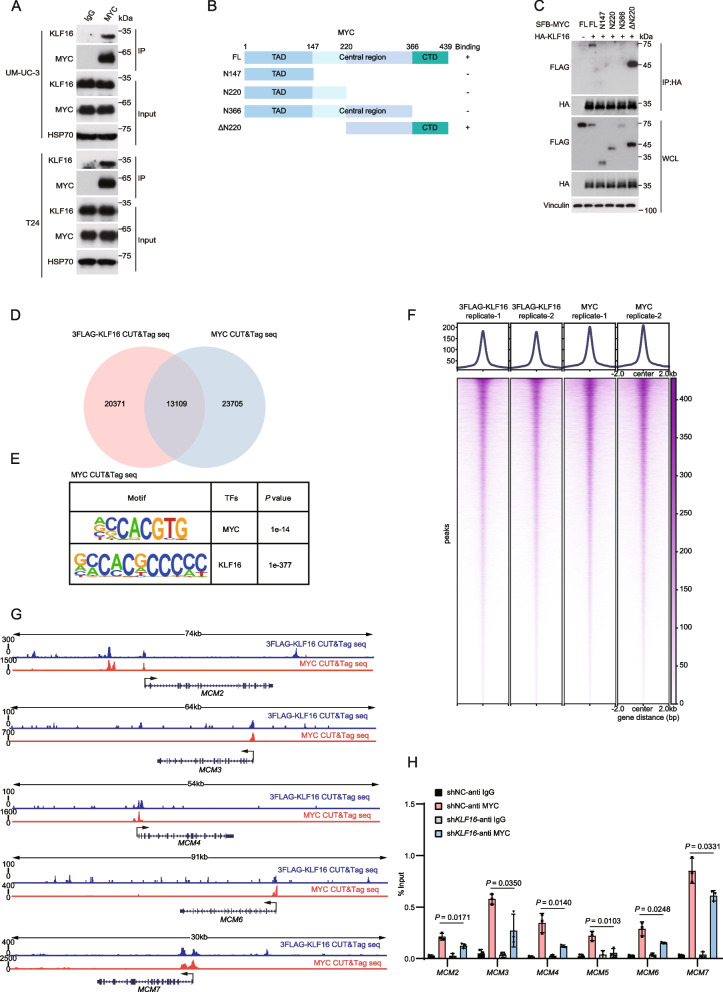
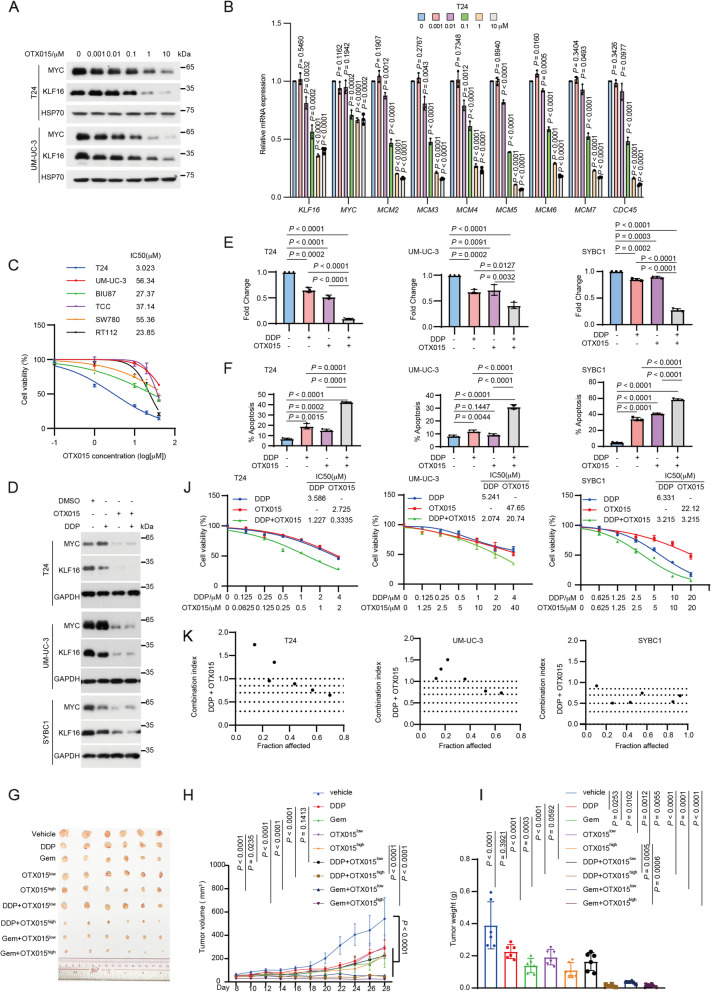
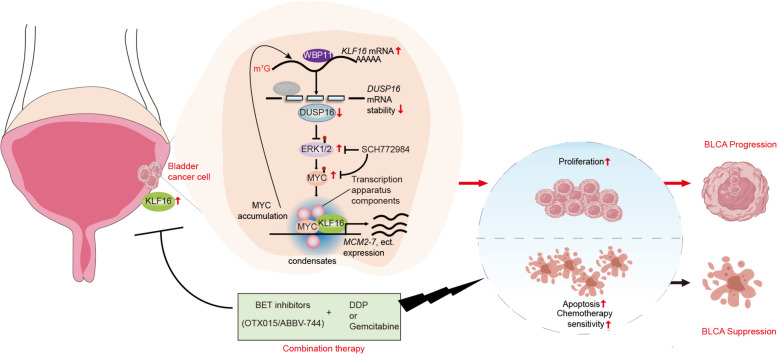
Results: Krüppel-like factor 16 (KLF16) was essential for BLCA cell viability. Elevated expression of KLF16 was observed in bladder cancer tissues, and higher expression levels of KLF16 were correlated with poor progression-free survival (PFS) and cancer-specific survival (CSS) probabilities in BLCA patients. Mechanistically, KLF16 mRNA competed with the mRNA of dual-specificity phosphatase 16 (DUSP16) for binding to the RNA-binding protein, WW domain binding protein 11 (WBP11), resulting in destabilization of the DUSP16 mRNA. This, in turn, led to activation of ERK1/2, which stabilized the MYC protein. Furthermore, KLF16 interacted with MYC to form nuclear condensates, thereby enhancing MYC's transcriptional activity. Additionally, MYC transcriptionally upregulated KLF16, creating a positive feedback loop between KLF16 and MYC that amplified their oncogenic functions. Targeting this loop with bromodomain inhibitors, such as OTX015 and ABBV-744, suppressed the transcription of both KLF16 and MYC, resulting in reduced BLCA cell viability and tumor growth, as well as increased sensitivity to chemotherapy.

Conclusions: Our study revealed the crucial role of the KLF16/MYC regulatory axis in modulating tumor growth and chemotherapy sensitivity in BLCA, suggesting that combining bromodomain inhibitors, such as OTX015 or ABBV-744, with DDP or gemcitabine could be a promising therapeutic intervention for BLCA patients.

Keywords: BET inhibitors; Bladder cancer; Chemotherapy sensitivity; KLF16; MYC.


Conflict of interest statement

Declarations Ethics approval and consent to participate This study received approval from the Ethics Committee of Sun Yat-sen University Cancer Center (SYSUCC; Approval No. B2023-168–01). Animal experiments were conducted in strict compliance with the Guide for the Care and Use of Laboratory Animals and the Principles for the Utilization and Care of Vertebrate Animals. Approval for the animal experiments was obtained from the Animal Research Committee of SYSUCC (No. L102012019120I). Consent for publication Not applicable. Competing interests The authors declare that they have no competing interests.

Figures

Fig. 1
Fig. 1
KLF16 promotes tumor growth in BLCA. A Representative immunohistochemical images of KLF16 in the human BLCA tissue microarray. Scale bar, 100 μm. B Beeswarm plot graph of KLF16 expression in BLCA and adjacent noncancerous tissues used in (A). C Progression-free survival curves were generated based on the mRNA levels of KLF16 in BLCA tissues. Data from R2 database: Genomics Analysis and Visualization Platform (http://r2.amc.nl). P value was determined by Kaplan–Meier method and compared with the log-rank test. D Cancer-specific survival curves were generated based on the protein levels of KLF16 in the 80 paraffin-embedded BLCA tissues. The P value was determined by Kaplan–Meier method and compared with the log-rank test. E Forest plot of multivariate Cox analysis in BLCA tissues used in (D). F Western blotting of the indicated proteins in T24, BIU87 and UM-UC-3 cells expressing KLF16-targeted sgRNAs. G Representative images (left) and quantification (right) of colonies formed by the indicated BLCA cells used in (F). The colony numbers were quantified using ImageJ software. n = 3 biologically independent experiments. H-J Cell viability of the indicated stable cells in (F) was measured by MTT assay at the indicated time points. n = 3 biologically independent experiments. K-P T24 and BIU87 cells expressing KLF16-targeted sgRNAs were subcutaneously injected into nude mice. Representative images of subcutaneous xenograft tumors were shown (K and N). Tumor volumes were measured at the indicated time points (L and O). Tumor weight was measured at the end point (M and P). n = 8 nude mice per group. All error bars represent mean ± SD. P values in B, G-J, M and P were calculated using two-tailed unpaired Student’s t-tests. P values in C-E was determined by the log-rank test. P values in L and O were calculated by two-way ANOVA with Tukey’s multiple comparisons test
Fig. 2
Fig. 2
KLF16 depletion attenuates MYC activity in BLCA. A GSEA plots evaluating the changes in MYC-targeted gene expression signature upon KLF16 KO (left) or KD (right). NES, normalized enrichment score. KO, knockout; KD, knockdown. B, D, F qPCR analyzing the mRNA levels of MCM2-7 and CDC45 in T24 cells stably expressing empty vector (V) or 3FLAG-KLF16 (B) and negative control (NC) or shKLF16 (D) or sgKLF16 (F). ns, not significant. n = 3 biologically independent experiments. C, E, G Western blotting assay for the levels of the indicated proteins in the indicated stable cells. All error bars represent mean ± SD and P values in B, D, F were calculated using two-tailed unpaired Student’s t-tests
Fig. 3
Fig. 3
KLF16 mRNA stabilizes MYC protein via destabilizing DUSP16 mRNA in BLCA. A-B Western blotting assay for the levels of the indicated proteins in the indicated BLCA cells stably expressing KLF16-targeted shRNAs (A) or sgRNAs. (B) C-D T24 and UM-UC-3 cells stably expressing KLF16-targeted shRNAs were treated with 20 μg mL−1 cycloheximide (CHX) at the indicated time points and then analyzed by Western blotting (C). Quantitation of MYC protein levels was based on the Western blotting results (D). n = 3 biologically independent experiments. E UM-UC-3 cells stably expressing KLF16-targeted shRNAs transfected with His-ub for 24 h were incubated with 1 μM bortezomib for 8 h, and then subjected to IP using Ni-NTA beads followed by Western blotting. Ni-NTA, nitrilotriacetic acid; WCL, whole cell lysate. F T24 cells stably expressing KLF16-targeted shRNAs were treated with DMSO, 10 μM MG132 or 1 μM Bafilomycin A1 for 8 h, and then subjected to Western blotting. G-H T24 and UM-UC-3 cells stably expressing KLF16-targeted shRNAs were analyzed by Western blotting (G) and qPCR (H). n = 3 biologically independent experiments. I The indicated stable cells in (G) were treated with 10 μg mL−1 actinomycin D (Act.D) at the indicated time points. Total RNA was prepared and DUSP16 mRNA expression was analyzed by qPCR. The transcript remaining is defined as relative expression at the indicated times compared with the expression level at 0 h. J T24 and BIU87 cells stably overexpression of KLF16 full-length mRNA were analyzed by Western blotting. FL, full-length. K BIU87 and UM-UC-3 cells transfected with KLF16-targeted siRNAs for 48 h were analyzed by Western blotting. L UM-UC-3 cells stably knockdown of KLF16 were transfected with DUSP16-targeted siRNAs for 48 h and then were analyzed by Western blotting. All error bars represent mean ± SD and P values were calculated using two-tailed unpaired Student’s t-tests
Fig. 4
Fig. 4
KLF16 mRNA negatively regulates DUSP16 mRNA stability by competitively binding to WBP11. A Schematics of the RNA–protein interaction detection system. boxB RNA stem-loops (purple) flank KLF16 full-length mRNA (red). λN-HA-TurboID fusion protein binding to boxB sites leads to biotinylation of proteins proximal to inserted KLF16 mRNA sequence in living cells grown in biotin-containing media. Streptavidin (S) beads capture biotinylated protein for mass spectrometry. RBP, RNA binding protein. B The scatter plot shows the Pearson correlation of WBP11 and DUSP16 mRNA expression in bladder tissues. Data from Gene Expression Profiling Interactive Analysis database (GEPIA): http://gepia.cancer-pku.cn/index.htmlP value was determined by the log-rank test and the R-value was analyzed using Spearman's correlation test. R, Spearman correlation coefficient. C-D T24 (C) and 5637 (D) cells stably overexpression of SFB-WBP11 were analyzed by qPCR (left) and Western blotting (right). E T24 cells stably overexpression of SFB-WBP11 were treated with 10 μg mL−1 actinomycin D (Act.D) at the indicated time points. Total RNA was prepared and DUSP16 mRNA expression was analyzed by qPCR. The transcript remaining was defined as relative expression at the indicated times compared with the expression level at 0 h. n = 3 biologically independent experiments. F RIP assay with WBP11 antibody and IgG was performed using T24 lysates and subsequently subjected to qPCR analysis for the indicated RNAs (left). IP enrichment was determined with WBP11 antibody and IgG (right). G-H T24 cells stably overexpression of KLF16 FL mRNA (G) or UM-UC-3 cells stably knockdown of KLF16 (H) were harvested for RIP assay with WBP11 antibody and IgG. Binding of WBP11 to the indicated RNA targets was determined by qPCR. n = 3 biologically independent experiments. I Proposed model of KLF16 mRNA destabilizes DUSP16 mRNA via competitively binding with WBP11. All error bars represent mean ± SD and P values were calculated using two-tailed unpaired Student’s t-tests unless noted otherwise
Fig. 5
Fig. 5
KLF16 and MYC colocalize on chromatin, and KLF16 facilitates MYC binding to target gene promoters. A Endogenous KLF16 was immunoprecipitated with endogenous MYC in UM-UC-3 and T24 cells. IP was performed with anti-IgG or anti-MYC antibody. IP, immunoprecipitation. B Schematic of SFB-MYC truncations used for co-IP assays in (C). C HEK293T cells were co-transfected with the indicated plasmids and then were analyzed by immunoprecipitation using anti-HA beads followed by Western blotting. D-E Venn diagram (D) and HOMER motif analysis (E) of 3FLAG-KLF16 and MYC CUT&Tag sequencing binding regions. F Heat map of the binding pattern of 3FLAG-KLF16 and MYC. kb, kilobases; FDR, false discovery rate. G Track view of 3FLAG-KLF16 and MYC CUT&Tag sequencing density profile on MCM2, MCM3, MCM4, MCM6 and MCM7 genomic regions in T24 cells displayed by Integrative Genomics Viewer (IGV) software. H ChIP-qPCR analysis of MYC occupancy at the indicated gene promoter regions in T24 cells stably expressing shKLF16 using IgG or anti-MYC antibody. All error bars represent mean ± SD and P values in (H) were calculated using two-tailed unpaired Student’s t-tests
Fig. 6
Fig. 6
KLF16 forms nuclear condensates with MYC, thereby enhancing the MYC’s transcriptional activity in BLCA. A Condensate formation was analyzed in T24 cells transfected with the indicated plasmids. B T24 cells were transfected with KLF16-mCherry-Cry2 and MYC-mEGFP-Cry2 separately or together. Images were collected after illumination by a 488 nm laser at the indicated times. C Confocal microscopy images of representative condensates in T24 cells co-transfected with the indicated plasmids and stained with the indicated antibodies (left). The corresponding line scan analyses are plotted on the right. D qPCR analyzing the mRNA levels of MCM2-7 and CDC45 in UM-UC-3 cells transient expressing KLF16-mCherry and MYC-mEGFP separately or together. n = 3 biologically independent experiments. E SIM analysis of endogenous KLF16 and MYC localization in the indicated cells with anti-KLF16 and anti-MYC antibody. Hoechst 33,342 (prepared in PBS) was used to stain nuclei. F Representative immunofluorescence images of nuclear condensates analyzed in tissue samples from bladder patients by co-stained with anti-KLF16 and anti-MYC as indicated. Patient numbers were shown. The experiments in A, B, C, E were repeated three times with similar results. All error bars represent mean ± SD and P values were calculated using two-tailed unpaired Student’s t-tests
Fig. 7
Fig. 7
MYC transcriptionally upregulates KLF16. A The scatter plot shows the Pearson correlation of MYC and KLF16 mRNA expression in BLCA tissues. Data from GEPIA database: http://gepia.cancer-pku.cn/index.html . P value was determined by the log-rank test and the R-value was analyzed using Spearman's correlation test. B-G The BLCA cell lines with MYC depletion or overexpression were analyzed by Western blotting (B-D) and qPCR (E–G). n = 3 biologically independent experiments. H ChIP-qPCR analysis of MYC occupancy at KLF16 promoter region in T24 cells. Neg ctrl, negative control. n = 3 biologically independent experiments. I Track view of MYC ChIP-seq density profile on KLF16 genomic region in the indicated cell lines from published data sets displayed by UCSC Genome Browser: http://genome.ucsc.edu [36] (upper panel). MYC CUT&Tag seq tracks in gene loci of KLF16 in T24 cells displayed by IGV software (lower panel). ChIP-seq data from the ENCODE database (https://www.encodeproject.org). J Schematic presentation of MYC binding sites on the KLF16 locus (left panel). T24 cells expressing SFB-MYC were transfected with the indicated wild-type (WT) or mutants of KLF16 promoter, along with the Renilla control reporter for 24 h. Then, cells were analyzed for the relative luciferase activity (right panel). MBS, MYC binding site. K Representative immunohistochemical images of both KLF16 and MYC from 80 paraffin-embedded BLCA tissues. Scale bar, 100 μm. L Crosstab shows the distribution of cancer tissues in the bladder cancer tissues used in (K) according to the median H-Score of KLF16 and MYC. The P value and chi-square were analyzed using Pearson's chi-squared test, and the R-value was analyzed using Spearman's correlation test. All error bars represent mean ± SD and P values were calculated using two-tailed unpaired Student’s t-tests unless noted otherwise
Fig. 8
Fig. 8
OTX015 suppresses tumor growth and enhances chemotherapy sensitivity in BLCA. A T24 and UM-UC-3 cells were treated with increasing concentrations of OTX015 for 48 h and then were analyzed by Western blotting. B T24 cells in (A) were subjected to qPCR analysis for the indicated mRNA levels. C The indicated bladder cancer cell lines were treated with the indicated concentration of OTX015 (0, 0.1 μM, 1 μM, 10 μM, 20 μM, 40 μM) for 48 h, and then the relative cell growth rates were determined by MTT assay. n = 3 biologically independent experiments. D-F T24, UM-UC-3 and SYBC1 cells were treated with DMSO, OTX015 (10 μM for UM-UC-3 and SYBC1, 1 μM for T24) or DDP (2.5 μM) separately or together, the indicated proteins were determined by Western blotting (D), colony formation (E) and flow cytometry analysis of apoptosis (F). n = 3 biologically independent experiments. G-I Mice bearing T24 tumors were randomly divided into the indicated groups (n = 6 mice per group). DDP (5 mg kg−1) or gemcitabine (Gem, 50 mg kg−1) were injected intraperitoneally twice weekly. OTX015 (25 mg kg−1 & 50 mg kg−1) were daily given via intragastric administration for about 3 weeks. Tumor volumes (H) and tumor weights (I) were measured. J T24, UM-UC-3 and SYBC1 cells were treated with the indicated concentration of OTX015 or DDP alone or in combination for 48 h, and then the relative cell growth rates were determined by MTT assays. n = 3 biologically independent experiments. K The Combination Index (CI) of OTX015 and DDP was calculated based on results from (J) by using CalcuSyn. CI < 1, = 1, and > 1 indicate synergism, additive effect, and antagonism, respectively. All error bars represent mean ± SD. P values in H were calculated by two-way ANOVA with Tukey’s multiple comparisons test. P values in B, E–F, I were calculated using two-tailed unpaired Student’s t-tests
Fig. 9
Fig. 9
Mechanism schematic of this study. The schematic diagram illustrates the function of KLF16/MYC loop in BLCA. In BLCA, KLF16 is overexpressed. KLF16 mRNA competes with DUSP16 mRNA for binding to WBP11, resulting in the reduction of both DUSP16 mRNA stability and DUSP16 protein levels. This, in turn, activates the ERK1/2 pathway, which stabilizes MYC protein. In contrast, inhibition of ERK1/2 by SCH772984 reduces MYC protein stability. Besides, KLF16 and MYC can form nuclear condensates that recruit transcription apparatus components, accelerating the transcription of target genes, such as MCM2-7. Meanwhile, MYC transcriptionally activates KLF16 by directly binding to the KLF16 promoter, creating the KLF16/MYC positive feedback loop. Targeting this loop with the BET inhibitors (such as OTX015 and ABBV-744) suppresses KLF16 and MYC transcription, reducing cell viability and tumor growth, as well as increasing sensitivity of BLCA cells to DDP or gemcitabine

References

    1. van Hoogstraten LMC, Vrieling A, van der Heijden AG, Kogevinas M, Richters A, Kiemeney LA. Global trends in the epidemiology of bladder cancer: challenges for public health and clinical practice. Nat Rev Clin Oncol. 2023;20(5):287–304. - PubMed
    1. Puzio-Kuter AM, Castillo-Martin M, Kinkade CW, Wang X, Shen TH, Matos T, et al. Inactivation of p53 and Pten promotes invasive bladder cancer. Genes Dev. 2009;23(6):675–80. - PMC - PubMed
    1. Cappellen D, De Oliveira C, Ricol D, de Medina S, Bourdin J, Sastre-Garau X, et al. Frequent activating mutations of FGFR3 in human bladder and cervix carcinomas. Nat Genet. 1999;23(1):18–20. - PubMed
    1. Gui Y, Guo G, Huang Y, Hu X, Tang A, Gao S, et al. Frequent mutations of chromatin remodeling genes in transitional cell carcinoma of the bladder. Nat Genet. 2011;43(9):875–8. - PMC - PubMed
    1. van Kessel KE, Zuiverloon TC, Alberts AR, Boormans JL, Zwarthoff EC. Targeted therapies in bladder cancer: an overview of in vivo research. Nat Rev Urol. 2015;12(12):681–94. - PubMed

Substances

LinkOut - more resources