

Cost-effectiveness analysis of mHealth applications for depression in Germany using a Markov cohort simulation
- PMID: 39551808
- PMCID: PMC11570631
- DOI: 10.1038/s41746-024-01324-0
Cost-effectiveness analysis of mHealth applications for depression in Germany using a Markov cohort simulation
Abstract
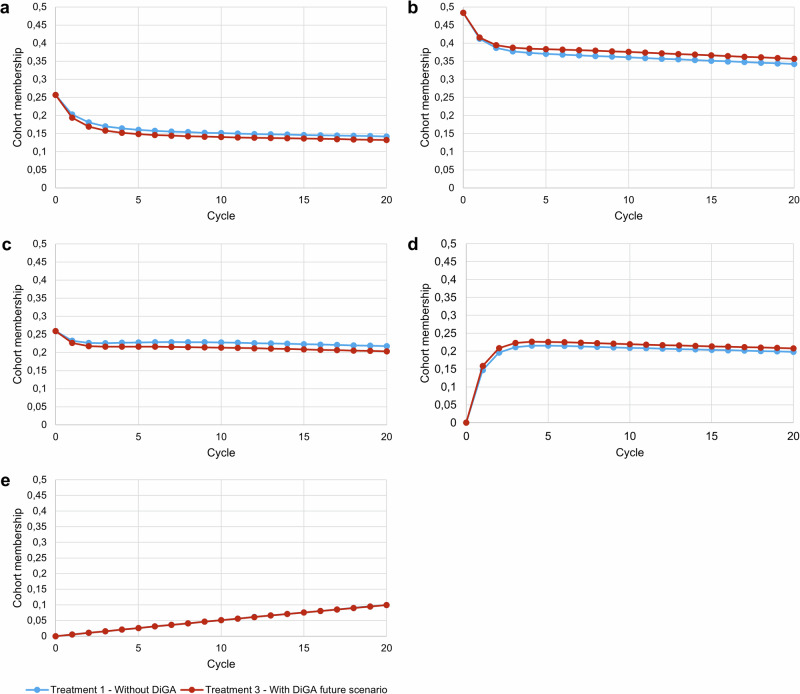
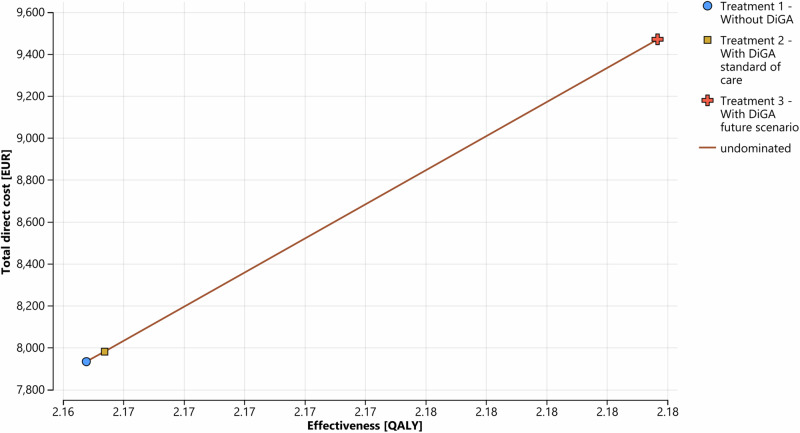
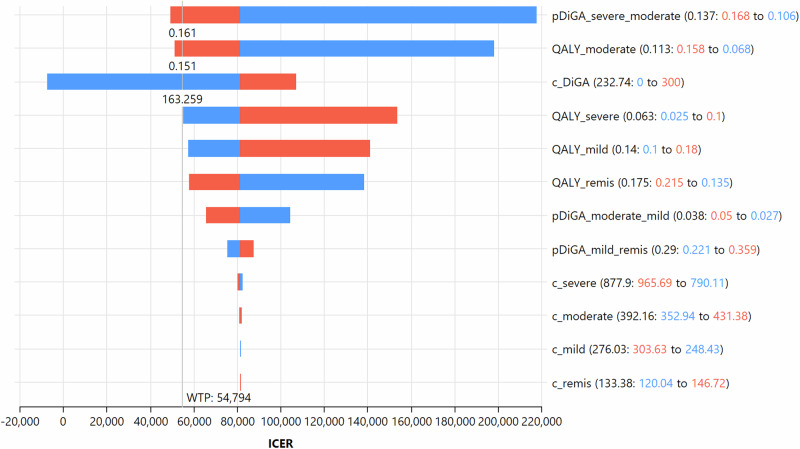
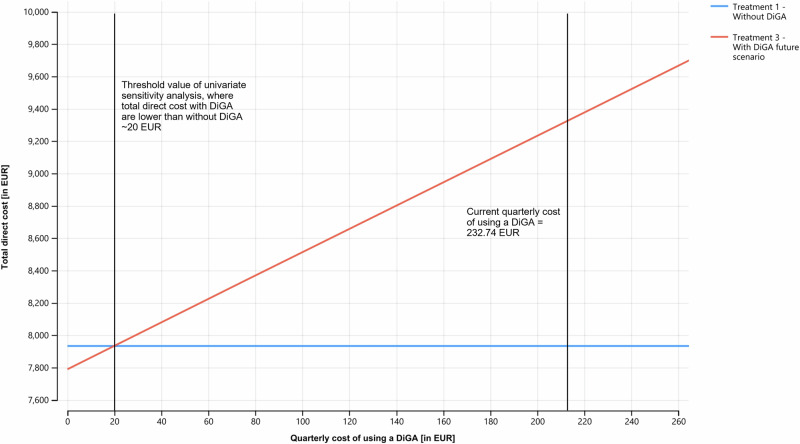
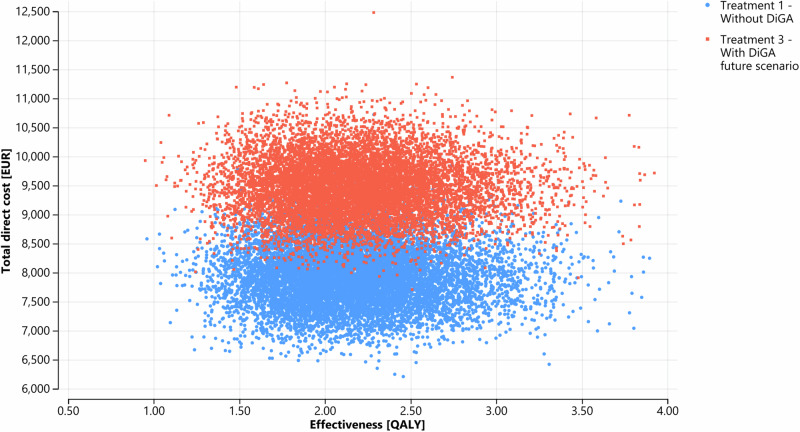
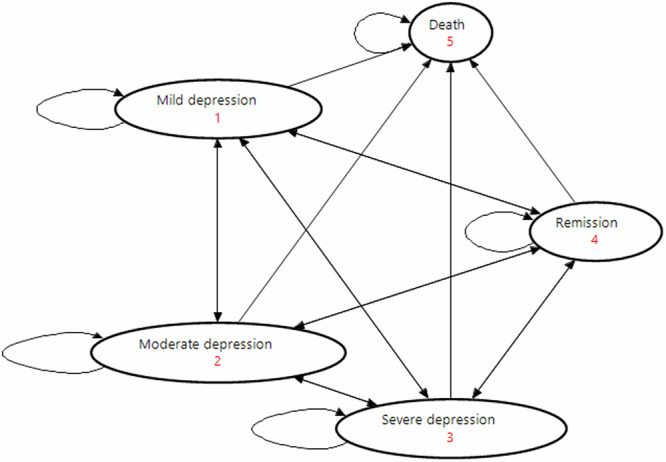
Regulated mobile health applications are called digital health applications ("DiGA") in Germany. To qualify for reimbursement by statutory health insurance companies, DiGA have to prove positive care effects in scientific studies. Since the empirical exploration of DiGA cost-effectiveness remains largely uncharted, this study pioneers the methodology of cohort-based state-transition Markov models to evaluate DiGA for depression. As health states, we define mild, moderate, severe depression, remission and death. Comparing a future scenario where 50% of patients receive supplementary DiGA access with the current standard of care reveals a gain of 0.02 quality-adjusted life years (QALYs) per patient, which comes at additional direct costs of ~1536 EUR per patient over a five-year timeframe. Influencing factors determining DiGA cost-effectiveness are the DiGA cost structure and individual DiGA effectiveness. Under Germany's existing cost structure, DiGA for depression are yet to demonstrate the ability to generate overall savings in healthcare expenditures.
© 2024. The Author(s).
Conflict of interest statement
Figures
Similar articles
-
Market access and value-based pricing of digital health applications in Germany.Cost Eff Resour Alloc. 2022 Jun 13;20(1):25. doi: 10.1186/s12962-022-00359-y. Cost Eff Resour Alloc. 2022. PMID: 35698135 Free PMC article. Review.
-
[The new approval process for the reimbursement of digital health applications (DiGA) from the perspective of the German statutory health insurance].Bundesgesundheitsblatt Gesundheitsforschung Gesundheitsschutz. 2021 Oct;64(10):1220-1227. doi: 10.1007/s00103-021-03401-1. Epub 2021 Aug 30. Bundesgesundheitsblatt Gesundheitsforschung Gesundheitsschutz. 2021. PMID: 34459939 Review. German.
-
[Structural benefits on prescription? Exploring potentials and challenges of the pSVV concept in the approval process of digital health applications in Germany].Z Evid Fortbild Qual Gesundhwes. 2025 Feb;192:1-10. doi: 10.1016/j.zefq.2024.11.003. Epub 2024 Dec 17. Z Evid Fortbild Qual Gesundhwes. 2025. PMID: 39690098 German.
-
Physicians' Attitudes Toward Prescribable mHealth Apps and Implications for Adoption in Germany: Mixed Methods Study.JMIR Mhealth Uhealth. 2021 Nov 23;9(11):e33012. doi: 10.2196/33012. JMIR Mhealth Uhealth. 2021. PMID: 34817385 Free PMC article.
-
Digital Health Applications (DiGAs) on a Fast Track: Insights From a Data-Driven Analysis of Prescribable Digital Therapeutics in Germany From 2020 to Mid-2024.J Med Internet Res. 2024 Aug 29;26:e59013. doi: 10.2196/59013. J Med Internet Res. 2024. PMID: 39208415 Free PMC article.
References
-
- Vigo, D., Thornicroft, G. & Atun, R. Estimating the true global burden of mental illness. Lancet Psychiatry3, 171–178 (2016). - PubMed
-
- World Health Organization Regional Office for Europe. WHO European Framework for Action on Mental Health 2021–2025. https://www.who.int/europe/health-topics/mental-health#tab=tab_1 (2022).
-
- Robert Koch-Institut. Gesundheit in Deutschland. Gesundheitsberichterstattung des Bundes.https://www.destatis.de/DE/Themen/Gesellschaft- (2015).
-
- Bundesministerium für Bildung und Forschung. Depression: Schatten auf der Seele.https://www.gesundheitsforschung-bmbf.de/de/depression-schatten-auf-der-... (2023).
LinkOut - more resources
Full Text Sources
Research Materials
