. 2024 Nov;14(11):e70030.
doi: 10.1002/ctm2.70030.

An AMP-activated protein kinase-PGC-1α axis mediates metabolic plasticity in glioblastoma

Affiliations

An AMP-activated protein kinase-PGC-1α axis mediates metabolic plasticity in glioblastoma

Benedikt Sauer et al. Clin Transl Med. 2024 Nov.

Abstract

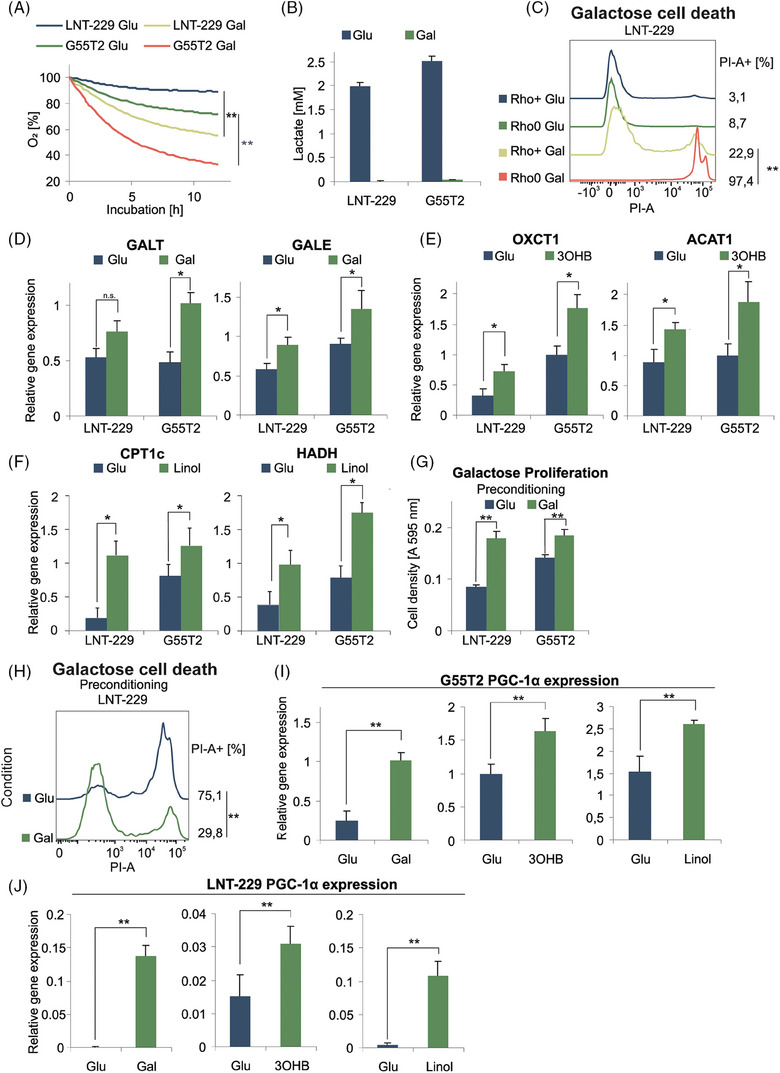
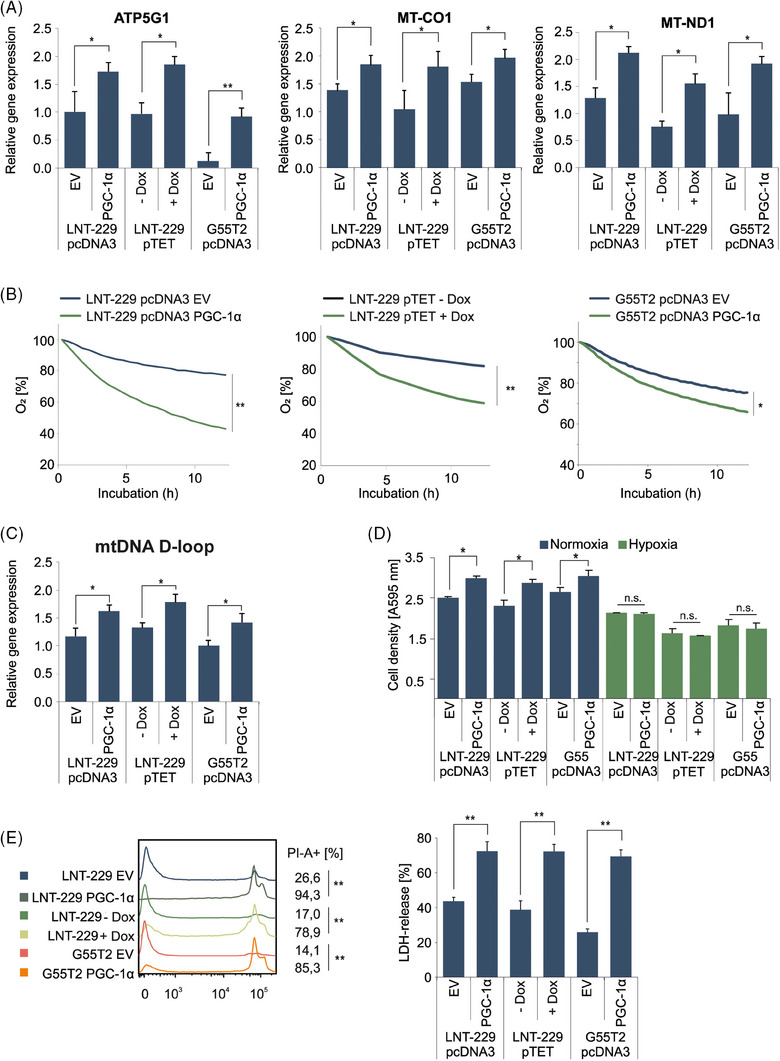
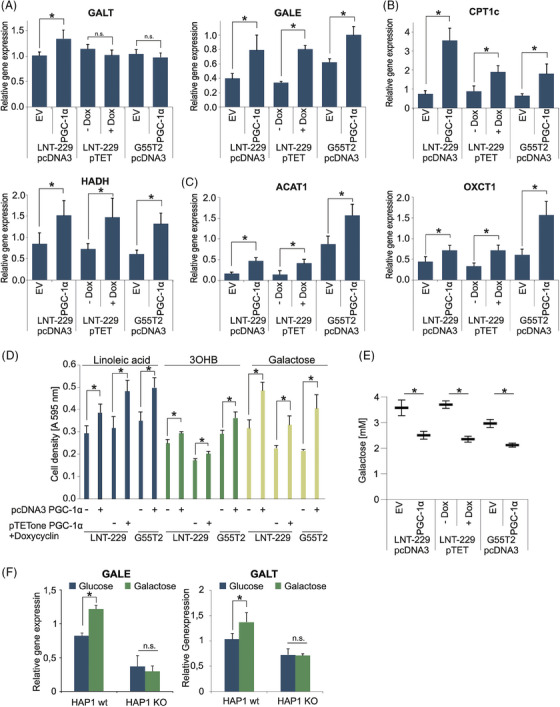
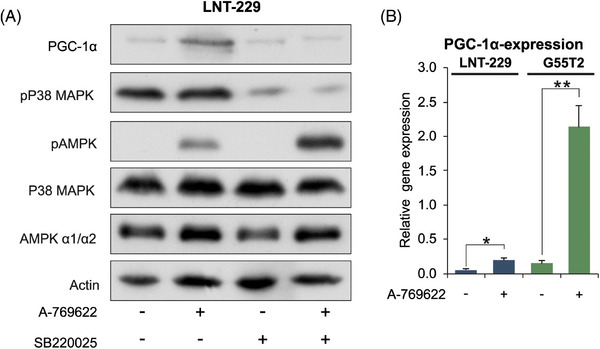
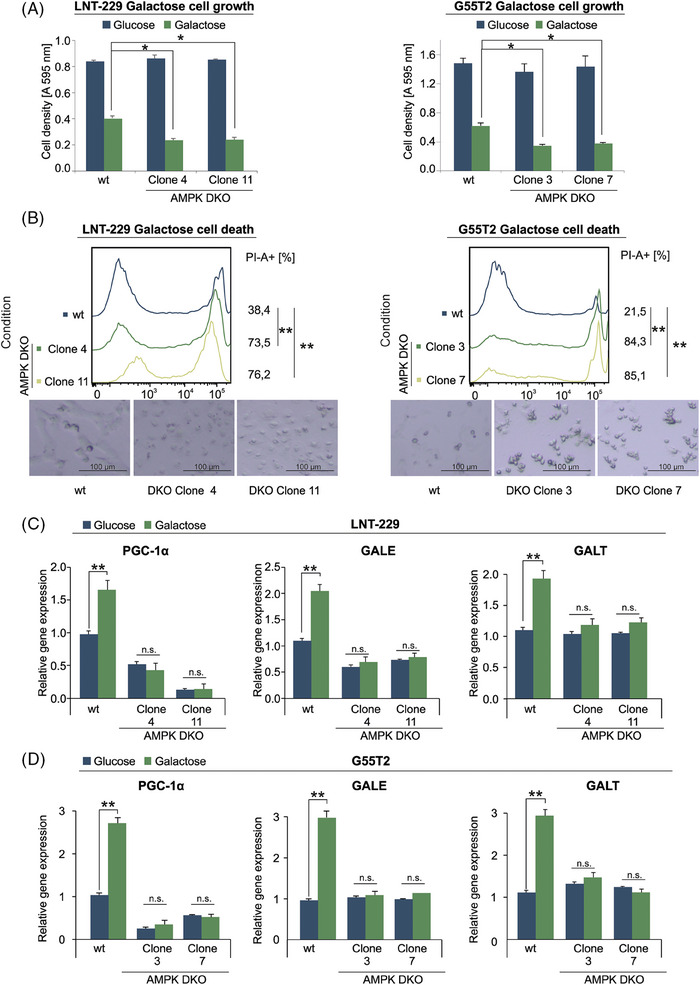
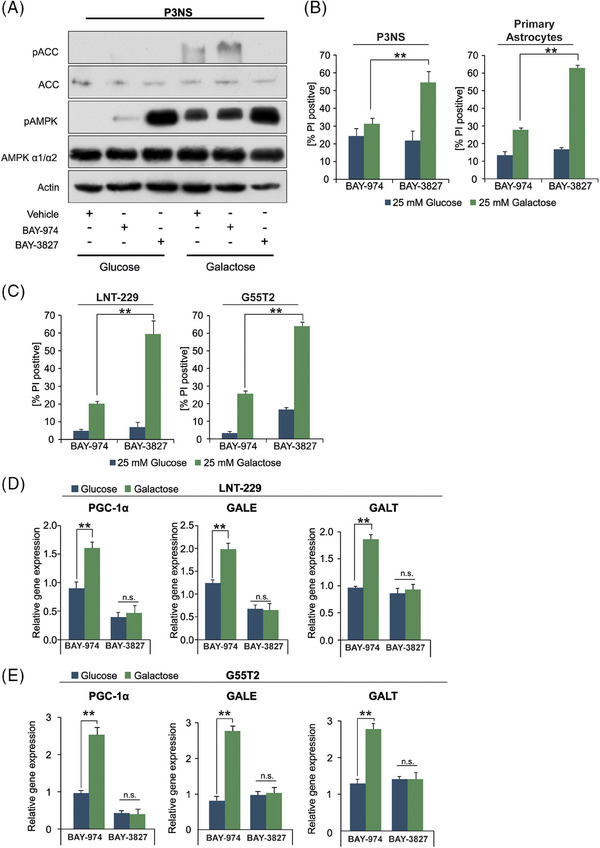
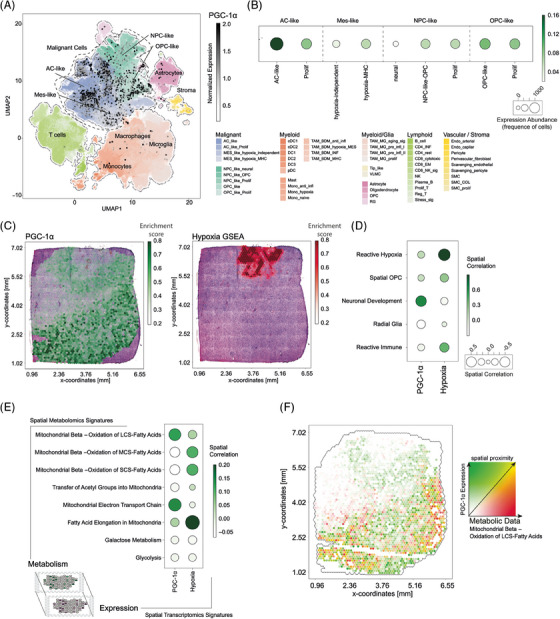
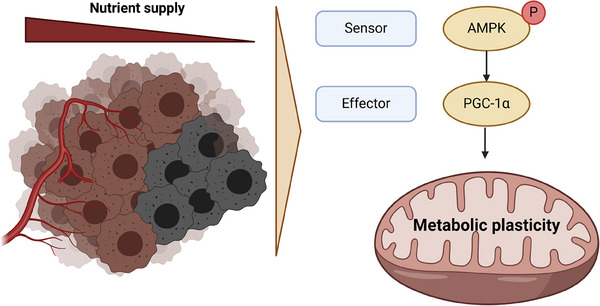
Glioblastoma, the most frequent primary malignant brain tumour in adults, is characterised by profound yet dynamic hypoxia and nutrient depletion. To sustain survival and proliferation, tumour cells are compelled to acquire metabolic plasticity with the induction of adaptive metabolic programs. Here, we interrogated the pathways necessary to enable processing of nutrients other than glucose. We employed genetic approaches (stable/inducible overexpression, CRISPR/Cas9 knockout), pharmacological interventions with a novel inhibitor of AMP-activated protein kinase (AMPK) in glioblastoma cell culture systems and a proteomic approach to investigate mechanisms of metabolic plasticity. Moreover, a spatially resolved multiomic analysis was employed to correlate the gene expression pattern of PGC-1α with the local metabolic and genetic architecture in human glioblastoma tissue sections. A switch from glucose to alternative nutrients triggered an activation of AMPK, which in turn activated PGC-1α-dependent adaptive programs promoting mitochondrial metabolism. This sensor-effector mechanism was essential for metabolic plasticity with both functional AMPK and PGC-1α necessary for survival and growth of cells under nonglucose nutrient sources. In human glioblastoma tissue specimens, PGC-1α-expression correlated with nonhypoxic tumour niches defining a specific metabolic compartment. Our findings reveal a cell-intrinsic nutrient sensing and switching mechanism. The exposure to alternative fuels triggers a starvation signal that subsequently is passed on via AMPK and PGC-1α to induce adaptive programs necessary for broader spectrum nutrient metabolism. The integration of spatially resolved transcriptomic data confirms the relevance of PGC-1α especially in nonhypoxic tumour regions. Thus, the AMPK-PGC-1α axis is a candidate for therapeutic inhibition in glioblastoma. KEY POINTS/HIGHLIGHTS: AMPK activation induces PGC-1α expression in glioblastoma during nutrient scarcity. PGC-1α enables metabolic plasticity by facilitating metabolism of alternative nutrients in glioblastoma. PGC-1α expression is inversely correlated with hypoxic tumour regions in human glioblastomas.

Keywords: AMP‐activated protein kinase; PGC‐1α; PPARGC1A; glioblastoma; hypoxia; metabolic plasticity; tumour microenvironment.


Conflict of interest statement

JPS reports honoraria for lectures or advisory board participation or consulting or travel grants from Abbvie, Roche, Boehringer, Bristol‐Myers Squibb, Medac, Mundipharma and UCB. Michael W. Ronellenfitsch reports a research grant from UCB as well as honoraria for advisory board participation from Alexion. All other authors declare no conflicts of interest.

Figures

FIGURE 1
FIGURE 1
Glioma cells are able to adapt to different nutrients. (A) LNT‐229 and G55T2 cells were incubated for 12 h in serum‐free medium without glutamine containing either 25 mM glucose (Glu) or galactose (Gal). Oxygen consumption was measured by a fluorescence‐based assay (n = 3, mean, **p < 0.01). (B) Cells were incubated for 8 h in serum‐free medium without glutamine containing either 25 mM glucose or galactose. Lactate production was quantified in the supernatant (n = 3, mean ± SD). (C) LNT‐229 Rho+ and Rho0 cells were incubated in serum‐free medium without glutamine containing either 25 mM glucose or galactose. Cell death was determined by propidium iodide staining after 24 h. The percentage of propidium iodide‐positive cells (PI‐A +) is indicated. (D–F) cDNA of LNT‐229 and G55T2 cells cultured for 5 days in full medium without glutamine and either 25 mM glucose or 25 mM galactose (D) and in serum‐free medium without glutamine containing 2 mM glucose with or without the addition of 5 mM hydroxybutyrate (3OHB) (E) or 100 µM linoleic acid (Linol) (F) for 5 days was generated. Gene expression of GALT and GALE (D), OXCT1 and ACAT1 (E), and CPT1c and HAHD (F) was quantified (n = 3, mean ± SD, *p < 0.05, **p < 0.01). (G, H) LNT‐229 and G55T2 cells were preconditioned in culture medium containing 25 mM glucose or 25 mM galactose for 5 days and were then incubated in serum‐free medium without glutamine containing 25 mM glucose or 25 mM galactose. Cell density was measured by crystal violet staining after 3 days (G); cell death was quantified by propidium iodide staining. The percentage of propidium iodide positive cells (PI‐A +) is indicated (n = 3, representative curves are displayed, **p < 0.01) (H). (I, J) Gene expression of PGC‐1α was quantified by qPCR using the cDNA described in D–F.
FIGURE 2
FIGURE 2
Overexpression of PGC‐1α induces an oxidative phenotype. (A) cDNA of empty vector (EV) and PGC‐1α overexpressing cells cultured in standard conditions was generated. Gene expression of ATP5G1, MT‐CO1 and MT‐ND1 was quantified by qPCR (n = 3, mean ± SD, *p < 0.05, **p < 0.01). (B) Cells were incubated in medium containing 10% FCS with 25 mM glucose. Oxygen consumption was measured by a fluorescence‐based assay (n = 3, mean, **p < 0.01). (C) cDNA of control and PGC‐1α overexpressing cells generated in (A) was analysed for expression of mtDNA D‐loop by qPCR (n = 3, mean ± SD, *p < 0.05). (D) Cells were incubated in culture‐medium containing 25 mM glucose and 10% FCS under normoxic conditions and 1% oxygen. Cell density was measured by crystal violet staining after 3 days (n = 3, mean ± SD). (E) Cells were exposed to glucose restricted (2 mM glucose) serum‐free DMEM under normoxic conditions (data not shown) or 0.1% oxygen until cell death (28 h). Cell death was quantified by by propidium iodide staining (left panel) and LDH release (right panel). The percentage of propidium iodide positive cells (PI‐A +) is indicated (n = 3, representative curves are displayed, **p < 0.01) as well as LDH‐release (n = 4, mean ± SD, **p < 0.01).
FIGURE 3
FIGURE 3
Overexpression of PGC‐1α facilitates use of alternative nutrients. (A–C) cDNA of LNT‐229 and G55T2 EV and PGC‐1α cells and LNT‐229 pTetOne PGC‐1α cells with and without 0.1 µg/mL doxycycline (± Dox) cultured in serum‐free medium for 24 h was generated. Gene expression of GALT and GALE (A), CPT1c and HAHD (B), and OXCT1 and ACAT1 (C) was quantified; values are normalised to 18S as well as SDHA housekeeping gene expression (n = 3, mean ± SD, *p < 0.05, **p < 0.01). (D) The cells were exposed to serum‐free medium without glutamine containing either 25 mM galactose or 2 mM glucose with the addition of 100 µM linoleic acid or 5 mM 3OHB. Cell density was measured by crystal violet staining after 3 days (n = 3, mean ± SD). (E) Cells were incubated in medium containing 5 mM galactose for 6 h. Remaining galactose in the medium was determined (n = 4, mean ± SD, *p < 0.05). (F) cDNA of HAP1 wt and HAP1 PGC‐1α KO cells cultured in 25 mM glucose or 25 mM galactose for 5 days was generated. Gene expression of GALE and GALT was quantified (n = 3, mean ± SD, *p < 0.05).
FIGURE 4
FIGURE 4
PGC‐1α is enhanced following AMPK activation. (A) LNT‐229 cells were incubated for 24 h in serum‐free medium and treated with 100 µM A‐769662 and 10 µM SB220025 as indicated. Cellular lysates were analysed by immunoblot with antibodies for PGC‐1α, Phospho‐p38 MAPK (Thr180/Tyr182), Phospho‐AMPKα (Thr172), p38 MAPK, AMPK α and actin. (B) cDNA of LNT‐229 and G55T2 cells treated with 100 µM A‐769662 for 24 h was generated. Gene expression of PGC‐1α was quantified; values are normalised to 18S as well as SDHA housekeeping gene expression (n = 3, mean ± SD, *p < 0.05, **p < 0.01).
FIGURE 5
FIGURE 5
Knockout of AMPK disturbs galactose metabolism. (A, B) LNT‐229 (left panel) and G55T2 (right panel) wt and AMPK DKO cells were incubated in medium containing 25 mM glucose or 25 mM galactose. Cell density was measured by crystal violet staining after 3 days (A). Cell death was determined by propidium iodide staining after 48 h (B). Representative photographs of the cells are included below the panels (bright field microscopy, 48× magnification). (C, D) cDNA of LNT‐229 (upper panel) and G55T2 (lower panel) wt and AMPK‐DKO cells maintained in culture medium with either glucose or galactose for 5 days was generated. Gene expression of PGC‐1α, GALE and GALT was quantified (n = 3, mean ± SD, *p < 0.05, **p < 0.01).
FIGURE 6
FIGURE 6
Pharmacological inhibition of AMPK disturbs galactose metabolism in primary cell models. P3NS cells were incubated for 12 h in medium containing either 25 mM glucose or 25 mM galactose and treated with vehicle, 1 µM BAY‐974 and with 1 µM BAY‐3827 as indicated. Cell lysates were analysed by antibodies against ACC, pACC, AMPK, pAMPK and actin. (B, C) P3NS cells and primary human astrocytes (B) as well as LNT‐229 and G55T2 cells (C) were incubated in medium containing either 25 mM glucose or galactose and treated with 1 µM BAY‐974 or 1 µM BAY‐3827. Cell death was quantified by PI staining after 24 h (n = 3, mean ± SD, *p < 0.05, **p < 0.01). The percentage of propidium iodide positive cells (PI‐A +) is indicated. (D, E) cDNA of LNT‐229 (D) and G55T2 (E) cells maintained in culture medium with either glucose or galactose for 5 days was generated. Gene expression of PGC‐1α, GALE and GALT was quantified (n = 3, mean ± SD, *p < 0.05, **p < 0.01).
FIGURE 7
FIGURE 7
PGC‐1α expression inversely correlates with hypoxia in human GB tissue. (A) GBMap analysis of PGC‐1α‐expression. Colours indicate the cell types and colour hue demonstrate individual cell states. PGC‐1α‐expression is demonstrated as dots in which the intensity is illustrated by shades of grey. (B) Expression of PGC‐1α among annotated cell populations. The size of the circles indicates the numbers of cell that express the gene and the colour indicate the relative expression level. (C) Spatial expression of PGC‐1α based on the spatially resolved transcriptomic dataset along with the histology H&E Images. (D) Spatial correlation of PGC‐1α‐expression and hypoxia gene expression abundance across tumour niches. (E) Multiomic spatial correlation of metabolic signatures (derived from metabolomic data from MALDI) and expression pattern of either PGC‐1α or hypoxia gene set enrichment (from expression data). The size of the circles demonstrates the spatial correlation value. (F) Spatial proximity plots of PGC‐1α expression and long‐chain‐saturated fatty acids metabolism.
FIGURE 8
FIGURE 8
Schematic drawing illustrating the mechanism of metabolic plasticity via AMPK‐dependent activation of PGC‐1α during nutrient deficiency in glioblastoma (GB). Created in BioRender (BioRender.com/m13m543).

References

    1. Ostrom QT, Cioffi G, Gittleman H, et al. CBTRUS Statistical Report: primary brain and other central nervous system tumors diagnosed in the United States in 2012–2016. Neuro‐oncology. 2019; 21(5): v1‐v100. doi:10.1093/neuonc/noz150 - DOI - PMC - PubMed
    1. Evans SM, Judy KD, Dunphy I, et al. Hypoxia is important in the biology and aggression of human glial brain tumors. Clin Cancer Res. 2004; 10(24): 8177‐8184. doi:10.1158/1078-0432.CCR-04-1081 - DOI - PubMed
    1. Warburg O, Posener K, Negelein E. Über den Stoffwechsel der Carcinomzelle. Biochem Z. 1924(152): 319‐344.
    1. Frezza C, Zheng L, Tennant DA, et al. Metabolic profiling of hypoxic cells revealed a catabolic signature required for cell survival. PLoS ONE. 2011; 6(9): e24411. doi:10.1371/journal.pone.0024411 - DOI - PMC - PubMed
    1. Lin H, Patel S, Affleck VS, et al. Fatty acid oxidation is required for the respiration and proliferation of malignant glioma cells. Neuro‐oncology. 2017; 19(1): 43‐54. doi:10.1093/neuonc/now128 - DOI - PMC - PubMed

MeSH terms

Substances