. 2025 Jan 16;46(3):308-322.
doi: 10.1093/eurheartj/ehae768.

Atheroma transcriptomics identifies ARNTL as a smooth muscle cell regulator and with clinical and genetic data improves risk stratification

Affiliations

Atheroma transcriptomics identifies ARNTL as a smooth muscle cell regulator and with clinical and genetic data improves risk stratification

Sampath Narayanan et al. Eur Heart J. .

Erratum in

Abstract

Background and aims: The role of vascular smooth muscle cells (SMCs) in atherosclerosis has evolved to indicate causal genetic links with the disease. Single cell RNA sequencing (scRNAseq) studies have identified multiple cell populations of mesenchymal origin within atherosclerotic lesions, including various SMC sub-phenotypes, but it is unknown how they relate to patient clinical parameters and genetics. Here, mesenchymal cell populations in atherosclerotic plaques were correlated with major coronary artery disease (CAD) genetic variants and functional analyses performed to identify SMC markers involved in the disease.

Methods: Bioinformatic deconvolution was done on bulk microarrays from carotid plaques in the Biobank of Karolinska Endarterectomies (BiKE, n = 125) using public plaque scRNAseq data and associated with patient clinical data and follow-up information. BiKE patients were clustered based on the deconvoluted cell fractions. Quantitative trait loci (QTLs) analyses were performed to predict the effect of CAD associated genetic variants on mesenchymal cell fractions (cfQTLs) and gene expression (eQTLs) in plaques.

Results: Lesions from symptomatic patients had higher fractions of Type 1 macrophages and pericytes, but lower fractions of classical and modulated SMCs compared with asymptomatic ones, particularly females. Presence of diabetes or statin treatment did not affect the cell fraction distribution. Clustering based on plaque cell fractions, revealed three patient groups, with relative differences in their stability profiles and associations to stroke, even during long-term follow-up. Several single nucleotide polymorphisms associated with plaque mesenchymal cell fractions, upstream of the circadian rhythm gene ARNTL were identified. In vitro silencing of ARNTL in human carotid SMCs increased the expression of contractile markers and attenuated cell proliferation.

Conclusions: This study shows the potential of combining scRNAseq data with vertically integrated clinical, genetic, and transcriptomic data from a large biobank of human plaques, for refinement of patient vulnerability and risk prediction stratification. The study revealed novel CAD-associated variants that may be functionally linked to SMCs in atherosclerotic plaques. Specifically, variants in the ARNTL gene may influence SMC ratios and function, and its role as a regulator of SMC proliferation should be further investigated.

Keywords: Atherosclerosis; Multi-omics; Plaques; Single-cell RNAseq; Smooth muscle cells.


Figures

Structured Graphical Abstract
An overview of the scientific questions, workflow design, and main findings of the study. CAD, coronary artery disease; GWAS, genome-wide association study; scRNAseq, single cell RNA sequencing; SMC, smooth muscle cell; SNP, single nucleotide polymorphism.
Figure 1
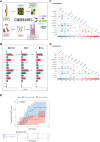
Figure 1
Deconvolution of Biobank of Karolinska Endarterectomies (BiKE) microarrays reveals differences in plaque cell composition with respect to patient symptoms and sex. (A) An illustration of the deconvolution workflow: CIBERSORT was used to deconvolve cell fractions from BiKE plaque microarrays (n = 127) using the publicly available gene expression signature matrix from the scRNA sequencing data of coronary arteries (n = 5). (B) The cell fractions from n = 125 plaques (due to the lack of clinical data for two patients) were stratified by clinical parameters such as symptoms, sex, and statin treatment. Statistical differences were calculated using Student’s t-test and did not survive a correction for multiple comparisons using FDR = 0.05. Data represented as mean ± SD Correlations among cell fractions were performed in plaques from symptomatic (C) and asymptomatic (D) patients. Asymptomatic patients n = 40, symptomatic n = 87. Correlations were calculated using Pearson correlation, coefficient indicated in the legend below the plots, *P < .05; **P < .01; ****P < .0001. (E) Kaplan—Meier plots showing the risk of future MACCEs in patients stratified by higher (75%) and lower (25%) quartile of deconvoluted Type 1 macrophage cell fractions. Statistical differences between survival curves were computed using log-rank test
Figure 2
Figure 2
Clustering of the patients based on plaque cell fractions reveals distinct phenotypes associated with clinical symptoms. (A) Biobank of Karolinska Endarterectomies patients were clustered based on plaque cell fractions using a hierarchical K-means clustering algorithm. Middle Cluster in green represents Cluster 1 (n = 53 patients), blue represents left Cluster 2 (n = 23) and red represents right Cluster 3 (n = 49). (B) Plaque cell fractions were stratified according to the 3 patient clusters. Statistical differences were calculated using one-way ANOVA and corrected for multiple comparisons using FDR = 0.05. Corrected P-values are displayed in each plot. Tukey’s post hoc test was performed to identify statistical differences between the clusters, *P < .05. (C) Kaplan—Meier plot showing the long-term risk of future ischemic stroke after carotid endarterectomy in patients stratified by three clusters (number of stroke events—Cluster 1: 50, Cluster 2: 22, Cluster 3: 47). Statistical differences between the survival curves were computed using log-rank test
Figure 3
Figure 3
Strategy for obtaining mesenchymal cell-specific CAD risk loci associated with target gene plaque expression and patient symptoms. A schematic representation of the strategy for filtering CAD-associated GWAS loci using their association with mesenchymal cell fractions (cfQTL), gene expression in Biobank of Karolinska Endarterectomies plaques (BiKE eQTL), and with respect to patient symptom as a covariate. The resultant mesenchymal cell-specific, symptom-specific BiKE eQTLs were used for further functional studies
Figure 4
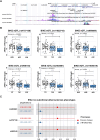
Figure 4
Several top mesenchymal cell—specific variants are eQTLs for ARNTL gene expression in plaques. (A) Snapshot view of the top ARNTL variants on the UCSC genome browser. The view shows that the variants are located at the intergenic (rs900145, rs2403661, rs11022742, and rs11605518) and regulatory regions (rs998089, rs4757138) of ARNTL (blue lines indicate each of the six variants). (B) Gene expression QTL in plaques was calculated for the top mesenchymal cell—specific variants in ARNTL—rs4757138, rs11022742, rs998089, rs900145, rs2403661, and rs11605518. eQTL—expression quantitative trait locus. Statistical differences were calculated using one-way ANOVA and Tukey’s post hoc test was performed to identify statistical differences between individual alleles, *P < .05. (C) Association of ARNTL variants rs2403661, rs4757138, and rs900145 with sub-clinical atherosclerosis phenotypes, i.e. the presence of plaques and growing carotid intima-media thickness, was tested in the IMPROVE study cohort
Figure 5
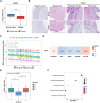
Figure 5
ARNTL is down-regulated in carotid plaques and negatively correlated with typical SMC markers. (A) Boxplot of ARNTL gene expression in Biobank of Karolinska Endarterectomies (BiKE) normal arteries and carotid plaques. Statistical difference was calculated using student t-test, **P < .01. (B) Representative images of immunohistochemical staining of BMAL1 (ARNTL) and α-SMA in normal arteries, as well as remnants of media and fibrous cap regions of human carotid plaques. Scale bar for original image = 500 µm; scale bar for inset image = 100 µm. (C) ARNTL expression was negatively correlated with SMC contractile markers (ACTA2, MYH11, SMTN, CNN1, and LMOD1) in BiKE plaques. (D) ARNTL expression in plaques was negatively correlated with mesenchymal cell fractions, i.e. SMC1, SMC2, modulated SMC, but positively with pericytes and marginally also with fibroblasts. Correlations were computed using Spearman rho method and P-values after correction for multiple testing (FDR = 0.05) are displayed within the correlation plots. (E) Box plot of ARNTL gene expression in each of the three patient clusters. Statistical differences were calculated using one-way ANOVA and Tukey’s post hoc test was performed to identify statistical differences between clusters, ***P < .001. (F) Global correlations of ARNTL gene expression with all genes in BiKE plaques were performed, followed by GSEA. Highly enriched Hallmark pathways from the GSEA analysis are shown in a dot plot. ACTA2, α-SMA; CNN1, calponin1; MYH11, myosin heavy chain-11; LMOD1, leiomodin1; SMTN, smoothelin
Figure 6
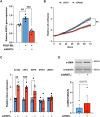
Figure 6
Silencing ARNTL in human carotid SMCs inhibits proliferation and induces cellular senescence. Human carotid SMCs were treated with siRNA against ARNTL followed by functional assays. SMCs were also treated with or without PDGF-BB after ARNTL silencing and ARNTL gene expression levels were measured (A). (B) Proliferation was measured as a function of cell confluence using Incucyte Zoom system (Essen BioScience) (n = 4). (C) Gene expression levels of contractile SMC markers were measured using qRT-PCR (n = 4) and (D) protein levels of contractile protein α-SMA (42 kDa). Protein levels were quantified using immunoblots from 3 experiments and representative blots are shown. ACTA2, α-SMA; CNN1, calponin1; MYH11, myosin heavy chain-11; LMOD1, leiomodin1; SMTN, smoothelin; α-SMA. Data points are represented as mean ± SEM. Statistical differences were calculated using student t-test. *P < .05, **P < .01, ***P < .001
Figure 7
Figure 7
This study revealed novel mesenchymal cell-specific, CAD-related plaque variants (rs4757138 shown here as an example) in the ARNTL gene locus. Presence of the rs4757138 minor allele (A/A) (right panel) associated with a significant decrease in ARNTL expression levels relative to that of the major G/G allele (left panel) in carotid plaques, presumably caused by mesenchymal cells. Indeed, silencing of ARNTL gene expression in primary human SMCs in vitro led to a decrease in proliferation

References

    1. Owens GK. Regulation of differentiation of vascular smooth muscle cells. Physiol Rev 1995;75:487–517. 10.1152/physrev.1995.75.3.487 - DOI - PubMed
    1. Gomez D, Owens GK. Smooth muscle cell phenotypic switching in atherosclerosis. Cardiovasc Res 2012;95:156–64. 10.1093/cvr/cvs115 - DOI - PMC - PubMed
    1. Wirka RC, Wagh D, Paik DT, Pjanic M, Nguyen T, Miller CL, et al. Atheroprotective roles of smooth muscle cell phenotypic modulation and the TCF21 disease gene as revealed by single-cell analysis. Nat Med 2019;25:1280–9. 10.1038/s41591-019-0512-5. - DOI - PMC - PubMed
    1. Allahverdian S, Chehroudi AC, McManus BM, Abraham T, Francis GA. Contribution of intimal smooth muscle cells to cholesterol accumulation and macrophage-like cells in human atherosclerosis. Circulation 2014;129:1551–9. 10.1161/CIRCULATIONAHA.113.005015 - DOI - PubMed
    1. Shi Y, Pieniek M, Fard A, O’Brien J, Mannion JD, Zalewski A. Adventitial remodeling after coronary arterial injury. Circulation 1996;93:340–8. 10.1161/01.CIR.93.2.340 - DOI - PubMed

MeSH terms

Substances